Xinmiao Bu1, Ailian Liu1, Ye Ju1, Wenjun Hu1, Changyu Du2, Haoyang Jiang2, and Lingli Qi2
1The First Affiliated Hospital of Dalian Medical University, Dalian, China, 2Dalian Medical University, Dalian, China
Synopsis
IDEAL-IQ technology is a new scanning
sequence which corrects many mixed factors that interfere with fat
quantification to realize the quantitative measurement of fat fraction. We retrospectively analyzed 42
patients with diabetic nephropathy in our hospital from March 2017 to December
2019. According to the presence of proteinuria, they were divided into severe group and mild group.The
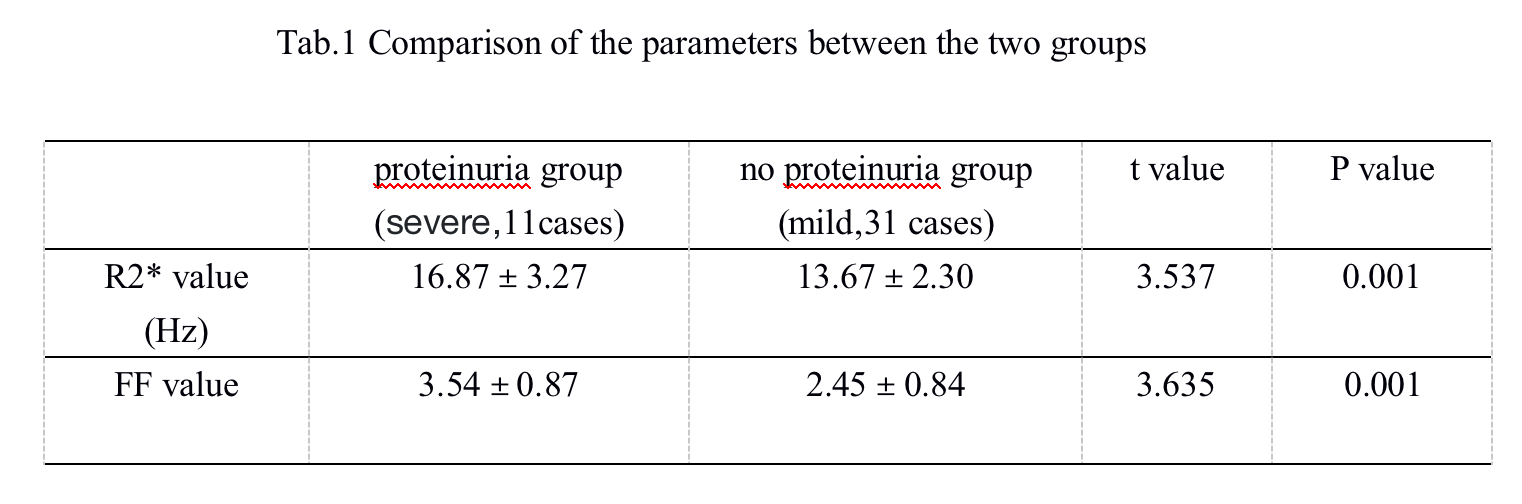
R2* and FF value of the severe group was greater than that of the mild group, the difference was statistically
significant (P <0.05).The AUC value of severe
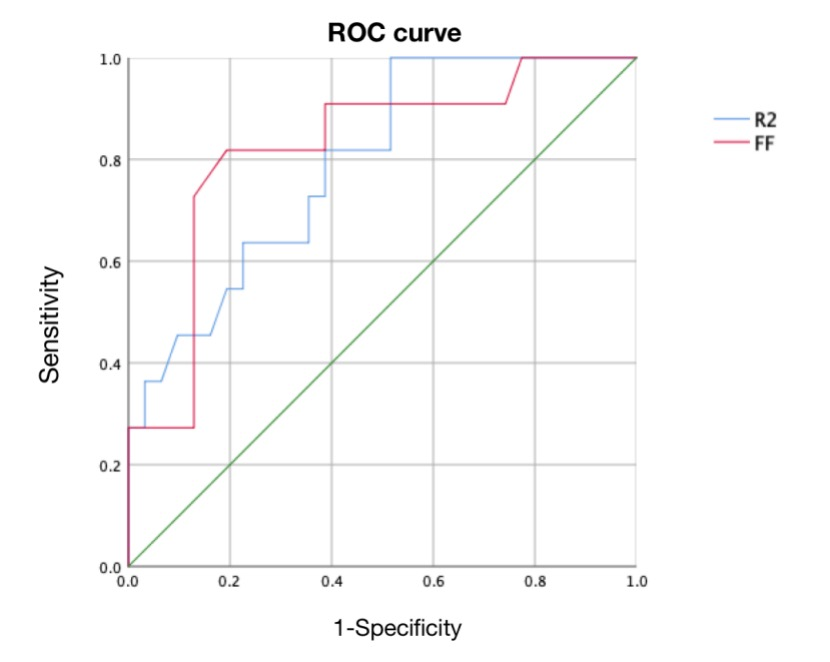
value and mild value for identifying severe with mild groups are 0.792 and 0.823。
Introduction
Diabetic nephropathy is one of the most important microvascular complications of diabetes, and it has a high incidence and a poor prognosis. Since clinical biomarkers such as glomerular filtration rate and proteinuria tend to deteriorate only later in the course of the disease, we often ignore the progression of kidney disease. We need to find an early method to distinguish mild and severe diabetic nephropathy. IDEAL-IQ technology is a new scanning sequence based on the principle of three-point Dixon asymmetric echo technology. This technique corrects many mixed factors that interfere with fat quantification, such as T2* attenuation、fat multispectral peak distribution、magnetic field inhomogeneity、T1 relaxation、noise bias and eddy current,which can realize the quantitative measurement of fat fraction[1]. Methods
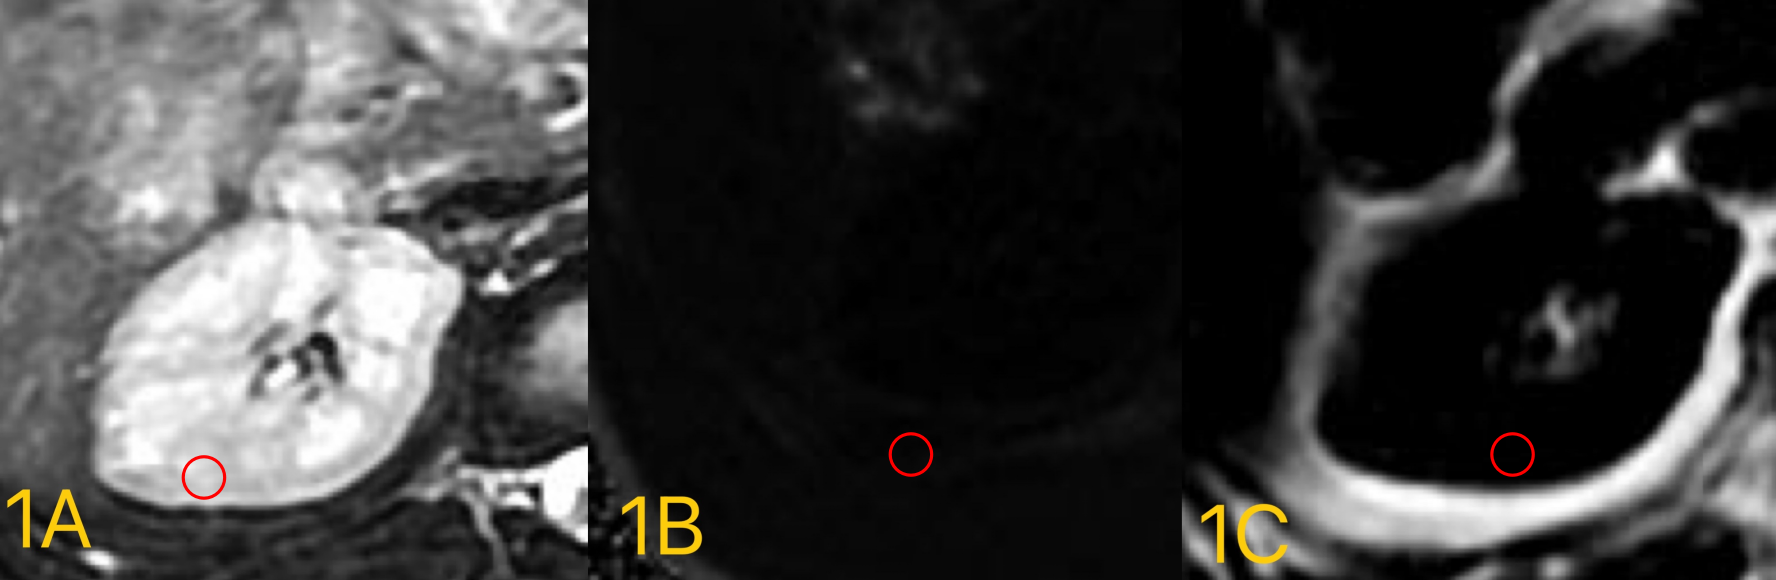
We retrospectively analyzed 42 patients with diabetic nephropathy in our hospital from March 2017 to December 2019. It was scanned by GE signa hdxt 1.5T MR scanner. According to the presence of proteinuria, they were divided into proteinuria group (severe group,11 cases) and no proteinuria group (mild group,31cases).The image data of IDEAL-IQ is transmitted to aw 4.6 workstation, and the image is post processed to obtain R2* and FF images, as shown in Figure 1. Two radiologists (observers 1 and 2) with 3 and 8 years of experience in abdominal MR diagnosis completed the data measurement respectively, but they did not know the clinical diagnosis results of the patients. According to conventional MR images, the largest cross section of right renal parenchyma region was selected to describe ROI, with an area of about 5-7mm2. The ROI of upper and lower adjacent layers was depicted, and the average value of the three was taken to avoid renal sinuses and large vessels. Two kinds of IDEAL-IQ post-processing images can be converted to each other in the workstation to ensure that ROI is placed in the same position on the two images.Software SPSS 26.0 was used for statistical analysis. Shapiro-Wilk was used to test whether each data conforms to the normal distribution. Those conforming to the normal distribution are represented by x±s, and those conforming to the skewed distribution are represented by the median (P25, P75). The intra-group correlation coefficient (ICC) was used to test the consistency of the measurement results of the two observers on the parameter values of the two groups of cases. 0.4 and 0.75 were used as the cut-off points for the evaluation of poor, medium, and good consistency, and the measurement results of the senior observer The average value is analyzed.Independent sample t test (normal distribution) or Mann-Whitney U test (skew distribution) was used to compare the differences between the IDEAL-IQ parameter values of the two groups. Draw the ROC curve for the different parameters to obtain the area under curve(AUC).And obtaining the cut-off value, sensitivity and specificity of the corresponding parameter diagnosis according to the maximum Youden index. P<0.05 indicates that the difference is statistically significant.Results
Measurement consistency between the two observers was good (ICC > 0.75). The R2* and FF value of the severe group was greater than that of the mild group, the difference was statistically significant (P <0.05), as shown in Table 1. The AUC value, threshold, sensitivity, and specificity of severe value and mild value for identifying severe with mild groups are0.792、14.35、81.8%、61.3%and 0.823、3.15、81.8%、80.6%, ROC curve is shown in Figure 2.Discussion
IDEAL-IQ technology corrects many mixed factors that interfere with fat quantification, such as fat multispectral peak distribution, T1 relaxation, noise bias, etc. Finally, accurate quantitative image fat ratio, namely FF value, is generated. The FF value in the severe group was higher than that in the mild group, which may be due to the gradual increase of intracellular fat content with the aggravation of diabetic nephropathy. The difference between the two was increased by quantitative measurement of FF value, which made it possible to predict the severity of diabetic nephropathy by means of radiology. R2* value, also called transverse relaxation rate, is positively correlated with the concentration of deoxyhemoglobin in tissues, which is obtained by gradient recombination at different times. The R2* value in the severe group was higher than that in the mild group. It is speculated that severe diabetic nephropathy may cause the increase of cell number per unit volume and the improvement of metabolic level, resulting in the decrease of blood oxygen saturation and the increase of deoxyhemoglobin concentration, which is manifested as the increase of R2* value.Conclusion
In conclusion, the R2* and FF values of IDEAL-IQ sequence can differentiate severe diabetic nephropathy from mild ones. It is a noninvasive, non enhancement method, and has certain clinical application value.Acknowledgements
Thanks to my dear teacher and all my friends,sincerely.References
[1]Idilman IS,Tuzun A,Savas B,et al. Quantification of liver,pancte-as,kidney,and vertebral body MRI-PDFF in non-alcoholic fatty liver disease[J]. Abdom Imaging,2015,40: 1512-1519. [2] Uygun A,Kadayifci A,Demirci H,et al. The effect of fatty pancreas on serum glucose parameters in patients with nonalcoholic steatohep- atitis[J]. Eur J Intern Med,2015,26:37-41. [3] Idilman IS,Tuzun A,Savas B,et al. Quantification of liver,pancte-as,kidney,and vertebral body MRI-PDFF in non-alcoholic fatty liver disease[J]. Abdom Imaging,2015,40: 1512-1519.