1894
31P MRS and MRI phenotyping of muscle metabolic quality in Inflammatory Bowel Disease fatigue1Nottingham Digestive Diseases Centre, Queens Medical Centre, Nottingham, United Kingdom, 2Sir Peter Mansfield Imaging Centre, Nottingham, United Kingdom, 3School of Medicine, University of Nottingham, Nottingham, United Kingdom, 4School of Life Sciences, University of Nottingham, Nottingham, United Kingdom, 5MRC Versus Arthritis Centre for Musculoskeletal Ageing Research, Nottingham, United Kingdom, 6Centre for Sport, Exercise and Osteoarthritis Research Versus Arthritis, Nottingham, United Kingdom, 7National Institute of Health Research (NIHR) Nottingham Biomedical Research Centre, Nottingham, United Kingdom
Synopsis
Fatigue is a prevalent and debilitating symptom in Inflammatory Bowel Disease (IBD) with an unclear aetiology. Sarcopenia and muscle deconditioning are common in IBD, implicating peripheral mechanisms in IBD fatigue. We carried out functional, 31P MRS and MRI phenotyping of quiescent IBD patients with fatigue complaints and a healthy control group, to characterise peripheral contributions to fatigue aetiology. Collectively, the reduced rate of PCr resynthesis and concomitant maintenance of muscle mass and strength in IBD patients suggests that IBD fatigue may be attributable to peripheral muscle deconditioning, which could potentially be restored by exercise training intervention.
Introduction
IBD fatigue can manifest as a disproportionate perception of exhaustion1 and reduced exercise tolerance2. Available data evidence peripheral muscle deconditioning3 and impaired cardiovascular fitness in IBD4, which are of a greater magnitude in those with subjective fatigue complaints, relative to those without5. To further investigate peripheral muscle contributions to premature fatigue development in quiescent IBD, we applied 31P MRS measurements during recovery from high-intensity ischemic exercise in fatigued Crohn’s Disease patients (CD) and healthy control subjects (HC). Muscle phosphocreatine (PCr) resynthesis is completely supressed under ischaemia6 as it is entirely mitochondrial dependent7. We assessed muscle metabolic quality by quantifying the time-course of PCr recovery from high-intensity ischemic contraction after reinstating limb blood flow.Methods
31P MRS and MRI Acquisition (Fig.1 & 2): Prior to MRI, participant body mass, whole body and regional body composition was assessed by DEXA scan. All MR data was collected on a 3T Philips Achieva scanner, using a 14cm 31P coil secured over the medial gastrocnemius. Volunteers lay in a supine position on the MR bed with their dominant limb secured into an MR-compatible plantar flexion ergometer (Trispect, Ergospect) and their knee fixed at approximately 30°. Calf muscle maximum voluntary contraction (MVC) was first recorded. An inflatable blood pressure cuff was then placed around the leg at the distal femur region. 1H mDIXON scans were acquired to image the calf muscle volume and fat fraction (%). A 16-minute non-localized pulse-acquire 31P-MRS assessment followed. 31P-MR spectra were collected under resting conditions for ~ 1 minute, the blood pressure cuff was then inflated to 250mmHg and maintained at this level for 2-minutes prior to ischemic plantar flexions at 50% MVC until contractile failure. Ischemia was maintained post-exercise for 30-seconds after which lower limb blood flow was reinstated. 31P MRS acquisition continued during exercise recovery.Data Analysis: 31P spectra were analysed using jMRUI Beta 6.0,31P-MR spectra were apodized to 10Hz with Lorentzian fitting. 31P spectra peaks including inorganic phosphate (Pi) PCr, and ATP subunits (γ-ATP,α-ATP,β-ATP) were fit using the AMARES function with prior knowledge. The exercise kinetics for PCr was expressed relative to baseline signal amplitude. Cytosolic pH was calculated using the chemical shift difference δ between Pi and PCr peaks pH = pK + log(δ1 - δ0 /δ0 - δ2) where pK = 6.75, δ1 = 3.27, δ2 = 5.63. The PCr recovery curve was fit to a mono-exponential function in GraphPad prism. (PCr(t) = PCrinitial+(PCrend – PCrinitial)(1-exp(-k.t)) where t is the time from the start of recovery, PCrinitial and PCrend is the PCr content at the initial and end of recovery phases.
Statistical Analysis: Data normality was checked by visual inspection of box plots, and analysed by a two group comparison. Normally distributed data were analysed by Welch’s independent t-test, and non-parametric data by a Mann-Whitney independent t-test.
Results
Baseline data (Figure 3,I): Crohn’s Disease patients and HCs were matched for age (P=0.878) and BMI (P=0.524). The mean fatigue score on the general domain of the MFI-20 questionnaire for CD patients (13 ± 5) was significantly higher (t9 = 2.7, P = 0.024) than the HC group (7 ± 3). There was no significant difference (t9=1.1, P=0.294) for the mean fatigue scores on the physical domain of the MFI-20 scale between the CD patients (10±5) and HC group (7±2).Body composition (Figure 3,II): Whole-body (P=0.190) and appendicular (P=0.172) lean mass, and whole calf muscle volume (P=0.42) were not different between CD patients and HC's, and calf fat fraction was similar between groups (P=0.741). Isometric calf strength was no different between the CD and HC when normalised to Lean Mass Index (P=0.292), Appendicular Lean Mass Index (P=0.31) and whole calf muscle volume (P=0.628).
Strength and exercise performance (Figure 4, III): Exercise duration and mean power output during the in-bore ischaemic exercise task was no different between CD and HCs (P=0.208 and P=0.628, respectively).
Metabolic physiology (Figure 4,IV): End-exercise muscle PCr content (P=0.461) and end-exercise muscle pH (P=0.649) was no different between CD and HCs. The end recovery plateau of PCr was no different (P=0.788) between the CD (105±14 %) and HCs (102±16%). The mean rate constant of PCr resynthesis (kPCr min-1) in CD patients (0.75 ± 0.14) was significantly less (t6 = 2.8, P = 0.028) than HCs (0.99 ± 0.13). PCr recovery curves were well described using a mono-exponential function in CD (R2=0.99±0.00) and HCs (R2=0.98±0.01).
Discussion
We show a slower rate of PCr resynthesis following standardised, high-intensity, ischemic contraction in CD patients with fatigue complaints relative to age and BMI matched HCs, despite maintenance of whole-body and appendicular lean mass, calf muscle volume and isometric strength. The collective findings suggest peripheral muscle deconditioning in the absence of muscle mass and strength loss. This provides a metabolic basis for performance deficits reported in CD, where the gradient of force decline during repeated knee extensor exercise is greater in CD compared to HC2. Exercise training interventions aimed at increasing mitochondrial mass8 may represent a pragmatic treatment target for IBD fatigue.Conclusion
PCr resynthesis rate following ischemic exercise is reduced in CD patients relative to HC. This suggests a loss of mitochondrial mass in IBD fatigue aetiology, which may be restored by exercise training intervention.Acknowledgements
This research is funded by Crohn's and Colitis UK (CCUK) medical research award and supported by the Nottingham Biomedical Research Centre. Jordan McGing is in receipt of a Joane Browne Legacy PhD studentship at the University of Nottingham.References
- Beck, A., Bager, P., Jensen, P. E. & Dahlerup, J. F. How Fatigue Is Experienced and Handled by Female Outpatients with Inflammatory Bowel Disease. Gastroenterol. Res. Pract.2013 1–8 .
- Van Langenberg, D. R. et al. Objectively measured muscle fatigue in Crohn’s disease: Correlation with self-reported fatigue and associated factors for clinical application. J. Crohn’s Colitis 2014;(8):137–146
- de Souza Tajiri, G. J., de Castro, C. L. N. & Zaltman, C. Progressive resistance training improves muscle strength in women with inflammatory bowel disease and quadriceps weakness. J. Crohn’s Colitis 2014;(8):1749–1750 .
- Otto, J. M. et al. Preoperative exercise capacity in adult inflammatory bowel disease sufferers, determined by cardiopulmonary exercise testing. Int. J. Colorectal Dis. 2012;27:1485–1491 .
- Vogelaar, L. et al. Physical fitness and physical activity in fatigued and non-fatigued inflammatory bowel disease patients. Scand. J. Gastroenterol.2015;50:1357–1367 .
- Quistorff, B., Johansen, L. & Sahlin, K. Absence of phosphocreatine resynthesis in human calf muscle during ischaemic recovery. Biochem. J. 1993;291:681–686 .
- Harris, R. C. et al. The time course of phosphorylcreatine resynthesis during recovery of the quadriceps muscle in man. Pflügers Arch. Eur. J. Physiol.1976;367:137–142 .
- Meinild Lundby, A. K. et al. Exercise training increases skeletal muscle mitochondrial volume density by enlargement of existing mitochondria and not de novo biogenesis. Acta Physiol.2018;222.
Figures


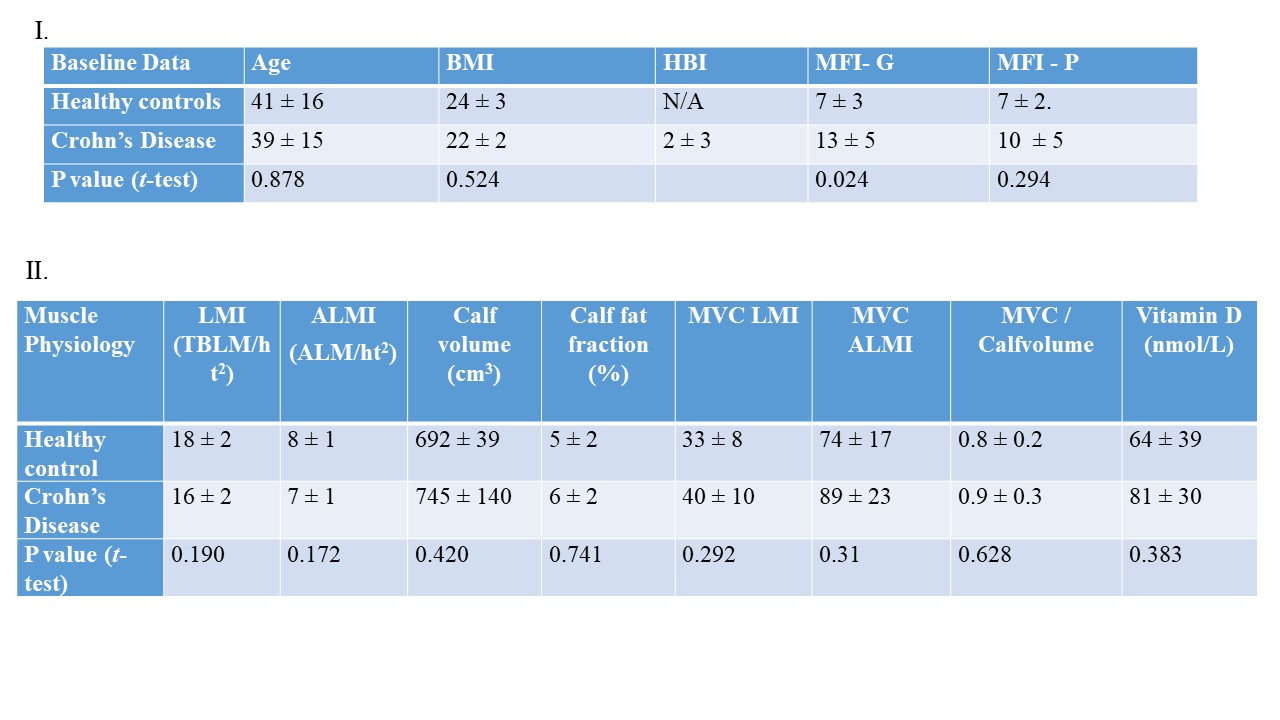
Figure 3, I: Baseline data comparisons (Mean ± SD) between healthy controls (HC) and Crohn’s Disease patients (CD). Age, Body mass index (BMI), Disease activity (HBI), Multiple Fatigue Inventory -20 (MFI-20) General domain scores, MFI-20 Physical domain scores.
II: Baseline muscle physiology data comparisons (Mean ± SD) between HC and CD. Lean Mass Index, Appendicular Lean Mass Index (ALMI), Whole Calf Muscle Volume (cm3), Calf muscle fat fraction %, Calf MVC normalised to LMI, Calf MVC normalised to ALMI, Calf MVC normalised to Calf muscle volume, Vitamin D concentrations (nmol/L).

Figure 4, III : Exercise data comparisons for ischemic plantar flexion exercise at 50% MVC. Exercise duration, Mean power, % PCr depletion at contractile failure and end-exercise pH.
IV : Mean ± SD for PCr recovery Plateau, kPCr and the quality of non-linear monoexponential curve fit.
