1892
Early Detection of Type 2 Diabetes Mellitus with Mild Cognitive Impairment based on Multiple Advanced Diffusion Models: DKI, MAP-MRI and NODDI1Department of Radiology, The First Affiliated Hospital of Guangzhou University of Chinese Medicine, Guangzhou, China, 2MR Scientific Marketing, SIEMENS Healthcare, Shanghai, China, 3Shanghai University of Medicine & Health Sciences, Shanghai, China, 4Shanghai Key Laboratory of Magnetic Resonance, East China Normal University, Shanghai, China
Synopsis
Compare to pathological examination and cognitive assessment scale, diffusion imaging can detect microscopic diffusion properties of biological tissues noninvasively and repeatably. This study aimed to evaluate the ability of multiple advanced diffusion models reconstructed by diffusion sequence: MAP-MRI, NODDI, and DKI in the early detection of Type 2 diabetes mellitus (T2DM) patients with mild cognitive impairment (MCI).
Purpose
Type 2 diabetes mellitus (T2DM) has been proved to associated with an elevated risk of cognitive impairment and dementia. This study aimed to investigate whether advanced diffusion models, including diffusion kurtosis imaging (DKI), mean apparent propagator (MAP)-MRI, and neurite orientation dispersion and density imaging (NODDI), could be used to detect microstructural changes in the brain of diabetic patients with mild cognitive impairment (MCI) at an early stage and to compare the diagnostic ability of different diffusion parameters.Methods
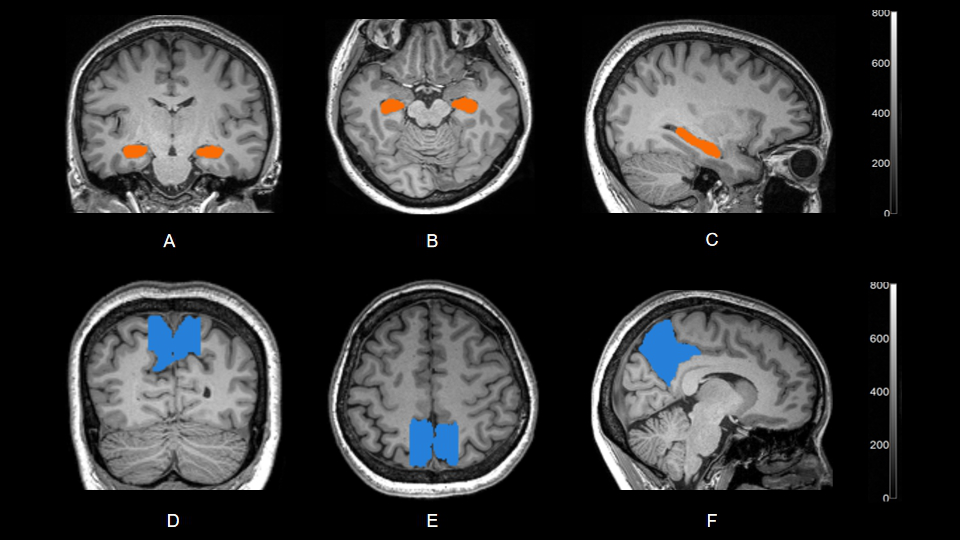
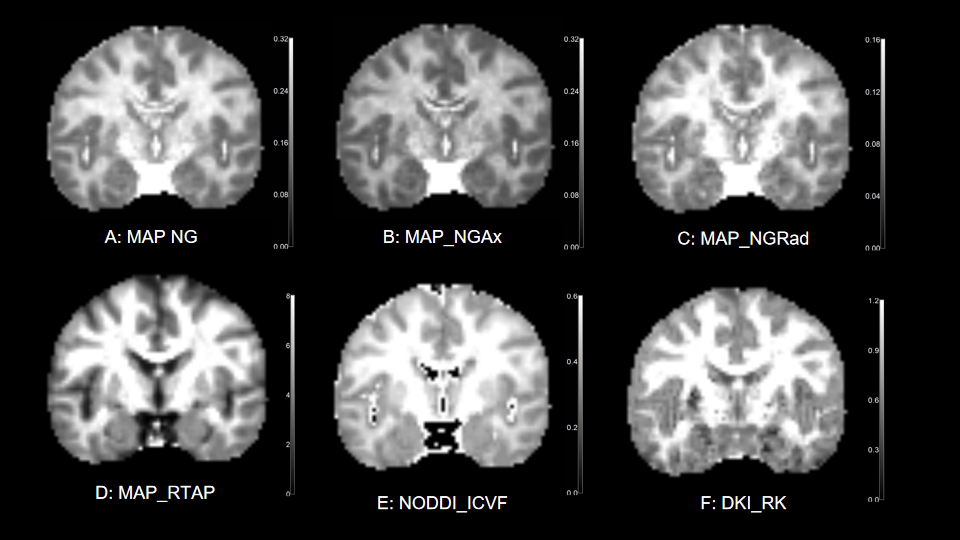
Totally 42 participants (age: 40-65y) without any other diseases which might affect brain structure and cognitive function were enrolled in the study. All the subjects were divided into 3 groups: T2DM patients with mild cognitive impairment (T2DM_MCI, 16 cases, mean age: 52.94 ± 6.57 years, F/M: 6/10), T2DM patients without cognitive impairment (T2DM_UCI, 16 cases, mean age: 51.88 ± 6.15 years, F/M: 7/9), and healthy controls (HC, 10 cases, mean age: 51.90 ± 6.64 years, F/M: 6/4). The T2DM patients were diagnosed by at least two professional endocrinologists in accordance with the criteria of the American Diabetes Association (ADA). The diagnostic criteria for mild cognitive impairment were based on participants' Montreal Cognitive Assessment (MoCA) scores. All the participants underwent conventional head MRI scans, including 3D T1WI MPRAGE, T2WI FLAIR sequences as well as diffusion imaging with a q-space Cartesian grid sampling procedure, on a 3T MR scanner (MAGNETOM Prisma; Siemens Healthcare, Erlangen, Germany) with a 64-channel of head-neck coil. The parameters of diffusion sequence were: FOV = 220 × 220 mm2, slice thickness = 2.0 mm, slices number = 76, voxel size = 2.0 × 2.0 × 2.0 mm3, TR/TE = 4200/72 ms, maximum b value = 3000 s/mm2, with 98 diffusion gradient directions, total time = 7 min 31s. DKI, MAP-MRI and NODDI models were calculated using all the diffusion data with an in-house developed post-processing software called NeuDiLab, which is based on an open-resource tool DIPY (Diffusion Imaging in Python, http://nipy.org/dipy). Parameters from calculated models included radial kurtosis (RK) from DKI; intracellular volume fraction (ICVF) from NODDI; return to the axis probability (RTAP), non-Gaussianity (NG), non-gaussian parallel (NGAx), and non-gaussian vertical (NGRad) from MAP-MRI. For ROI analysis, the bilateral hippocampus and bilateral precuneus were selected as the region of interests (ROIs). The ROI of each subject were manually delineated and extracted respectively using a software named MRIcroN on 3D T1WI MPRAGE imaging. Then the ROIs were applied to all the calculated diffusion parameter maps to extract corresponding average values. For statistical analysis, differences of all diffusion parameters between patient groups were compared in pairs by using the independent Student's t-test. P < 0.05 was considered to be statistically significant. Pearson correlation analysis was used to analyze the correlation between diffusion parameters and clinical scales, such as Grooved pegboard test and AVLT scores.Results
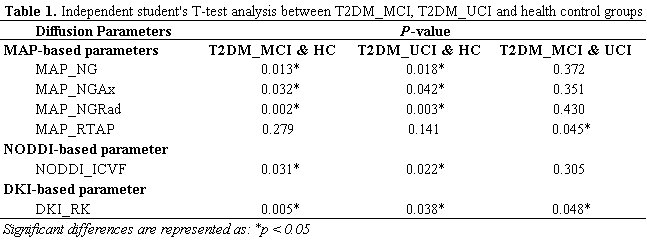
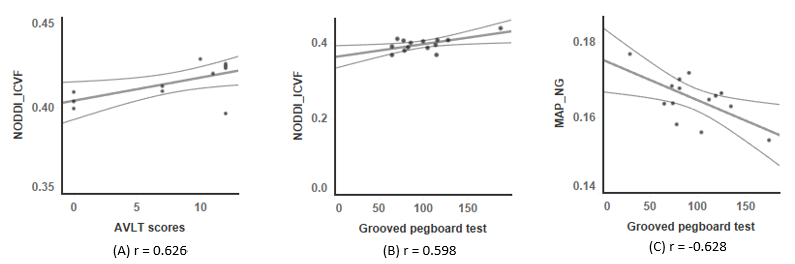
The diffusion parameters with statistical significance were shown in Table 1. NG, NGAx, NGRad from MAP, and ICVF from NODDI of the two T2DM patient groups were significantly higher than those of healthy control group (P < 0.05). RTAP from MAP and RK from DKI of T2DM patients with mild cognitive impairment were significantly higher than those of T2DM patients without cognitive impairment (P < 0.05). Pearson correlation analysis showed that MAP_NG, NODDI_ ICVF had a good correlation with Grooved pegboard test (r = -0.628 and r = 0.598, respectively). NODDI_ ICVF was also correlated with AVLT delay and recall scores (r = 0.626).Discussion and Conclusion
Early detection of mild cognitive impairment and provision of diagnostic basis is of great significance for delaying the process of cognitive decline and reducing the incidence of dementia in T2DM patients. This study showed that NG serial parameters from MAP-MRI and ICVF from NODDI had significant differences between T2DM patients and healthy controls, but they can’t differentiate the T2DM patients with or without mild cognitive impairment. However, The RK from DKI had significant differences between any two groups, including two T2DM groups. This finding means the RK is more sensitive to brain microstructure changes than other parameters.MAP-, NODDI-, DKI-based diffusion parameters were sensitive to differences between T2DM patients with mild cognitive impairment, T2DM patients without cognitive impairment, and healthy participants in hippocampus and precuneus, which suggested those parameters could be used as potential biomarkers for the differential diagnosis of these groups. The good performance of multiple diffusion models (DKI, NODDI, MAP) reconstructed by DSI sequence indicates that these features would offer more brain’s microstructure information and contribute to diagnosis in powerful ways.Acknowledgements
No acknowledgement found.References
1. Avram, A. V., Sarlls, J. E., Barnett, A. S. E. Ö, Thomas, C., Irfanoglu, M. O., Hutchinson, E., et al. Clinical feasibility of using mean apparent propagator (MAP) MRI to characterize brain tissue microstructure. Neuroimage, 2016;127:422-434.
2. Ma, K., Zhang, X., Zhang, H., Yan, X., Gao, A., Song, C., et al. Mean apparent propagator-MRI: a new diffffusion model which improves temporal lobe epilepsy lateralization. Eur. J. Radiol, 2020; 126:108914.
3. Biessels Geert Jan, Despa Florin, Cognitive decline and dementia in diabetes mellitus: mechanisms and clinical implications. Nat Rev Endocrinol, 2018,14:591-604.
4. Vergoossen Laura W, Schram Miranda T, de Jong Joost J et al. White matter connectivity abnormalities in prediabetes and type 2 diabetes: The maastricht study. Diabetes Care, 2020,43:201-208.
5. Groeneveld O, Reijmer Y, Heinen R et al. Brain imaging correlates of mild cognitive impairment and early dementia in patients with type 2 diabetes mellitus. Nutr Metab Cardiovasc Dis, 2018,28:1253-1260.
6. Biessels Geert Jan, Nobili Flavio, Teunissen Charlotte E et al. Understanding multifactorial brain changes in type 2 diabetes: a biomarker perspective. Lancet Neurol, 2020,19:699-710.
Figures