1891
Study on cerebral perfusion characteristic network of type 2 diabetes mellitus using 3D arterial spin labeling imaging1The Affiliated Hospital of Yangzhou University, yangzhou, China, 2GE Healthcare, MR Research China, Beijing, Beijing, China
Synopsis
This study aimed to investigate the cerebral microcirculatory blood flow perfusion and perfusion patterns in patients with type 2 diabetes by using 3D arterial spin labeling (ASL) imaging, and to analyze the correlation between perfusion changes and biochemical indexes. We obtained 3D-ASL derived cerebral blood flow (CBF) and perfusion feature network using principal component analysis (PCA) on each subject accordingly. These diabetic patients showed low regional CBF, and PCA-based perfusion characteristics could identify patients with diabetes. Changed perfusion patterns reflected the remodeling of cerebral blood flow perfusion, revealing clinical value and significance for early diagnosis and intervention of diabetic microangiopathy.
Synopsis
This study aimed to investigate the cerebral microcirculatory blood flow perfusion and perfusion patterns in patients with type 2 diabetes by using 3D arterial spin labeling (ASL) imaging, and to analyze the correlation between perfusion changes and biochemical indexes. We obtained 3D-ASL derived cerebral blood flow (CBF) and perfusion feature network using principal component analysis (PCA) on each subject accordingly. These diabetic patients showed low regional CBF, and PCA-based perfusion characteristics could identify patients with diabetes. Changed perfusion patterns reflected the remodeling of cerebral blood flow perfusion, revealing clinical value and significance for early diagnosis and intervention of diabetic microangiopathy.Body of the Abstract
Purpose:Hyperinsulinemia and deposition of glucose and lipoprotein-related proteins caused by type 2 diabetes could destroy the regulatory function of cerebral vascular and affect cerebral blood flow (CBF) perfusion. Most previous studies focused on the CBF difference in whole brain or cerebral cortex of diabetic patients[1]. However, as an indirect indicator of diabetic microangiopathy, CBF was not independent. The variation of CBF between individuals should be synchronous in brain areas which were supplied by the same artery. In this way, a cerebral perfusion network with regional distribution characteristics would be formed, which could also reflect the changes of CBF perfusion. To validate this hypothesis, we therefore investigated if combined 3D arterial spin labeling (ASL) imaging and scaled sub-profile model/principal component analysis (SSM/PCA) methods could identify the patterns and regional differences of CBF between T2DM and HC groups.Materials and Methods:Subjects30 patients with type 2 diabetes,diagnosed clinically according to The Chinese Guidelines for the Prevention and treatment of Type 2 diabetes (2017 edition), were selected in this study. 26 healthy controls with FBG<6.1 mmol/L and 2HPG in OGTT <7.8 mmol/L were also recruited. All subjects ranged in age from 50 to 70 years old and were right-handed. All patients followed the regular diabetes treatment, diet control, insulin injection and oral hypoglycemic drugs. Collected general clinical data included medical history, medication history, weight, and height. All subjects were sampled elbow venous blood under fasting state, and measured FBG, PBG,2HPG, HbAlc, TG CHOHDLLDL,Fasting C-peptide,and Postprandial 2h C-peptide. MRI Experiment: All MRI experiments were performed on a 3T scanner (750W, GE, USA) equipped with a 16-channel brain coil.3D-ASL imaging was performed next with scan parameter of TR/TE= 4640/10.7ms, image resolution=4×4×4mm3, post labeling time=1525ms, labeling efficiency=0.8.
Data analysis:All acquired 3D-ASL data were analyzed using a vendor-provided post-processing software in GE ADW 4.6 workstation. The parametric CBF maps were obtained accordingly.We used non-linear registration method to register individual CBF image to the standard space of montreal neurological insitute (MNI) in SPM. Then, we used the scale sub-contour model/principal component analysis (SSM/PCA) to extract the cerebral perfusion characteristic network[2].SRPi=Pi-GMRiI-GMP=Σk√(λk)SSFkiGISkTo created the subject residual profile (SRPi) of the ith individual single principal component analysis was used to calculate the mean difference between the image matrix Pi of individual i and the global average GMRi of the matrix to obtain the group average contour GMP. The SRPi of individual i was also equal to the principal component image set (GISk) multiplied by the weighted sum of the individual scalar factor SSFki and the eigenvalue λK. Through PCA,the eigenvectors and eigenvalues of input data covariance matrix were calculated and the main component image set (GroupInvariant Subprofile (GIS) was obtained.
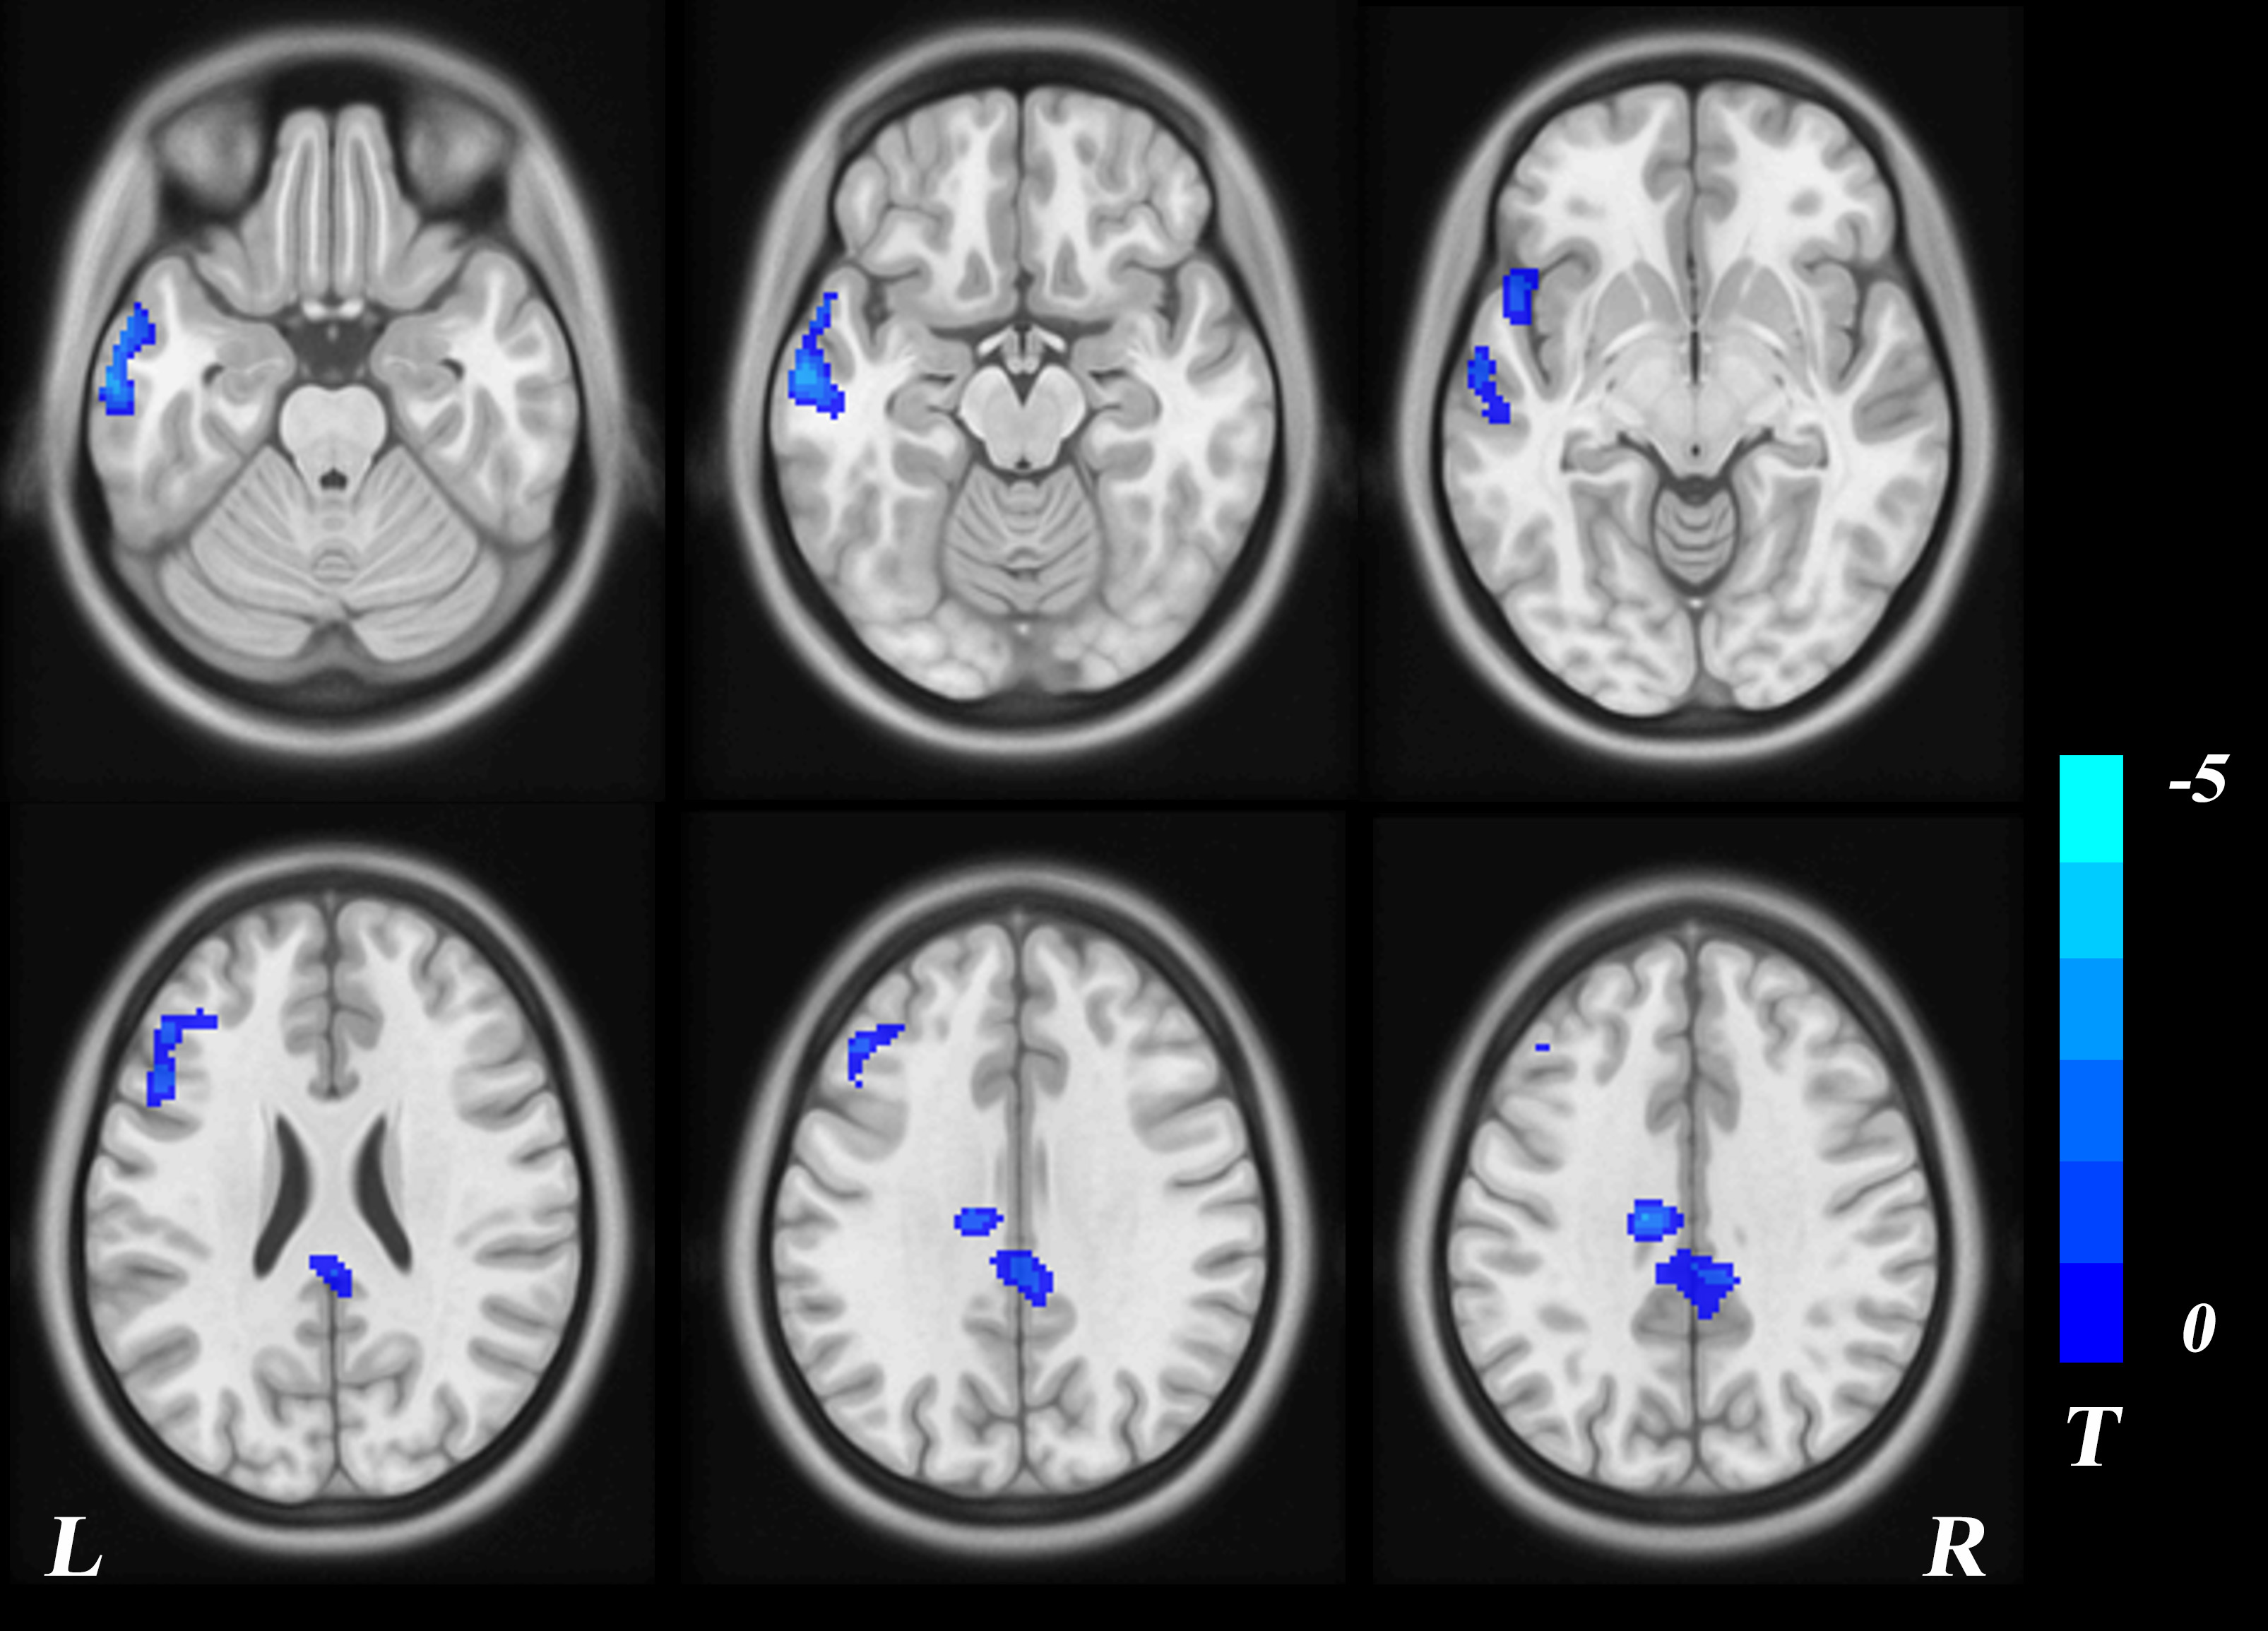
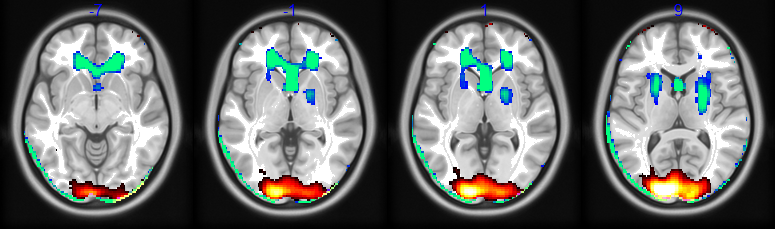
Results:Compared with the healthy controls, the perfusion of bilateral paracentral lobules, left supplementary motor area, bilateral middle cingulate gyrus, left inferior frontal gyrus, left middle temporal gyrus, and left inferior temporal gyrus were significantly lower in diabetic patients (P<0.05, GRF corrected;Figure 1). PCA showed that GIS1 was a perfusion characteristic network composed of bilateral supraoccipital gyrus, cuneate lobe, and superior parietal gyrus. GIS2 was a perfusion characteristic network composed of bilateral anterior cingulate gyrus, caudate nucleus head, putamen (Figure 2). Correlation analysis showed that PCA eigenvalues of each diabetic were significantly positively correlated with fasting blood glucose (P=0.001, R=0.32), and the extracted CBF values of the diabetic group, using GIS2 perfusion characteristic network as a template, were negatively correlated with fasting blood glucose(P=0.03, R=0.12).
Summary of Main Findings
In this study, we found the CBF defects in cortical areas of T2DM patients, being consistent with previous studies. The perfusion characteristics of GIS1 showed different perfusion patterns in bilateral superior occipital gyrus, cuneate lobe and superior parietal gyrus, and the characteristic values were positively correlated with fasting blood glucose. These areas are mainly located around the calcarine fissure, including the primary and secondary visual cortex, striate cortex, extrastriate visual cortex and so on. The characteristic areas of GIS2 perfusion are bilateral anterior cingulate gyrus, head of caudate nucleus, anterior limb of internal capsule, putamen and so on, which may be due to deeper perforating artery and higher sensitivity to vascular pathology (such as local ischemia or insufficient perfusion)[3]. In conclusion, this study confirmed our hypothesis that cerebral circulatory perfusion should not be independent, and the changes in perfusion patterns based on regional features could well reflect the remodeling of cerebral blood flow perfusion.Acknowledgements
AcknowledgementsWe confirm that the manuscript has been read and approved by all named authors and there areno known conflicts of interest associated with this publication.All protocols of this study were approved by the ethics committee of the Yangzhou University, Yangzhou, ChinaReferences
[1] Bangen KJ, Werhane ML, Weigand AJ, et al. Reduced Regional Cerebral Blood Flow Relates to Poorer Cognition in Older Adults With Type 2 Diabetes. Front Aging Neurosci. 2018.10:270. 10.3389/fnagi.2018.00270
[2] Yuan LX, Wang JB, Zhao N, et al. Intra- and Inter-scanner Reliability of Scaled Subprofile Model of Principal Component Analysis on ALFF in Resting-State fMRI Under Eyes Open and Closed Conditions. Front Neurosci. 2018. 12: 311.
[3] Jansen JF, van Bussel FC, van de Haar HJ, et al. Cerebral blood flow, blood supply, and cognition in Type 2 Diabetes Mellitus. Sci Rep. 2016. 6(1): 10. DOI:10.1038/s41598-016-0003-6
Figures