1888
Study on the white matter integrity in T2DM using automated fiber quantification tractography1Department of Magnetic Resonance, Lanzhou University Second Hospital, Lan Zhou, China, 2Second School of Clinical Medicine, Lanzhou University, Lan Zhou, China
Synopsis
The objective of this study was to explore the effect of glucose fluctuation on T2DM patients using a new method named automated fiber quantification (AFQ). To explore the value of different DTI parameters in the classification of T2DM patients and normal patients using SVM model.
Synopsis
Type 2 diabetes mellitus (T2DM) is a serious public health problem, increase the risk of neurological and psychiatric disorders, such as dementia and depression. The objective of this study was to explore the effect of glucose fluctuation on T2DM patients using a new method named automated fiber quantification (AFQ). In addition, we also used SVM model to explore the value of different DTI parameters in the classification of T2DM patients and normal patients. AFQ demonstrated early significant differences between T2DM and HC groups. And these parameters may be associated with blood glucose level.Introduction
Introduction: The World Health Organization 2016 Global Report on diabetes has reported that the prevalence of diabetes has nearly doubled since 1980, rising from 4.7 to 8.5% in the adult population[1].Differential brain structural abnormalities between type 2 diabetes mellitus (T2DM) and Healthy control (HC) may reflect pathological mechanisms underlying the effect of blood glucose fluctuation to brain[2]. However, it is known less about the changes of white matter microstructure in T2DM.Methods
In this study, the microstructural integrity of white matter (WM) was evaluated using automated fiber quantification tractography (AFQ)[3], we utilized diffusion tensor images (DTI) from 50 persons, including 33 T2DM and 17 healthy controls (HC) to create fractional anisotropy (FA) and mean diffusivity (MD) among the groups tract profiles along 20 major WM tracts. Then, we compared between-group differences in FA values at each node along the fiber tracts. DTI data of all the subjects were obtained with a 3.0T using a Siemens Vrio 3.0T scanner equipped with a 12-channel head coil. Scripts used for all analyses are available on a web-page named AFQ-Broswer: https://yeatmanlab.github.io/AFQ-Browser. To differentiate the T2DM and the HC, we enrolled the diffusion measures of the tract profiles such as FA、MD into support vector machine (SVM), a type of machine learning algorithm. The use of these parameters was evaluated by receiver operating characteristic (ROC) curve analysis.Results
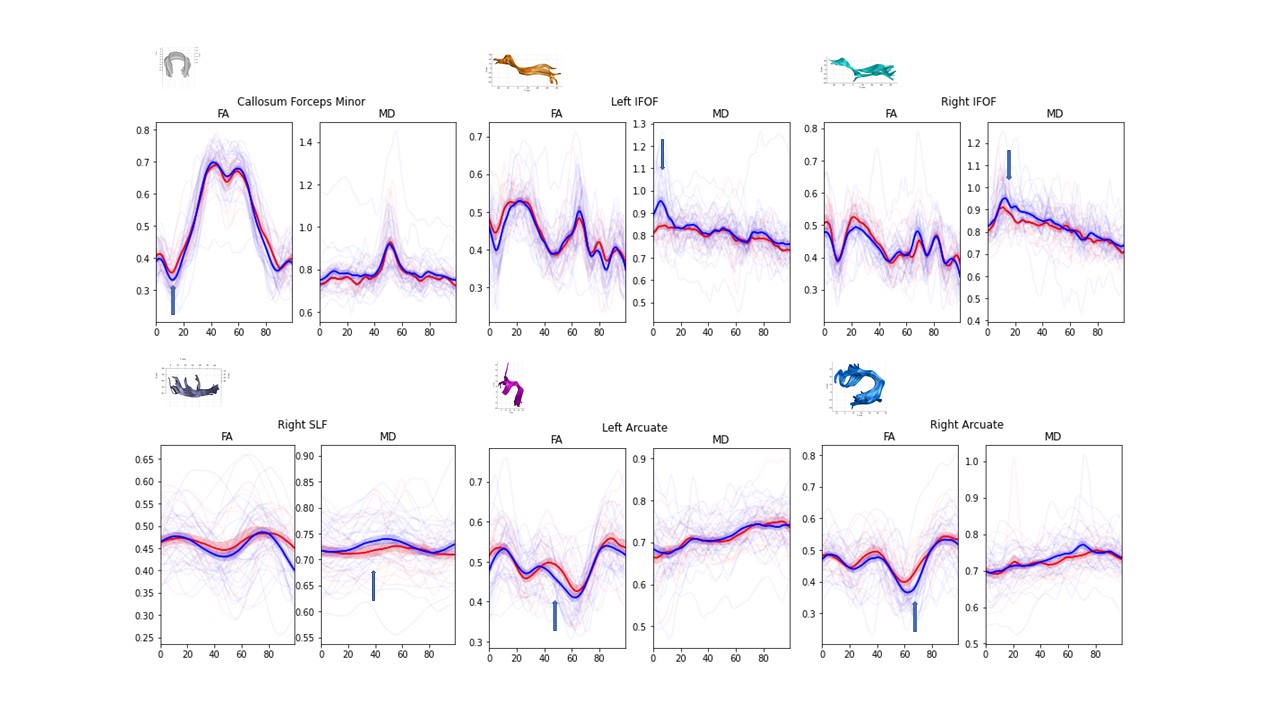
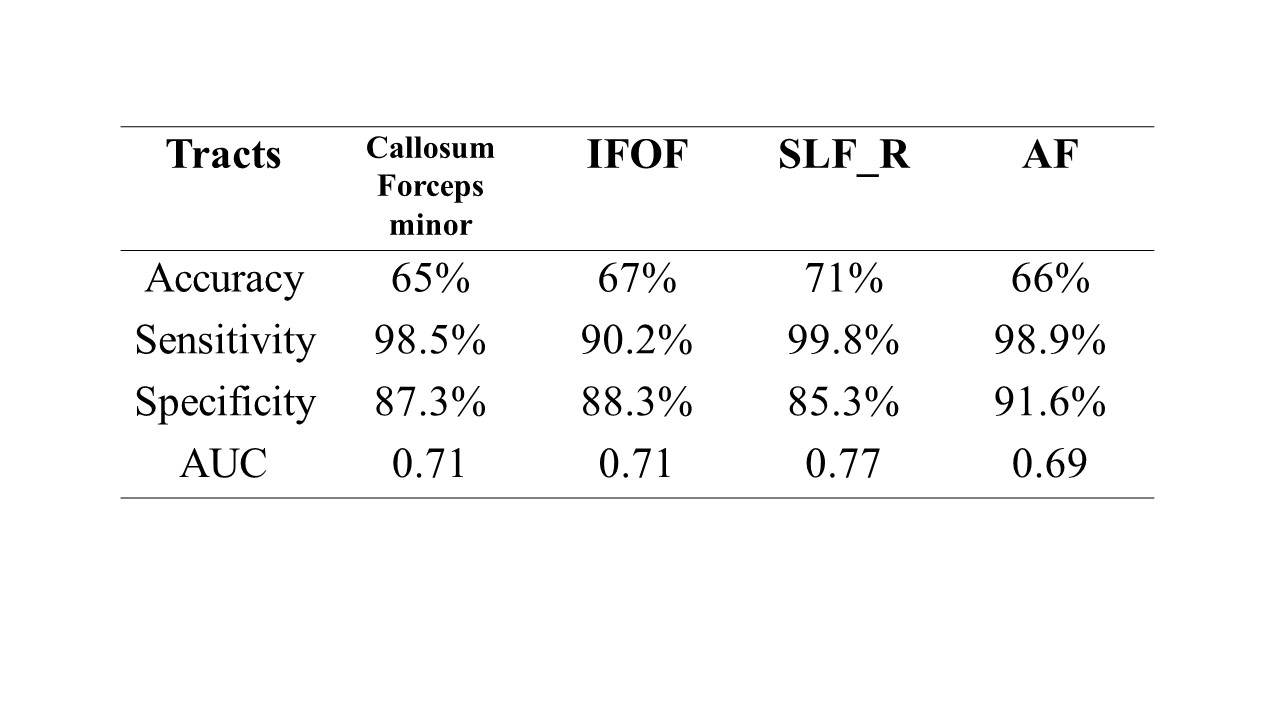
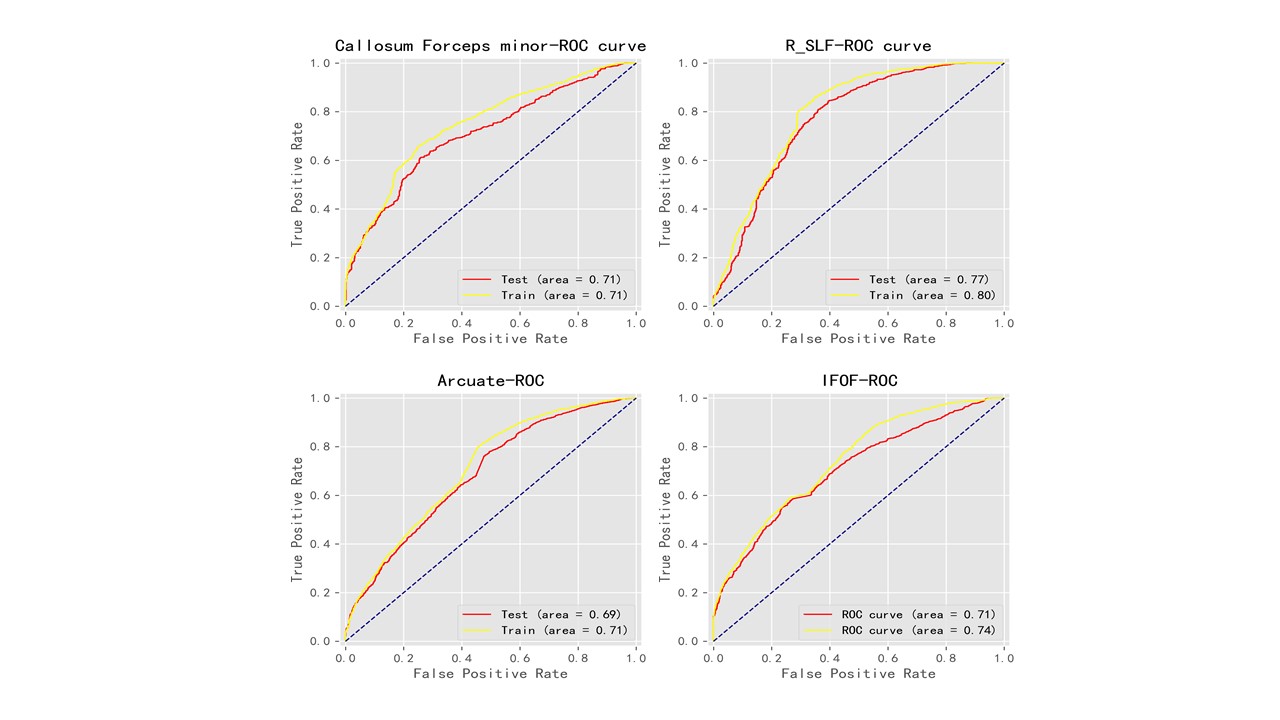
The T2DM showed lower FA in the Forceps minor、inferior fronto-occipital fasciculus (IFOF)、arcuate fasciculus(AF) and right superior longitudinal fasciculus (SLF_R) compared to the HC, The fiber bundles showing differences are shown in Figure 1, a permutation‐based multiple‐comparison correction was applied to determine a statistically significant threshold for P‐values (P < 0.05), T‐tests were conducted point‐wise along the tracts for 100 voxels. The locations of these six fiber tracts and the specific segments showing significant between-group differences in FA are also indicated(Thick arrow). Using the SVM model, we found the FA tract profile of the SLF_R can be used to differentiate the T2DM and the HC at an accuracy up to the best 71%. We found that the AUC could achieve 71% and 0.77 in T2DM and HC classification using the features of SLF_R, other fiber tracts’ features accuracy and the AUC are lower than SLF_R, the details presented in Table 1 and Figure 2, python is used for data processing and visualization.Conclusions
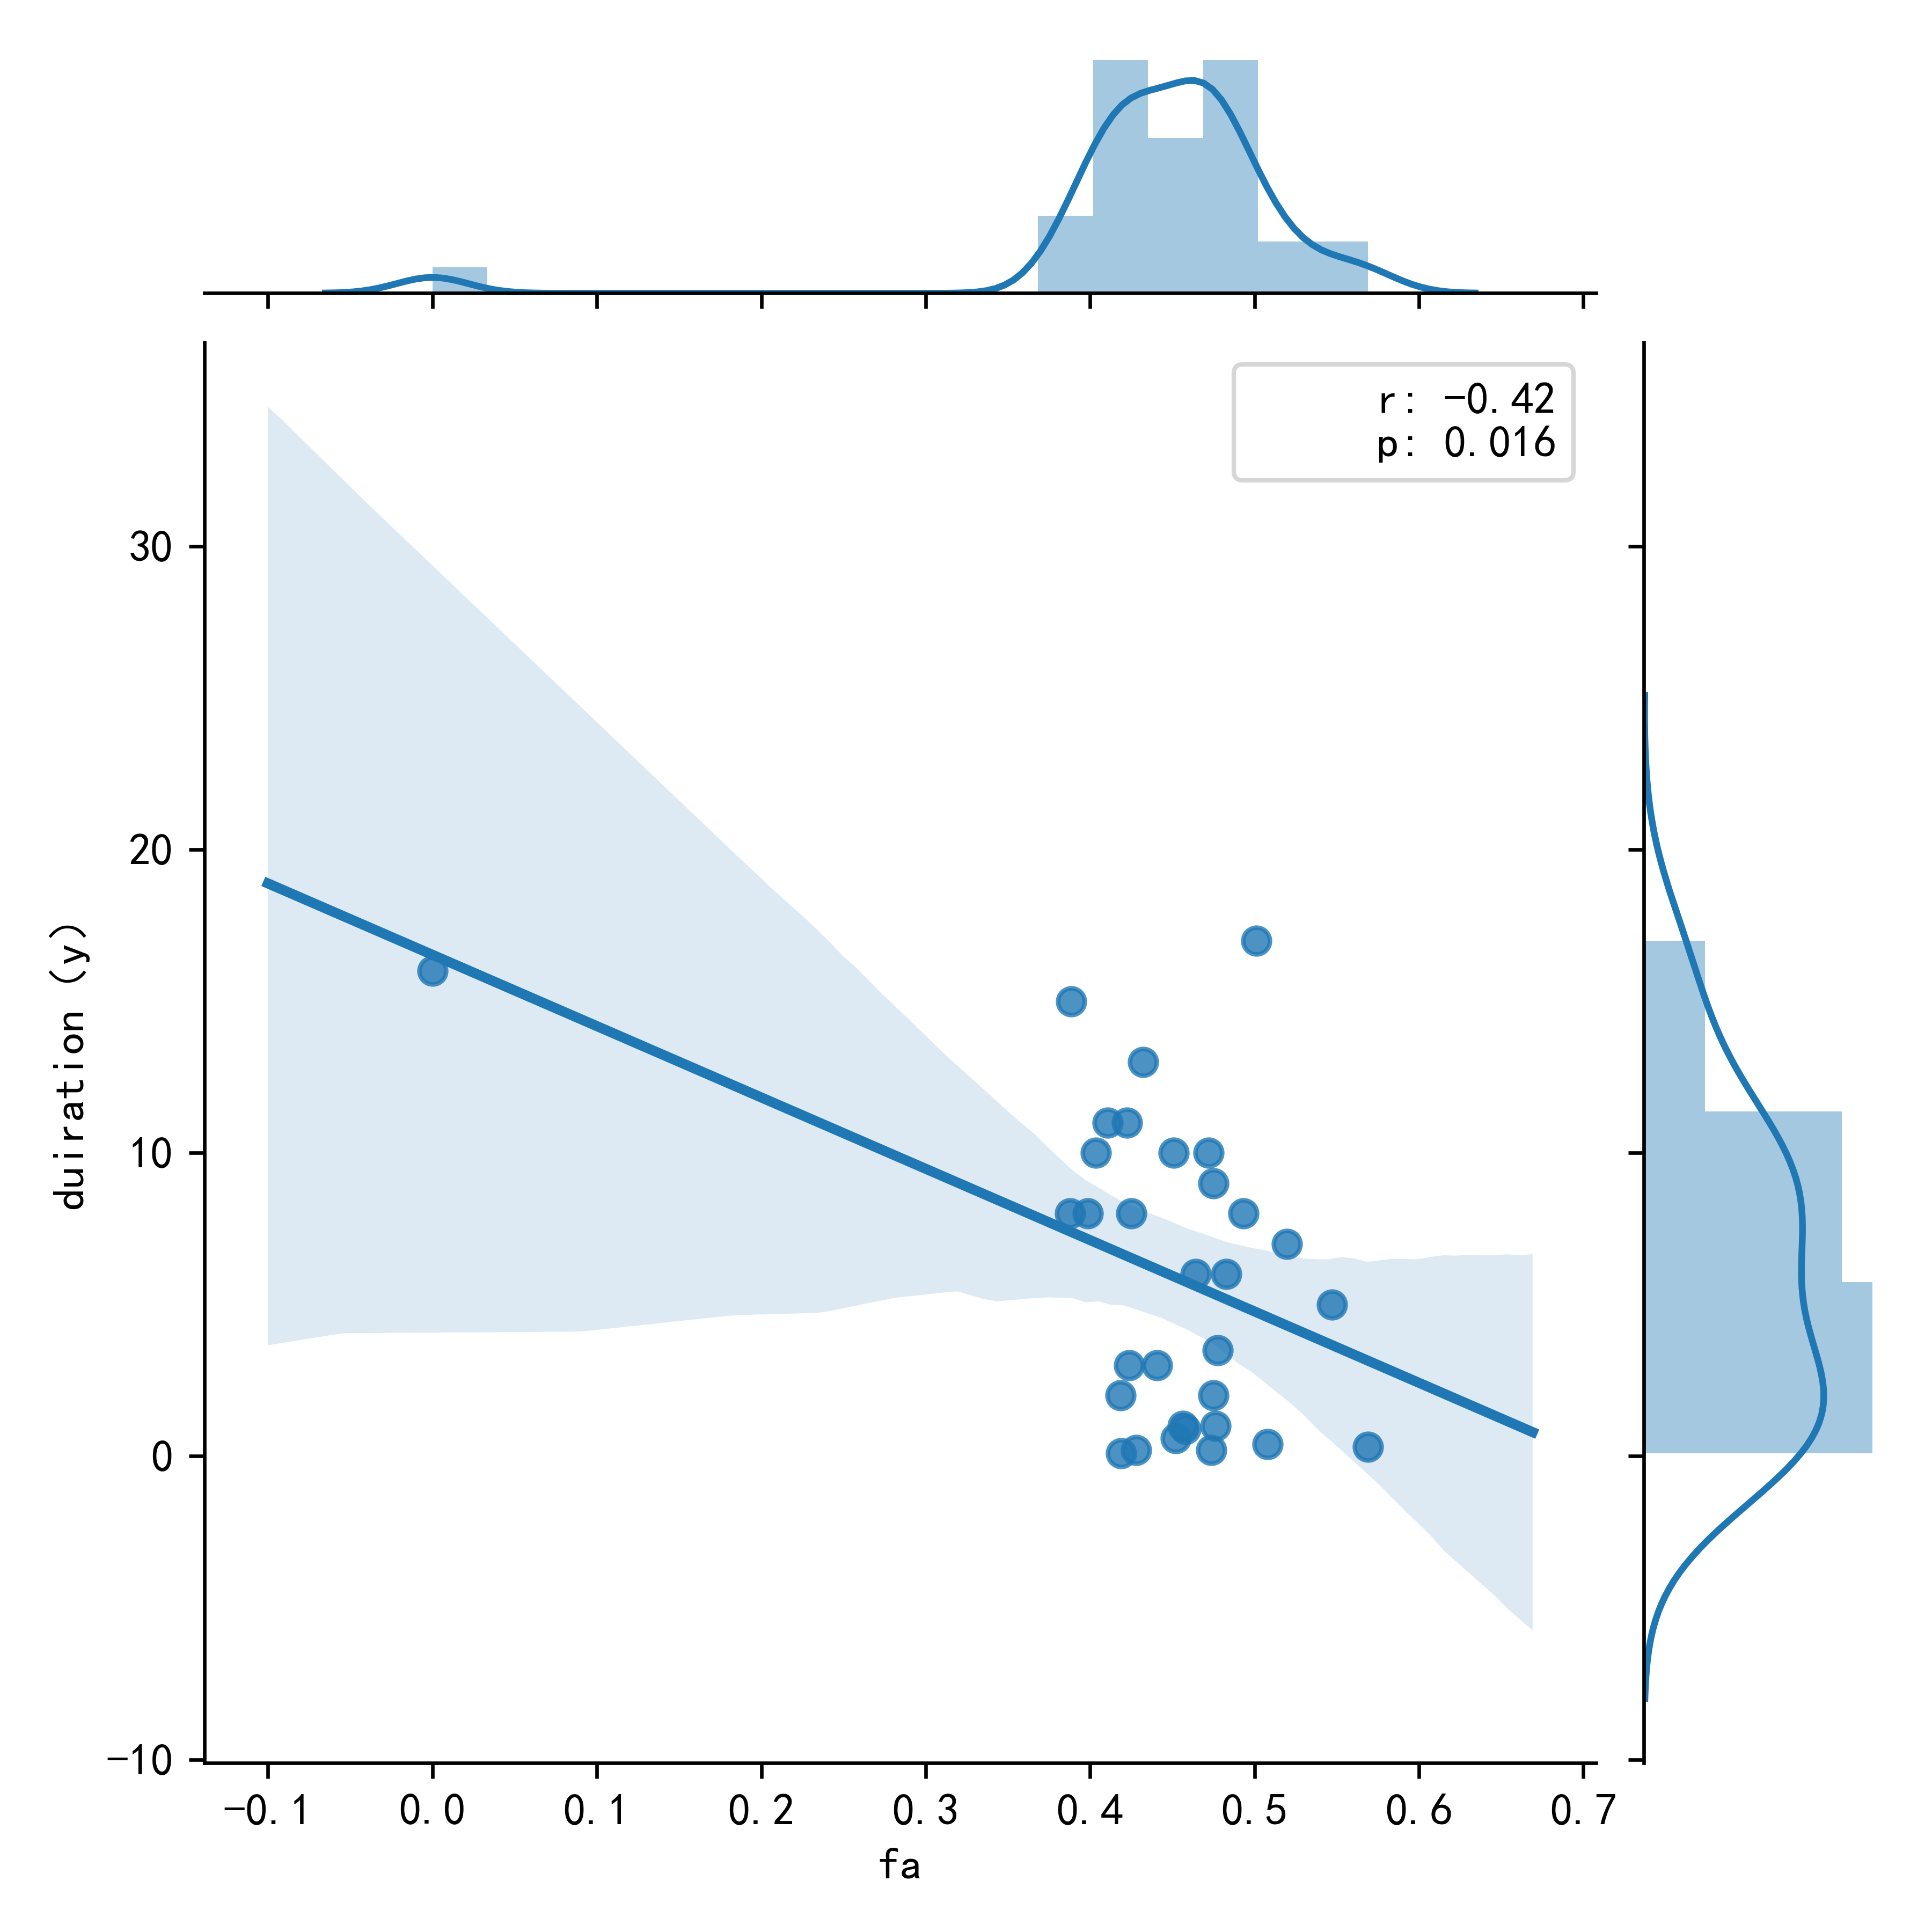
This study indicates that WM impairment is present in T2DM patients and may be related to duration of disease. More importantly, this study also shows that such impairment may be distinguished using the SVM mode of DTI. These findings suggested that the T2DM and the HC may be characterized by different abnormalities in specific segments of brain WM tracts, especially in R_SLF.Acknowledgements
No acknowledgement found.References
[1] Quattrocchi E, Goldberg T, Marzella N. Management of type 2 diabetes: consensus of diabetes organizations. Drugs Context. 2020;9:212607.
[2] Moulton CD, Costafreda SG, Horton P, Ismail K, Fu CH. Meta-analyses of structural regional cerebral effects in type 1 and type 2 diabetes. Brain Imaging Behav. 2015;9(4):651-62.
[3] Yeatman JD, Dougherty RF, Myall NJ, Wandell BA, Feldman HM. Tract profiles of white matter properties: automating fiber-tract quantification. PLoS One. 2012;7(11):e49790.
Figures