1886
MRI Characterisation of the Reformation of Colonic Content after Bowel Purgation1Sir Peter Mansfield Imaging Centre, University of Nottingham, Nottingham, United Kingdom, 2Nottingham Digestive Diseases Centre, University of Nottingham, Nottingham, United Kingdom, 3National Institute for Health Research (NIHR) Nottingham Biomedical Research Centre, Nottingham University Hospitals NHS Trust and the University of Nottingham, Nottingham, United Kingdom, 4Division of Child Health, Obstetrics and Gynaecology, University of Nottingham, Nottingham, United Kingdom
Synopsis
A key colonic function is the formation of faeces and the growth and proliferation of the microbiota. This process is little described as it is difficult to study in vivo. We aimed to investigate it using MRI which can non-invasively monitor changes in the colonic content. In 8 healthy volunteers we observed the initial process of faecal formation following purgation. The results suggest that MRI can provide new insights into the important physiological process of faeces formation and establishment of the microbiome in the colon.
Introduction
Around 60% of faeces is composed of bacteria and other organisms, arising from the community of microbiota that is normally resident in the colon. The gut microbiota plays a central role in physiology but little is known about the process by which the bacteria build their ecosystem to form faeces. Before optical colonoscopy, faeces is purged from the colon using agents such as polyethylene glycol (PEG). Subsequently faecal microbes recover to their pre-purgation profiles[1], but this process of recovery is difficult to study. Studies of bowel preparation for colonoscopy reported low levels of colonic content for up to 6 hours, suggesting a lack of faecal formation during this time[2,3]. Previous studies of MRI parameters and stool samples have shown that up to 4 hours after purgation neither MR measures nor bacteria in stool samples had returned to baseline values, but that 24 hours after purgation MR measures and stool bacteria had returned to baseline values[1,4]. However these subjects were nil by mouth 4 hours before and after the purgation which will have altered the short term colonic response. Dysbiosis of the gut microbiota is associated with several conditions (including irritable bowel syndrome, celiac disease, inflammatory bowel disease and obesity) and therapeutic strategies have been proposed to manage the intestinal ecosystem including the use of probiotics and prebiotics. Faecal material is not found in a normally functioning small bowel, but small bowel faecalisation has been observed and adopted as a marker of bowel obstruction on computed tomography (CT)[5,6]. Standard MR enterography protocols for bowel distension involve agents which may have a purgative effect, limiting detection of small bowel bacterial overgrowth. Recently have found signs of small bowel faecalisation in people with cystic fibrosis (CF) on MRI[7], leading us to raise fundamental questions about the time course and location of faeces formation in health and disease.Aims
To investigate the change in colonic content (faecalisation) that occurs after bowel purgation using MRI measures of free water content, colonic volume, T1 and T2.Methods
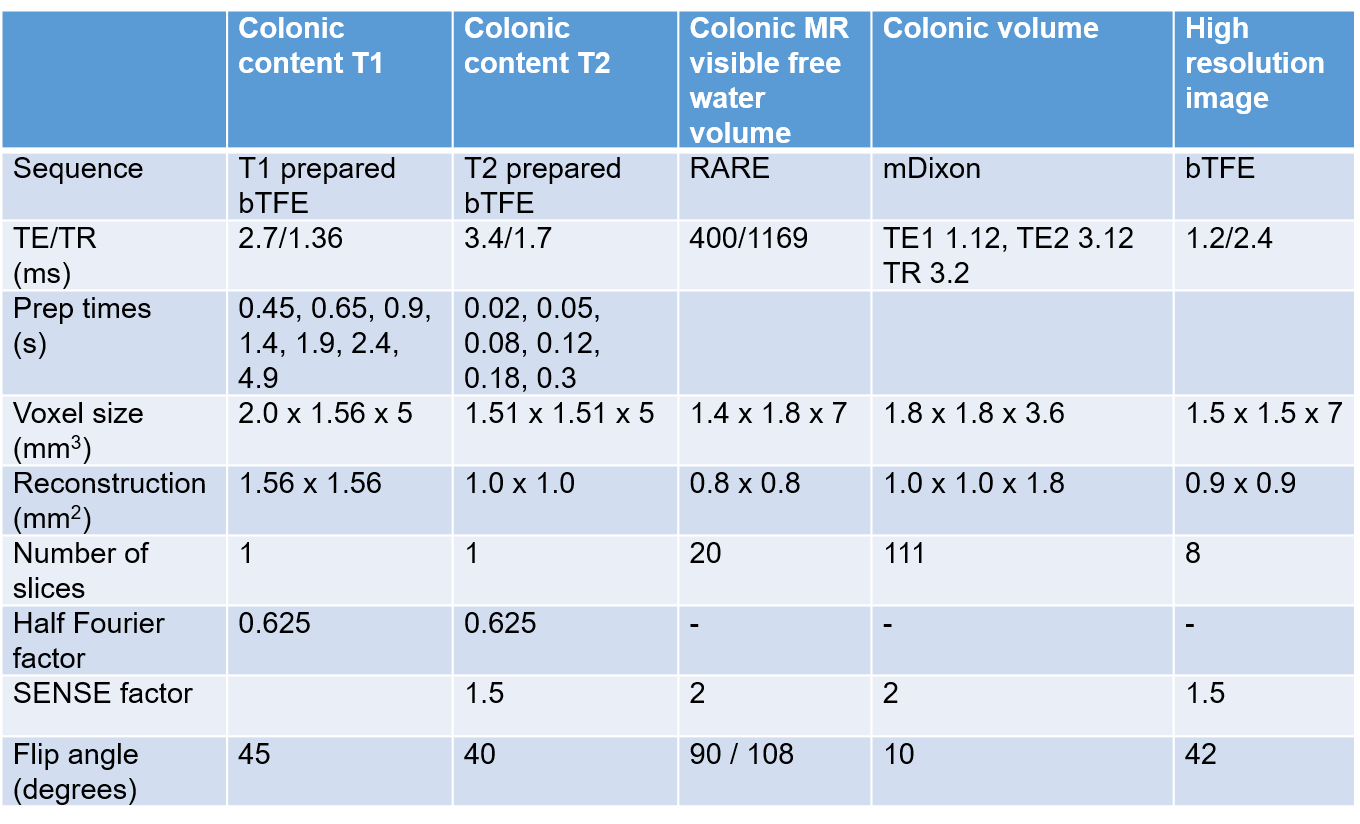
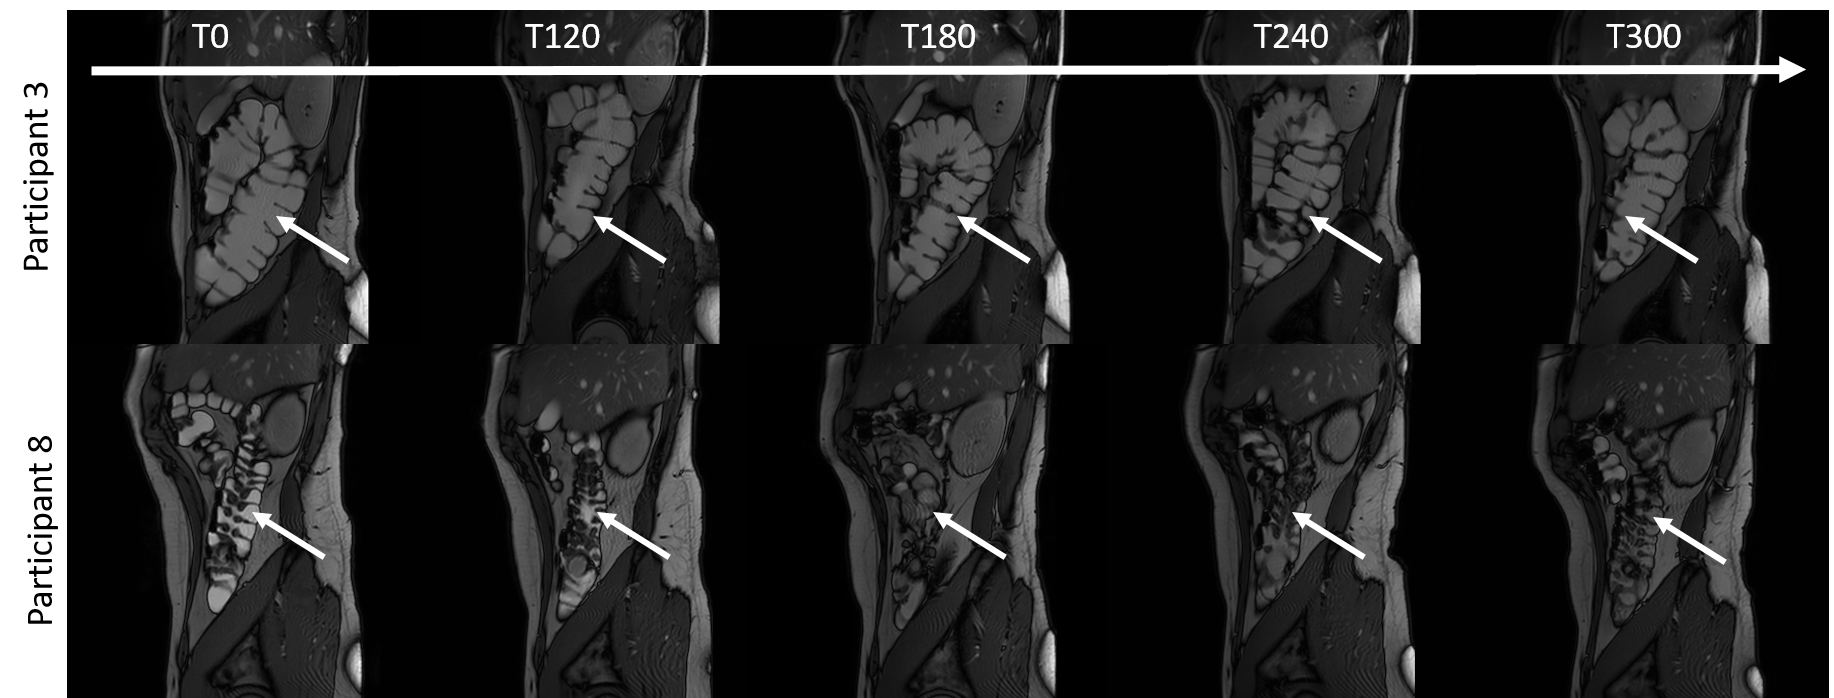
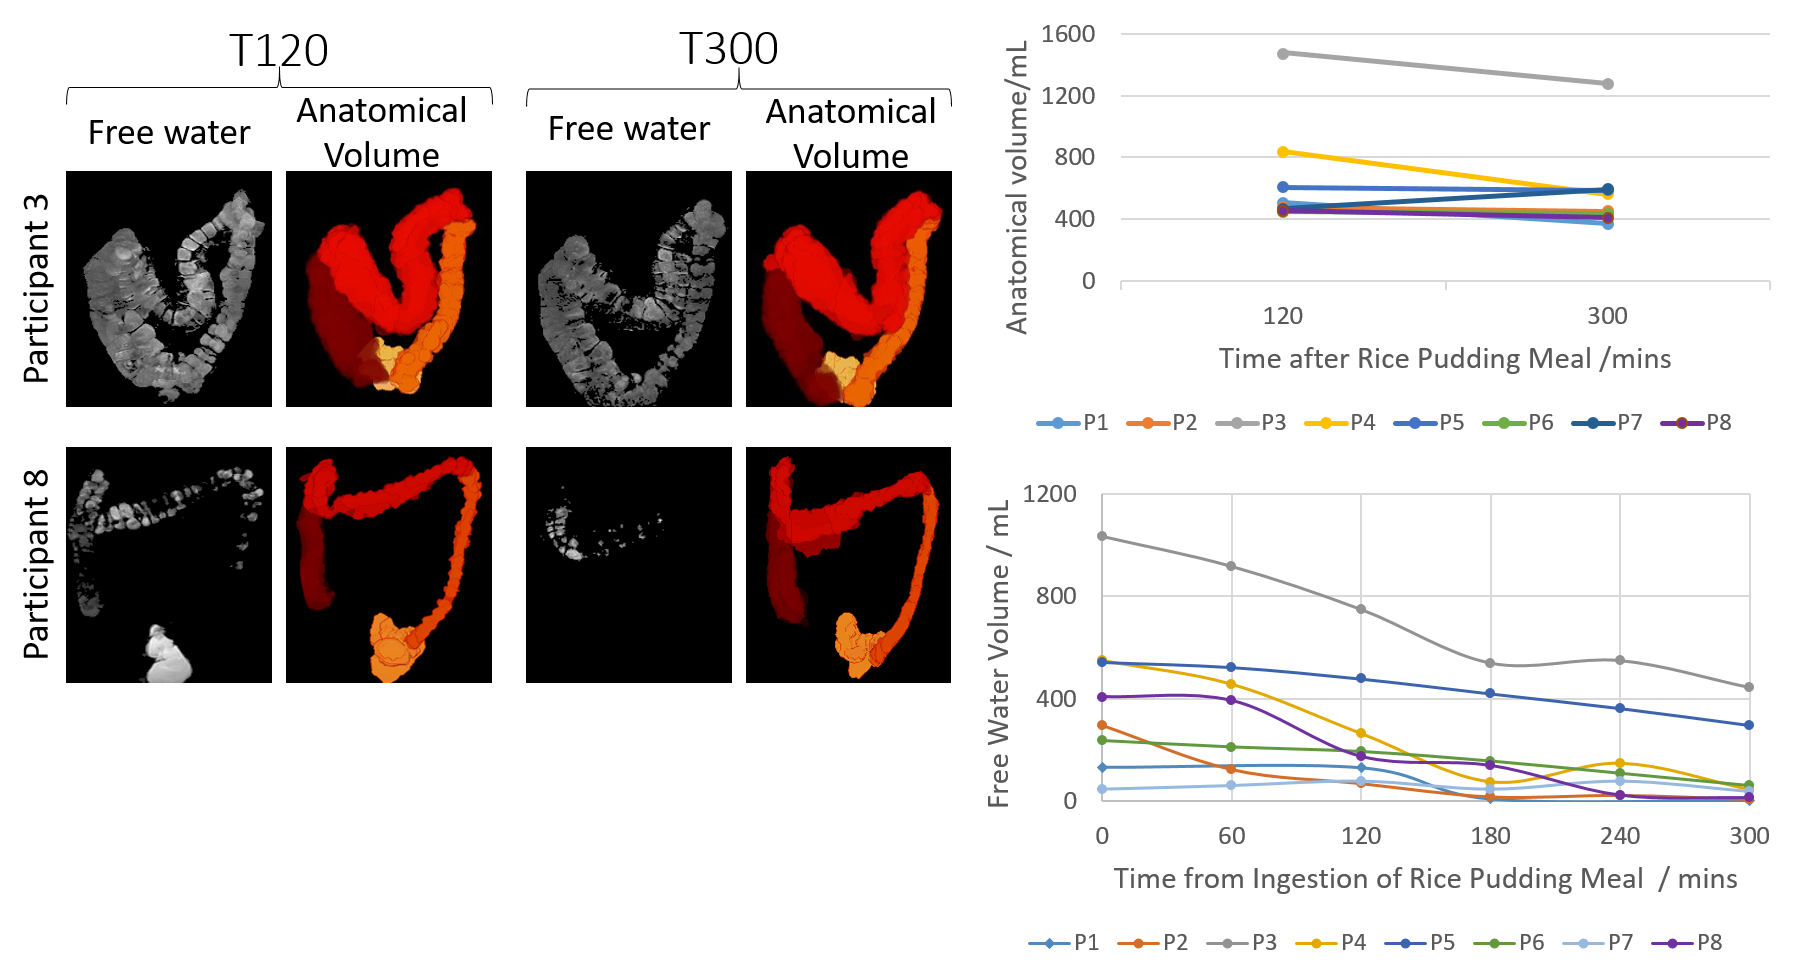
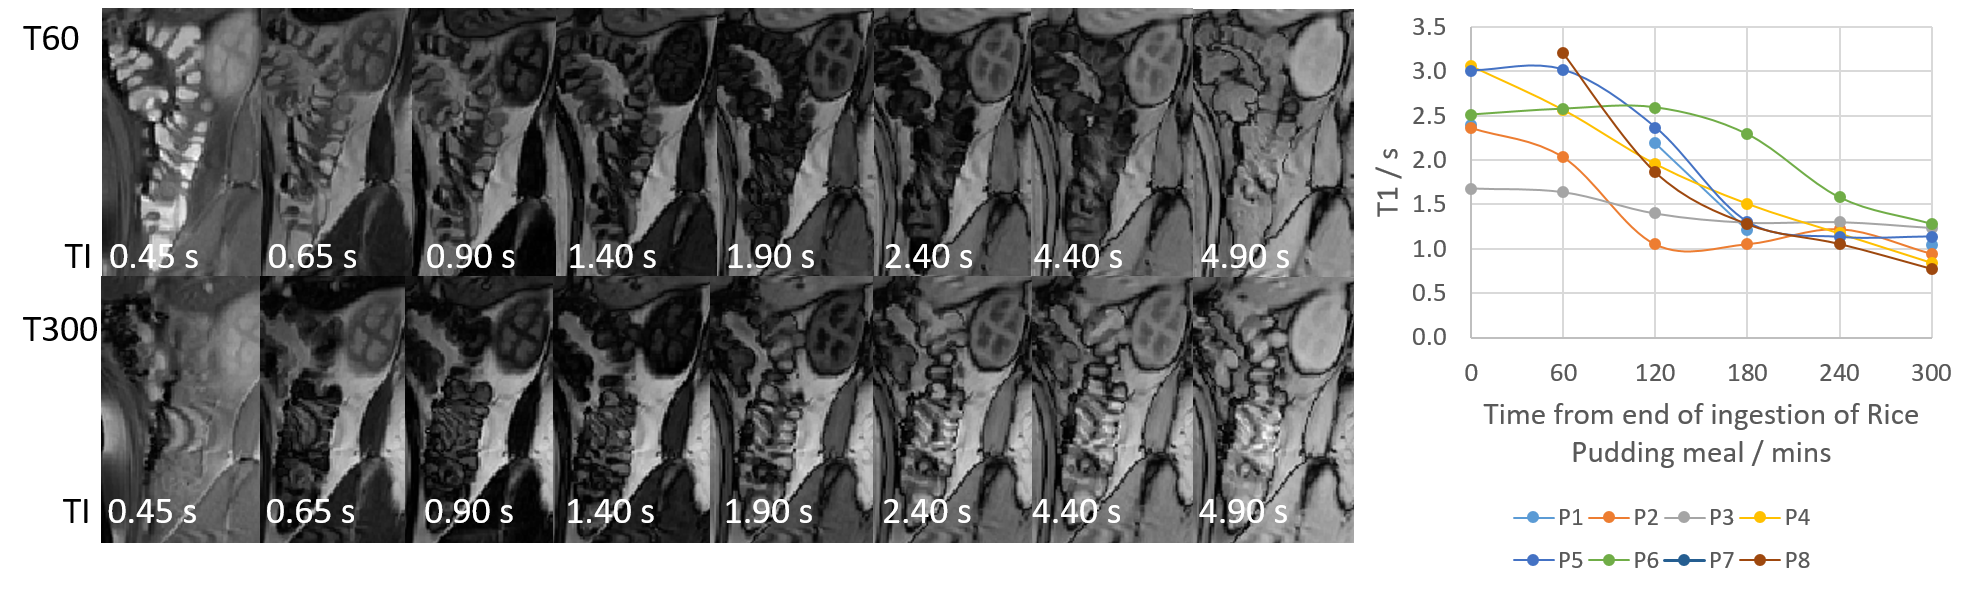
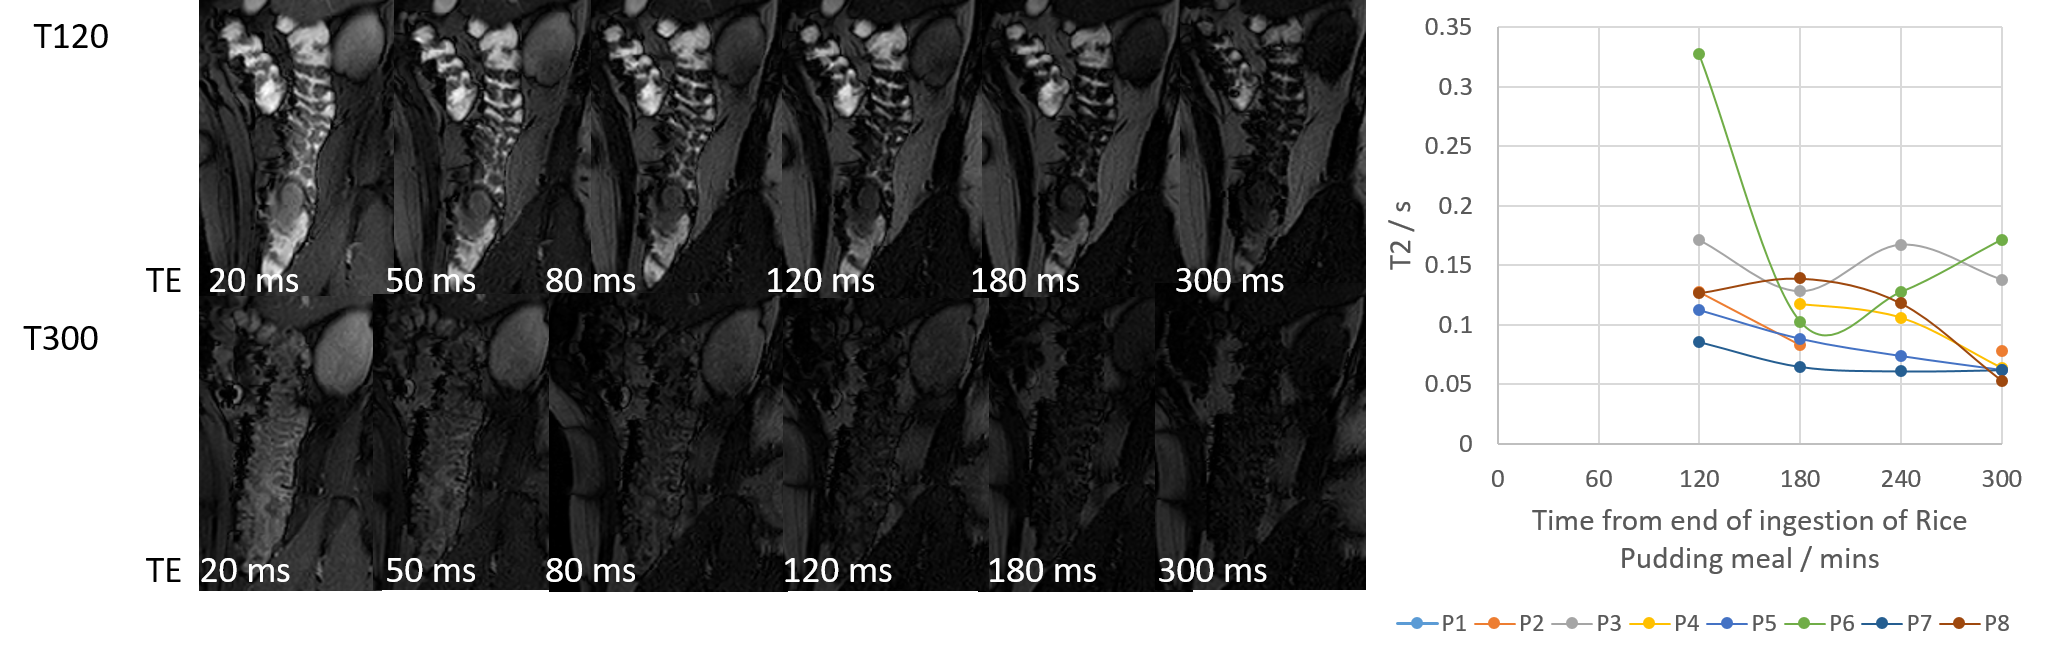
8 healthy volunteers were asked to fast from 1pm on the day prior to the study. At 6pm they consumed 1 litre of PEG and a second litre at 6am to ensure full purgation of the colon[4]. Upon arrival at 10:15am participants consumed a test meal (rice pudding, jam, cream and a drink of orange juice and water, 520 kcal). They were scanned immediately after this and then at 60, 120, 180, 240 and 300 minutes after the meal. After the 180 minutes scan a second test meal was given (macaroni cheese, cheesecake, water, 1007 kcal). Each scan session acquired a high resolution image and data to measure T1, T2, MR visible free water[8] and volume of the colon, details are given in Figure 1. Due to time constraints T2 was not assessed until T120. Colonic volume was measured by drawing around the colon on each image slice in MIPAV[9], T1 and T2 were measured at up to 3 locations along the ascending colon using previously published methods[10,11].Results
Figure 2 shows example high resolution images acquired throughout the day in two participants. The amount of colonic content remaining after purgation varied between participants and may account for the variation in baseline parameters measured. Between T120 and T300 the free water measurements decreased on average by 70% and the anatomical volume decreased on average by 8% (Figure 3). Colonic T1 and T2 dropped across the study day (Figures 4 and 5). When combining all data points from all participants a significant strong correlation was found between T1 and T2 (R = 0.60, p = 0.03, Pearson’s correlation) and a weak correlation between T1 and colonic free water content (R = 0.32 p = 0.04).Discussion
The large decreases in colonic free water, T1 and T2 suggests that the colonic contents became progressively drier during the day. The relatively smaller decrease in colonic volume suggests that bacteria was being incorporated into the fluid and/or meal residue was replacing water during the day. The T1 values (1.04 ± 0.19 s) 9.5 hours after purgation (5 hours after the first test meal) suggest that the colonic contents had not yet fully recovered to their initial state (0.69 ± 0.17 s, based on unpublished data). This is consistent with a previous study which found that at 4 hours post purgation the colonic content was still recovering but by 24 hours it had recovered completely[4]. Future work will investigate whether more specific information about the microbiome, including the formation of gas, can be obtained by comparing the different MRI measures.Conclusion
We have documented the initial process of recovery of colonic contents following purgation. These measurements will be used to plan future studies aimed at assessing the status of the colonic contents, which will provide new insights into the growth and proliferation of the microbiota throughout the gut, the physiological process of faeces formation and colonic function in general.Acknowledgements
No acknowledgement found.References
[1] Jalanka et al. Effects of bowel cleansing on the intestinal microbiota. Gut, 2015. 64(10): p. 1562-8.
[2] Kim et al. Importance of the time interval between bowel preparation and colonoscopy in determining the quality of bowel preparation for full-dose polyethylene glycol preparation. Gut Liver, 2014. 8(6): p. 625-31.
[3] Seo et al. Optimal preparation-to-colonoscopy interval in split-dose PEG bowel preparation determines satisfactory bowel preparation quality: an observational prospective study. Gastrointest Endosc, 2012. 75(3): p. 583-90.
[4] Marciani et al. Stimulation of colonic motility by oral PEG electrolyte bowel preparation assessed by MRI: comparison of split vs single dose. Neurogastroenterol Motil, 2014. 26(10): p. 1426-36.
[5] Mayo-Smith et al. The CT small bowel faeces sign: description and clinical significance. Clin Radiol, 1995. 50(11): p. 765-7.
[6] Jacobs et al. Small bowel faeces sign in patients without small bowel obstruction. Clin Radiol, 2007. 62(4): p. 353-7.
[7] Ng C, Dellschaft NS, Hoad CL, Marciani L, Ban L, Prayle AP, Barr HL, Jaudszus A, Mainz JG, Spiller RC, Gowland P, Major G, Smyth AR. Postprandial changes in gastrointestinal function and transit in cystic fibrosis assessed by Magnetic Resonance Imaging. J Cyst Fibros. 2020 Jun 16:S1569-1993(20)30733-5. doi: 10.1016/j.jcf.2020.06.004. Epub ahead of print. PMID: 32561324.
[8] Hoad, C. L. et al. Non-invasive quantification of small bowel water content by MRI: a validation study. Phys. Med. Biol. 52, 6909–6922 (2007).
[9] M J McAuli_e, F M Lalonde, D McGarry, W Gandler, K Csaky, and B L Trus. Medical Image Processing, Analysis and Visualization in Clinical Research. In Proceedings 14th IEEE Symposium on Computer-Based Medical Systems. CBMS 2001, pages 381{386, MIPAV. IEEE Comput. Soc. ISBN 0-7695-1004-3. doi: 10.1109/CBMS.2001.941749.
[10] Hoad C, Garsed K, Marciani L, et al. Measuring T1 of chyme in the ascending colon in health and diarrhoea predominant Irritable Bowel Syndrome (Abstract 1275). Proc Intl Soc Mag Reson Med. 20. 2012 [11] Hoad CL, Cox EF, Gowland PA. Quantification of T(2) in the abdomen at 3.0 T using a T(2)-prepared balanced turbo field echo sequence. Magn Reson Med 2010; 63: 356–64.
Figures