1882
Non-Alcoholic Fatty Liver Disease: Association Between the Biomechanics and Inflammation Severity in Early-Stage Diffuse Liver Disease
Christian Simonsson1,2, Markus Karlsson1, Patrik Nasr3, Ralph Sinkus4, Simone Ignatova5, Nils Dahlström1, Mattias Ekstedt2,3, Stergios Kechagias3, and Peter Lundberg1,2
1Department of Radiation Physics, Radiology, Linköping University, Linköping, Sweden, 2Center for Medical Image Science and Visualization (CMIV), Linköping University, Linköping, Sweden, 3Department of Medical and Health Sciences, Linköping University, Linköping, Sweden, 4Imaging Sciences & Biomedical Engineering, Kings College London,, London, United Kingdom, 5Linköping University, Linköping, Sweden
1Department of Radiation Physics, Radiology, Linköping University, Linköping, Sweden, 2Center for Medical Image Science and Visualization (CMIV), Linköping University, Linköping, Sweden, 3Department of Medical and Health Sciences, Linköping University, Linköping, Sweden, 4Imaging Sciences & Biomedical Engineering, Kings College London,, London, United Kingdom, 5Linköping University, Linköping, Sweden
Synopsis
With the high prevalence of non-alcoholic fatty liver disease (NAFLD), it is important to have precise and non-invasive clinical methods to detect early stages of non-alcoholic steatohepatitis (NASH) and fibrosis progression. It has recently been shown that 3D Magnetic resonance elastography (3D-MRE) could be used to measure inflammation in the liver. To this cause, we investigated the association between liver 3D-MRE biomechanical properties and histopathological features in a liver study cohort of 25 patients including individuals with NASH. We here show that 3D-MRE biomechanical biomarkers show a correlation with higher degrees of hepatic inflammation in this cohort.
Introduction
Due to the increased global prevalence of non-alcoholic fatty liver disease (NAFLD), there is a significant need for precise and non-invasive clinical methods to detect early stages of non-alcoholic steatohepatitis (NASH) and fibrosis progression. Magnetic resonance elastography (MRE) has been shown to be a valuable biomarker for non-invasive measurement of fibrosis. More recently, it has been shown that 3D MRE can also be used to measure inflammation in the liver [1]. Here, we investigated the possibility of correlating certain 3D-MRE biomechanical properties and histopathological features in a liver study cohort, with patients expressing various degrees of hepatic inflammation. A main aim was to elucidate the potential association between GI, α and cs and inflammation severity in early disease stages.Methods
We have included 25 patients (Fig 1, table 1) that were scheduled for a liver biopsy at the University hospital in Linköping and otherwise eligible for this study. The final diagnoses were NAFLD (n=16), BAFLD (n=2), normal (n=2), autoimmune hepatitis n=2) and other (n=3, e.g. primary sclerosing cholangitis PSC). Shortly after liver biopsy, all patients underwent an extensive magnetic resonance imaging (MRI) investigation, including 3D-MRE, MRS, DCE-MRI. The local ethics committee approved this study, and written informed consent was obtained from all patients.MRI was performed using a Philips Achieva DStream 3.0 T scanner (Philips Healthcare, Best, The Netherlands. Briefly, an active electrodynamic transducer (Philips Medical, Hamburg, Germany) was used to transmit mechanical waves at 54 Hz, and separately at 36 Hz on the right side of the patient at the level of the liver, with the patient in the supine position (Fig 2a). Images were then acquired in four separate breath-holds, and nine slices were acquired with a slice thickness of 4 mm each. Regions of interests (ROIs) where drawn on the reconstructed image maps (Fig 2b-f).
The same reconstruction methods as in Sinkus et al [1] were used. In addition to calculating the complex sheer modulus (Gabs, tissue elasticity), and shear loss modulus (GI, tissue viscosity), we also calculated the complex-valued k-vector of wave propagation (Eq.1) to directly yield the shear wave absorption (α, [1/m]) and shear wave speed (cs, [m/s]) using as the circular frequency of vibration in [rad/s]. Both GI and α has been shown to correlate with higher degrees of inflammation [1].
k= β-iα ,cs=ω/ β (Eq.1)
The reconstructed biomechanical properties were averaged within the ROIs of the central two slices, see Fig 2b-f.
Results
The reconstructed biomechanical properties: GI, α and cs were plotted against different histological measurements of steatosis, inflammation, and fibrosis (Fig 3). In [1], they show that GI increases with rising degree of inflammation which we also see, shown in Fig 3a. Here, the GI values plotted against fibrosis, NAFLD activity score (NAS, which combines, lobular inflammation, ballooning and steatosis), lobular inflammation, and portal inflammation score. Shown in Fig 3b is the shear wave absorption, α, plotted against the histology scores. For all scores, there was a negative correlation with α. In contrast (Fig 3c), for the shear wave speed (cs) we observed a positive correlation. A substudy and additional analysis for individuals with only a NAFLD diagnosis (Fig 4) was also performed with a subset of n=19 NAFLD patients. However, the NAS score is heavily skewed towards patients with NAFLD giving them a higher score. For that reason, we calculated a modified NASm in which we used the sum of ballooning and lobular inflammation score, as well as the portal inflammation score. This modified NASm was denoted ‘inflammation sum score'. The score was then used for the subset of NAFLD patients, shown in Fig 4. We observe the same upward correlation for GI (Fig 4b) and downward correlation for α (Fig 4a) using NASm.Discussion
We have shown that for NAFLD we can measure and confirm the correlations previously predicted [1] between biomechanical properties (GI, α and cs) obtained using 3D-MRE, and histopathological measures of fibrosis and hepatic inflammation. As our intention was to investigate early signs of inflammation in association with NAFLD, the histopathological scores were typically relatively low, although a few of our patients had high inflammation scores. The positive correlation for cs has not been previously reported, although the same positive correlation with fibrosis was seen [1]. The limitations of our study include a relatively small sample size, considering the anticipated early stage of inflammation associated with NAFLD. Also, it might have been beneficial to compare with additional inflammation grading scores with a larger dynamic range, such as the HAI-inflammation score, or possibly some other biomarker, such as SOD-concentrations, to further elucidate the relation between GI, α and cs and inflammation.Acknowledgements
No acknowledgement found.References
[1] Sinkus R, Lambert S, Abd-Elmoniem K. Z, Moren C,Heller T, Geunthner C, Ghanem A.M, Holm S, Gharib A.M, Rheological determinants of simultaneous staging of hepatic fibrosis and inflammation in patients with chronic liver disease. NMR in Biomedicine, 2018.Figures
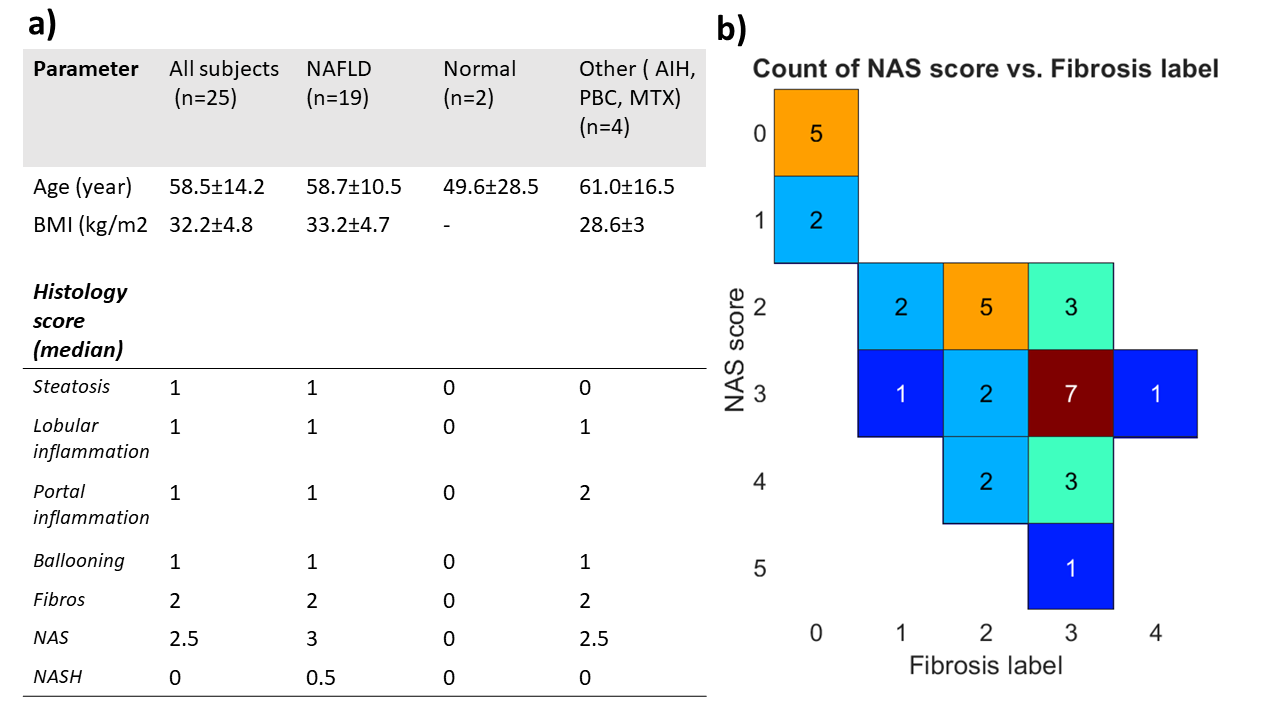
Fig1. a) Table showing patient data. b) Showing patient population in the NAS-score/Fibrosis label plane.
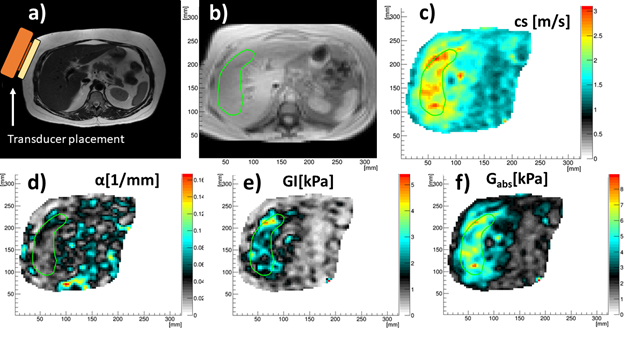
Fig 2. a) Anatomy and MRE transducer placement. b) ROI in magnitude image. c) shear wave speed, cs. d) shear wave absorption, α. e) tissue viscosity, GI. f) tissue elasticity Gabs.
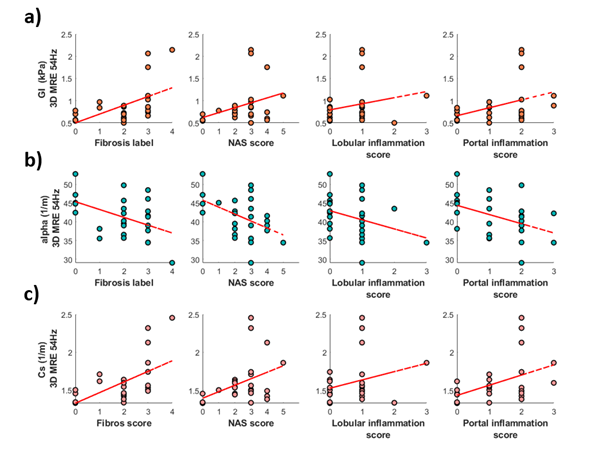
Fig 3. a) The tissue viscosity, GI , plotted against fibrosis labels and inflammation score. b) the shear wave absorption, α, plotted against fibrosis labels and inflammation score. c) shear wave speed, cs, plotted against fibrosis labels and inflammation score.
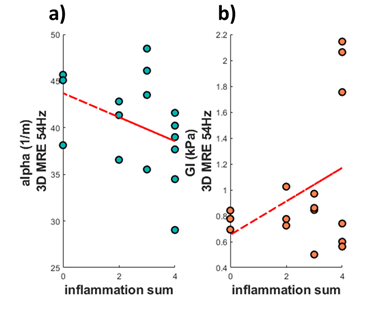
Fig 4. a) the shear wave absorption, α, plotted against the modfied NAS score denoted inflammation sum. b) the tissue viscosity, GI , plotted against the modfied NAS score denoted inflammation sum.