1881
A Preliminary Assessment of Hepatic Fibrosis with Ultrashort Echo Time (UTE): A comparative study with Magnetic Resonance Elastography (MRE)
Jie Yuan1, Fan Mo2, Yongming Dai2, Suhao Qiu3, Yuan Feng3, Songhua Zhan1, Yanwen Huang1, and Hui Wang1
1Department of Radiology, Shuguang Hospital Affiliated to Shanghai University of Traditional Chinese Medicine, 201203, Shanghai, China, 2MR Collaboration, United Imaging Healthcare, Shanghai, China, 3Institute for Medical Imaging Technology, School of Biomedical Engineering, Shanghai Jiao Tong University, 200240, Shanghai, China
1Department of Radiology, Shuguang Hospital Affiliated to Shanghai University of Traditional Chinese Medicine, 201203, Shanghai, China, 2MR Collaboration, United Imaging Healthcare, Shanghai, China, 3Institute for Medical Imaging Technology, School of Biomedical Engineering, Shanghai Jiao Tong University, 200240, Shanghai, China
Synopsis
We investigated the potential of Ultrashort Echo Time (UTE) to accurately assess hepatic fibrosis in patients with chronic liver disease. Our study demonstrated that UTE has the potential to assess the hepatic fibrosis.
Introduction
Accurate detection of hepatic fibrosis is crucial for assessing prognosis and candidacy for treatment in patients with chronic liver disease. Although Magnetic Resonance Elastography (MRE) is a very important non-invasive technique for quantitatively assessing the stiffness of liver, it still has some limitations. MRE is costly and requires both dedicated hardware and software. On the other hand, UTE can offer short T2* relaxometry information due to its ultrashort echo time. Therefore, UTE sequence can fundamentally solve the restriction that the signal attenuation of the short transverse relaxation time tissue cannot be displayed due to the long echo time1. Thus, short T2* component of liver fibrosis which cannot be detected in conventional MR sequence can be reflected by UTE. This study aimed to explore the accuracy of UTE in assessing the degree of hepatic fibrosis through comparing with MRE.Methods
Thirty-three subjects (15 males and 18 females, mean age: 53.85 years ±14.06 with range 27-79 years) were recruited, including sixteen hepatitis B patients, nine non-alcoholic fatty liver patients, and eight with other liver diseases. Patients were requested to fast for at least 4 hours prior to the examination. This prospective study was approved by the local review board. All MRI examinations were performed with a 3.0T scanner (uMR 780, United Imaging Healthcare, Shanghai, China) with a 32-channel body coil. External vibration (60 Hz) to the liver was induced from a electromagnetic actuator for MRE and positioned on the right chest wall of the patient in a supine position2. MRE was performed with a two-dimensional gradient echo sequence on the axial plane. Acquisition parameters were: TR/TE=50/20 msec, flip angle 15°,number of signals acquired one; matrix 256×256; section thickness 6mm; FOV 40×40 cm2. MATLAB 2019b software was used to process the MRE images. After drawing the region of interest (ROI) on the liver, the obtained values were the liver stiffness. UTE sequence parameters: TR/TE=2.90/0.05 msec; flip angle 11°; number of signals acquired one; matrix 256×80; section thickness 6mm; FOV 36×26 cm2. In order to calculate UTE signals, Same ROIs were measured in all subjects on the same liver plane as MRE images. ROIs of cerebrospinal fluid (CSF) were also drawn in the same plane as the reference region. SIR (signal intensity ratio) was calculated by the following equation: SIR=UTEliver/UTECSF, where UTEliver and UTECSF represents UTE signal of liver and CSF, respectively. Each section was obtained in one breath hold of 14 seconds at the end of expiration. Correlation between MRE data and liver UTE signals and UTE SIR were evaluated with Spearman correlation coefficients by using SPSS version 20.0 (SPSS Inc., Chicago, IL). A one-way analysis of variance was used to compare liver UTE signals and UTE SIR among different stages of hepatic fibrosis. P values smaller than 0.05 were considered to indicate a significant difference.Results
Liver UTE signals showed a statistically significant correlation (P<0.05, r=-0.520) with the liver stiffness at MRE (Figure 1). Figure 2 showed the UTE images and MRE images of patients with fibrosis F1 stage and F3 stage. SIR and the liver stiffness at MRE were also very strongly and inversely correlated (P<0.05, r=-0.654) (Figure 3).The mean liver stiffness in F0, F1, F2, F3 and F4 were 2.22 kPa, 2.60 kPa, 2.83 kPa, 3.26kPa, and 4.36 kPa, respectively (P<0.05 F=52.75). There were slightly differences between different stages in the UTE signals (P=0.058, F=2.59) (Figure 4). The mean liver UTE signals in F0, F1, F2, F3 and F4 were 962.43, 972.00, 856.00, 745.33, and 850.85, respectively. There were significantly differences between different stages in the SIR (P<0.05, F=5.55) (Figure 5). The mean SIR in F0, F1, F2, F3 and F4 were 2.42, 2.13, 1.90, 1.69, and 1.79, respectively.Discussion & Conclusion
In our study, UTE showed excellent performance for characterization of different stages of hepatic fibrosis. The results of this study support the hypothesis that UTE is an effective technique with diagnostic accuracy for distinguishing the stages of hepatic fibrosis. In future, more well-designed studies with larger number size are needed to confirm our findings.Acknowledgements
Funding support from grant 31870941 from National Natural Science Foundation of China (NSFC) and grant 1944190700 from Shanghai Science and Technology Committee (STCSM) are acknowledged.References
1. Chappell K E , Patel N , Gatehouse P D , et al. Magnetic resonance imaging of the liver with ultrashort TE (UTE) pulse sequences[J]. Journal of Magnetic Resonance Imaging, 2003, 18(6):709–713.2.
2. Feng Y , Zhu M , Qiu S , et al. A multi-purpose electromagnetic actuator for magnetic resonance elastography[J]. Magnetic Resonance Imaging, 2018, 51:29-34.
Figures
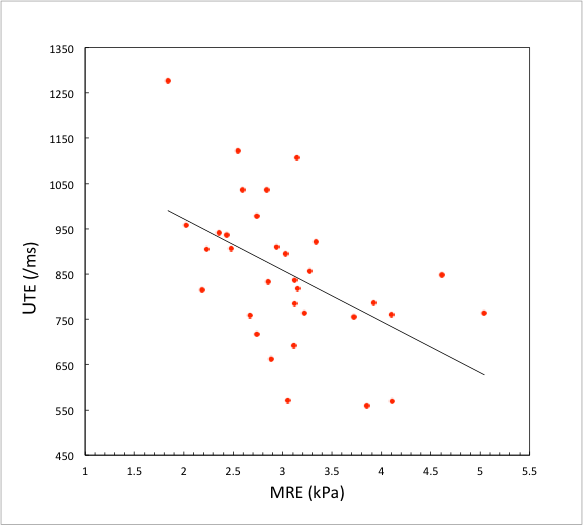
Figure 1. Graph of the results of linear correlation analysis — comparing liver UTE signals with liver stiffness at MRE.
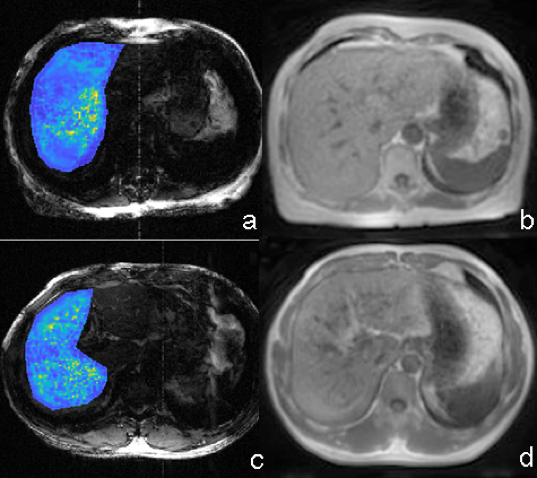
Figure 2: MRE image (a) and UTE image (b) in a 63-year-old woman with fibrosis F1. The UTE signal is 1122 and liver stiffness was 2.55 kPa. MRE image (c) and UTE image (d) in a 48-year-old man with fibrosis F3. The UTE signal is 692 and liver stiffness was 3.11 kPa.
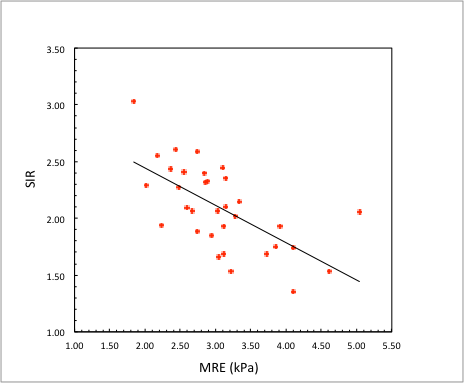
Figure 3: Graph of the results of linear correlation analysis — comparing SIR signals with liver stiffness at MRE.
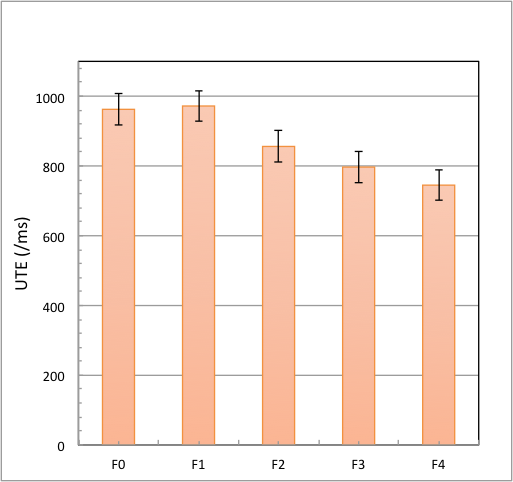
Figure 4. Mean liver UTE signals in patients for different stages (F0, F1, F2, F3 and F4).
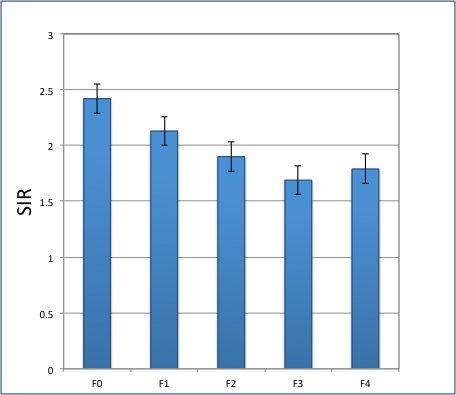
Figure 5. Mean UTE SIR in patients for different stages (F0, F1, F2, F3 and F4).