1880
Longitudinal MRI and MR Elastography (MRE) Assessment in Patients with Diagnosed Nonalcoholic Fatty Liver Disease (NAFLD)1Department of Radiology, Mayo Clinic, Rochester, MN, United States, 2Devision of Gastroenterology and Hepatology, Mayo Clinic, Rochester, MN, United States, 3Devision of Biomedical Statistics and Informatics, Mayo Clinic, Rochester, MN, United States, 4Department of Radiology, the Third Affiliated Hospital of Sun Yat-Sen University, Guangdong, China, 5Department of Radiology, West China Hospital, Chengdu, Sichuan, China, 6Devision of Physiology and Biomedical Engineering, Mayo Clinic, Rochester, MN, United States
Synopsis
To identify individuals at high risk for rapid fibrosis progression, we retrospectively investigated longitudinal changes in liver stiffness measurements (LSM) and proton density fat fraction (PDFF) in 36 NAFLD patients. At the early fibrosis stages, the rate of change of LSM is slow and positively correlated with the rate of change in PDFF. At later fibrosis stages, the rate of change in LSM is higher and is negatively correlated with ΔPDFF. Compared with other risk factors, the baseline value of LSM and the rate of change in PDFF was most strongly correlated with subsequent change in LSM.
Introduction
The global prevalence of nonalcoholic fatty liver disease (NAFLD) is currently estimated to be 24%1. Advanced hepatic fibrosis has been shown to be the primary driver and critical factor for long-term outcome and mortality in NAFLD 2,3. There is an emerging consensus that magnetic resonance elastography (MRE) liver stiffness measurement (LSM) provides the most accurate noninvasive quantitative assessment of hepatic fibrosis in NAFLD 4-6. Proton density fat fraction (PDFF) measured by magnetic resonance imaging (MRI) is another well-established quantitative imaging biomarker for assessing hepatic steatosis 7,8. A combination of MRE-LSM and MRI-PDFF could improve patient management and trial efficiency by reducing costs, complications, sample size and histologic heterogeneity in disease classification. There is a knowledge gap about the dynamic evolution of steatosis and fibrosis in the natural history of NAFLD. It is also critical to identify noncirrhotic NAFLD individuals at high risk of rapid fibrosis progression. Therefore, the goal of this study was to measure rates of change of MRE-LSM and MRI-PDFF biomarkers in a cohort of NAFLD patients who have had repeated examinations over time and to explore the clinical implications of rates of change of these biomarkers.Methods
In this IRB approved study we identified 128 adult NAFLD patients who had at least two MRI/MRE examinations between 2008 and 2020. The presence of a significant change in LSM was determined by the z-scores with a sigma level generated from an existing test-retest repeatability MRE cohort study 9 (Figure 1). The relative LSM and PDFF change rates per year were then calculated for every adjacent time segment (N=55). Risk factors such as type-2 diabetes, obesity, hyperlipidemia, hypertension, and obstructive sleep apnea were also obtained from electronic medical records. Kruskal-Wallis comparisons of LSM change rate were performed regarding baseline LSM (cirrhosis cut-off = 4.2 kPa) and potential risk factors. Spearman’s correlations were used to analyze the relationship between the LSM and PDFF change rates in each subgroup. A generalized linear model was applied to predict LSM change rate with PDFF change rate and baseline LSM. Statistical analysis was performed with JMP pro software (version 14.1.0; SAS Institute Inc.).Results
A total of 36 subjects with significant LSM changes were identified (56% women, mean age 59 years, BMI = 33.5±4.9kg/m2, 50% with 2 MREs, 50% with 3-9 MREs) with a median follow-up time of 4 years (range: 6 months-10 years). When using 4.2 kPa as the cutoff value of cirrhosis, different relationships were observed between LSM change ratio/year (ΔLSM) and PDFF change ratio/year (ΔPDFF) as shown in Figure 2. Among patients at the early fibrosis stages (LSM <4.2 kPa), low change rates and a positive correlation were shown between ΔLSM and ΔPDFF. In comparison, at the later fibrosis stages (LSM ≥4.2 kPa), high change rates and a negative correlation were observed between ΔLSM and ΔPDFF. Baseline LSM and ΔPDFF as two dependent variable risk factors determine LSM change rate (P<0.05)(Table 1). Obesity, diabetes, age, BMI, obstructive sleep apnea, hyperlipidemia, baseline PDFF, and hypertension were not found to be significant factors affecting ΔLSM. Figure 3 shows a time series of MRE elastograms for a patient with cirrhosis and a patient without cirrhosis. Figure 4 illustrates four scatter plots showing obesity, diabetes and hypertension as three potential factors that may affect ΔLSM at the early or at late fibrosis stages.Discussion
Although NAFLD has a high prevalence, only a subset of NAFLD patients progress to significant fibrosis or experience associated morbidity10. Monitoring NAFLD with repeated liver biopsies has shown a variable natural history with 42% fibrosis progression and 18% regression over a median follow-up of 6.6 years11-13. Our study has a shorter follow-up time and showed that only 28% (36/128) of patients had significant changes in LSM. Steatosis change rate should directly impact the subsequent inflammation and fibrosis change. Therefore, it is logical to use baseline LSM and ΔPDFF to identify individuals at different progression/regression states and rates. Baseline LSM is a known prognostic factor of cirrhosis in NAFLD14. Our findings reinforced the concept that baseline liver stiffness (fibrosis) and ΔPDFF (fat change rate) may have bi-directional effects in the early and late stages of fibrosis progression. The cutoff value of 4.2 kPa for cirrhosis is also practical in clinical evaluation. The dynamically changing relationship between ΔLSM and ΔPDFF could be partially attributed to the attenuated steatosis with advanced fibrosis progression15. Obesity, diabetes, and hypertension are potential risk factors that may affect ΔLSM in a different direction or at a different rate that deserves further investigation. Our study has some limitations, including 1) a small number of patients and a short follow-up time; and 2) incomplete clinical, laboratory, and pathological data due to the retrospective nature of this study.Conclusion
The temporal change rate of MRI-PDFF and MRE-LSM is a biomarker itself which shows promise for identifying individuals at high risk of rapid clinical progression and improving patient management.Acknowledgements
Our study is supported by grant of NIH R37 (EB001981), NIH R01 (EB017197), NIH K23 (DK115594), NIH R01 (DK059615) and DoD W81XWH-19-1-0583-01.References
1. Younossi ZM, Koenig AB, Abdelatif D, Fazel Y, Henry L, Wymer M. Global epidemiology of nonalcoholic fatty liver disease-Meta-analytic assessment of prevalence, incidence, and outcomes. Hepatology. 2016;64(1):73-84.
2. Angulo P, Kleiner DE, Dam-Larsen S, et al. Liver Fibrosis, but No Other Histologic Features, Is Associated With Long-term Outcomes of Patients With Nonalcoholic Fatty Liver Disease. Gastroenterology. 2015;149(2):389-397 e310.
3. Hagstrom H, Nasr P, Ekstedt M, et al. Fibrosis stage but not NASH predicts mortality and time to development of severe liver disease in biopsy-proven NAFLD. J Hepatol. 2017;67(6):1265-1273.
4. Lefebvre T, Wartelle-Bladou C, Wong P, et al. Prospective comparison of transient, point shear wave, and magnetic resonance elastography for staging liver fibrosis. Eur Radiol. 2019;29(12):6477-6488. 5. Imajo K, Kessoku T, Honda Y, et al. Magnetic Resonance Imaging More Accurately Classifies Steatosis and Fibrosis in Patients With Nonalcoholic Fatty Liver Disease Than Transient Elastography. Gastroenterology. 2016;150(3):626-637 e627.
6. Eddowes PJ, Sasso M, Allison M, et al. Accuracy of FibroScan Controlled Attenuation Parameter and Liver Stiffness Measurement in Assessing Steatosis and Fibrosis in Patients With Nonalcoholic Fatty Liver Disease. Gastroenterology. 2019;156(6):1717-1730.
7. Kim HJ, Kim B, Yu HJ, et al. Reproducibility of hepatic MR elastography across field strengths, pulse sequences, scan intervals, and readers. Abdom Radiol (NY). 2020;45(1):107-115.
8. Castera L, Friedrich-Rust M, Loomba R. Noninvasive Assessment of Liver Disease in Patients With Nonalcoholic Fatty Liver Disease. Gastroenterology. 2019;156(5):1264-1281 e1264.
9. Li J, Venkatesh SK, Yin M. Advances in Magnetic Resonance Elastography of Liver. Magn Reson Imaging Clin N Am. 2020;28(3):331-340.
10. Anstee QM, Targher G, Day CP. Progression of NAFLD to diabetes mellitus, cardiovascular disease or cirrhosis. Nat Rev Gastroenterol Hepatol. 2013;10(6):330-344.
11. McPherson S, Hardy T, Henderson E, Burt AD, Day CP, Anstee QM. Evidence of NAFLD progression from steatosis to fibrosing-steatohepatitis using paired biopsies: implications for prognosis and clinical management. J Hepatol. 2015;62(5):1148-1155.
12. Pais R, Charlotte F, Fedchuk L, et al. A systematic review of follow-up biopsies reveals disease progression in patients with non-alcoholic fatty liver. J Hepatol. 2013;59(3):550-556.
13. Singh S, Allen AM, Wang Z, Prokop LJ, Murad MH, Loomba R. Fibrosis progression in nonalcoholic fatty liver vs nonalcoholic steatohepatitis: a systematic review and meta-analysis of paired-biopsy studies. Clin Gastroenterol Hepatol. 2015;13(4):643-654 e641-649; quiz e639-640.
14. Ajmera V, Park CC, Caussy C, et al. Magnetic Resonance Imaging Proton Density Fat Fraction Associates With Progression of Fibrosis in Patients With Nonalcoholic Fatty Liver Disease. Gastroenterology. 2018;155(2):307-310 e302.
15. Gidener T, Ahmed OT, Larson JJ, et al. Liver Stiffness by Magnetic Resonance Elastography Predicts Future Cirrhosis, Decompensation and Death in NAFLD. Clin Gastroenterol Hepatol. 2020. 16. Bedossa P. Histological Assessment of NAFLD. Dig Dis Sci. 2016;61(5):1348-1355.
Figures
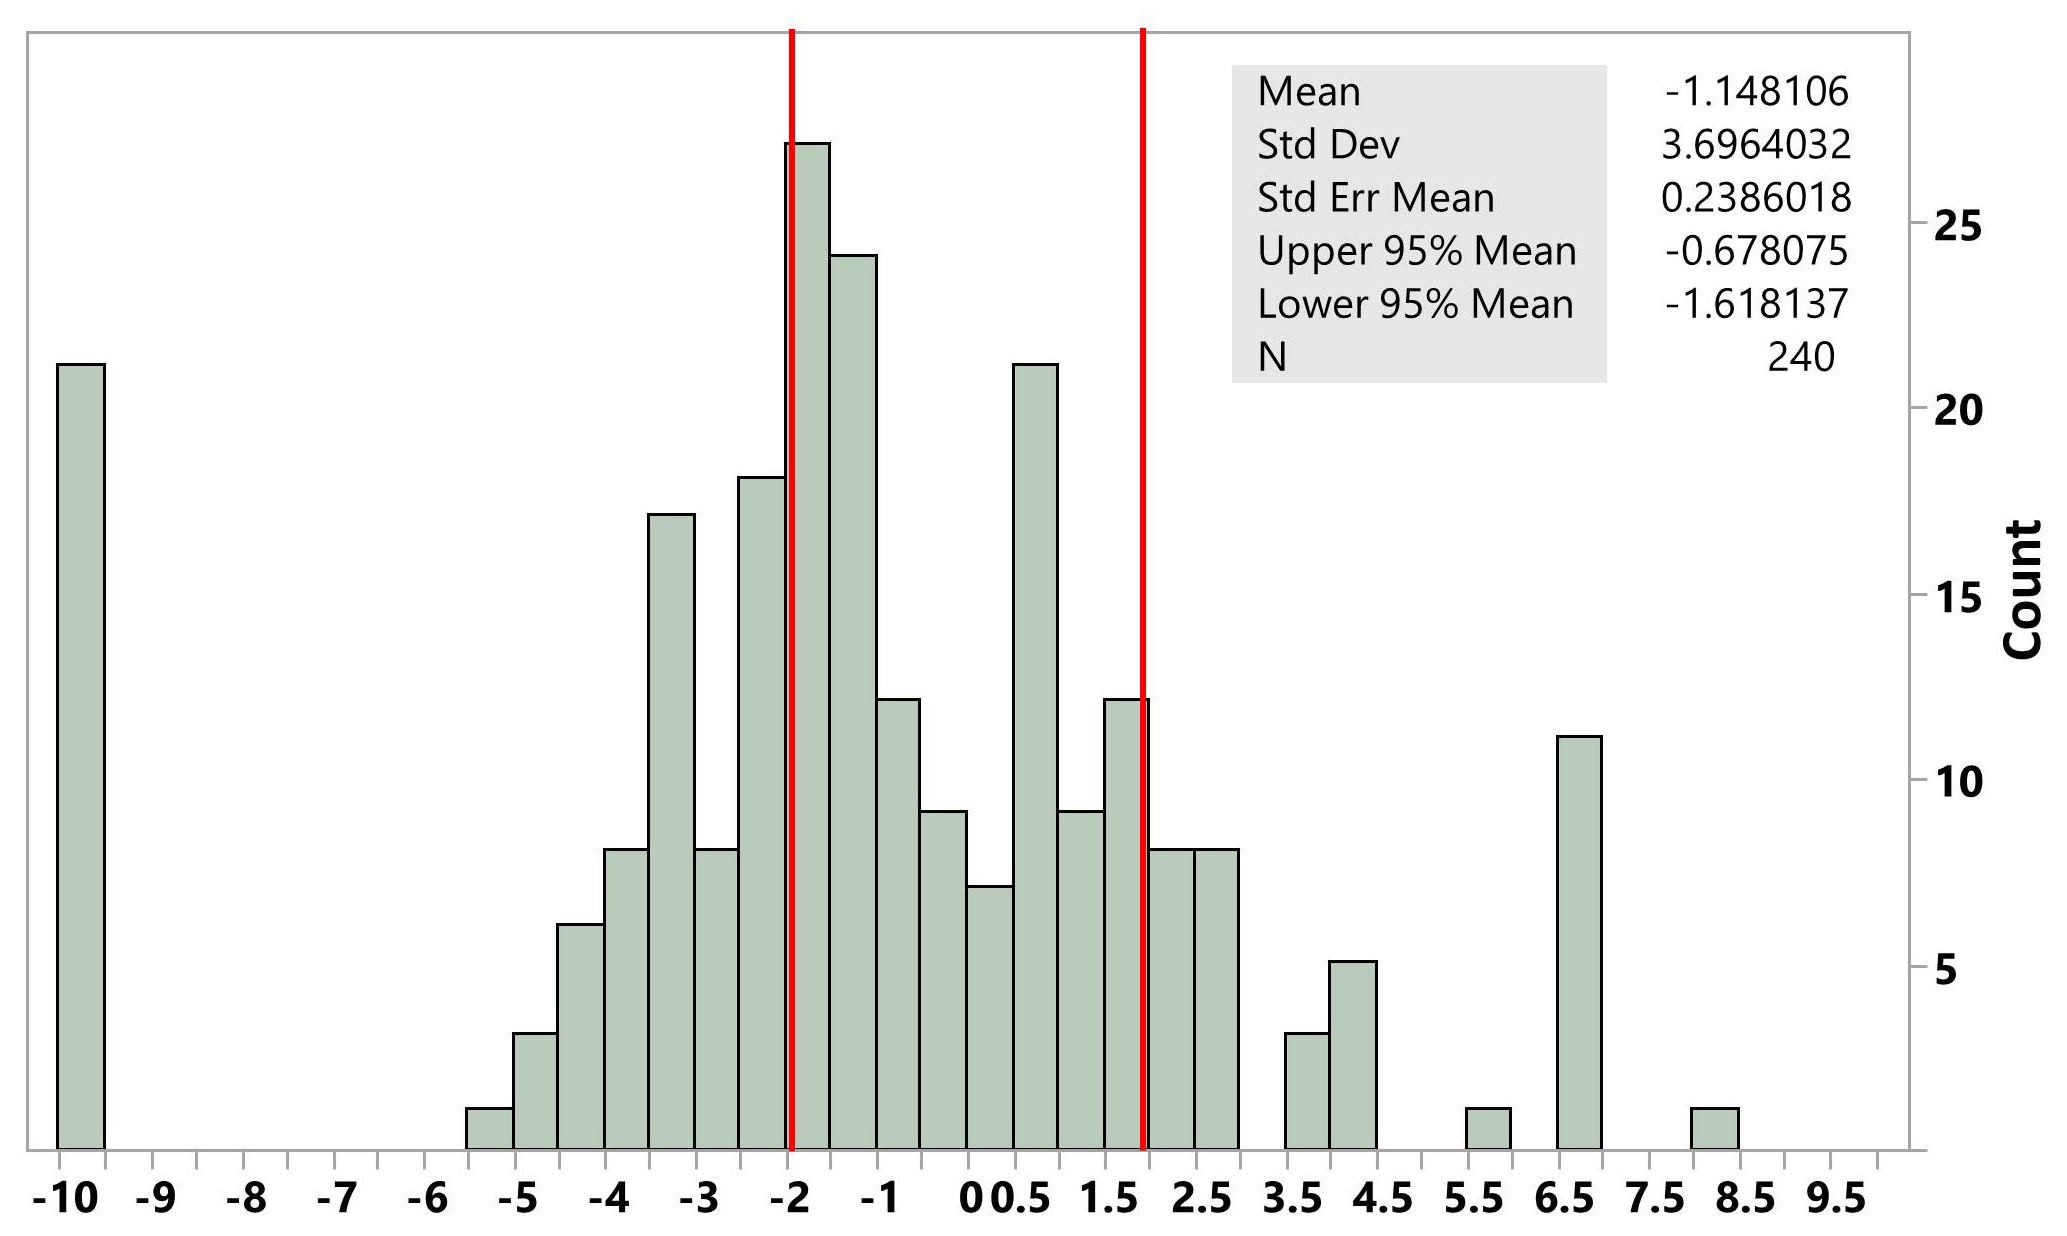
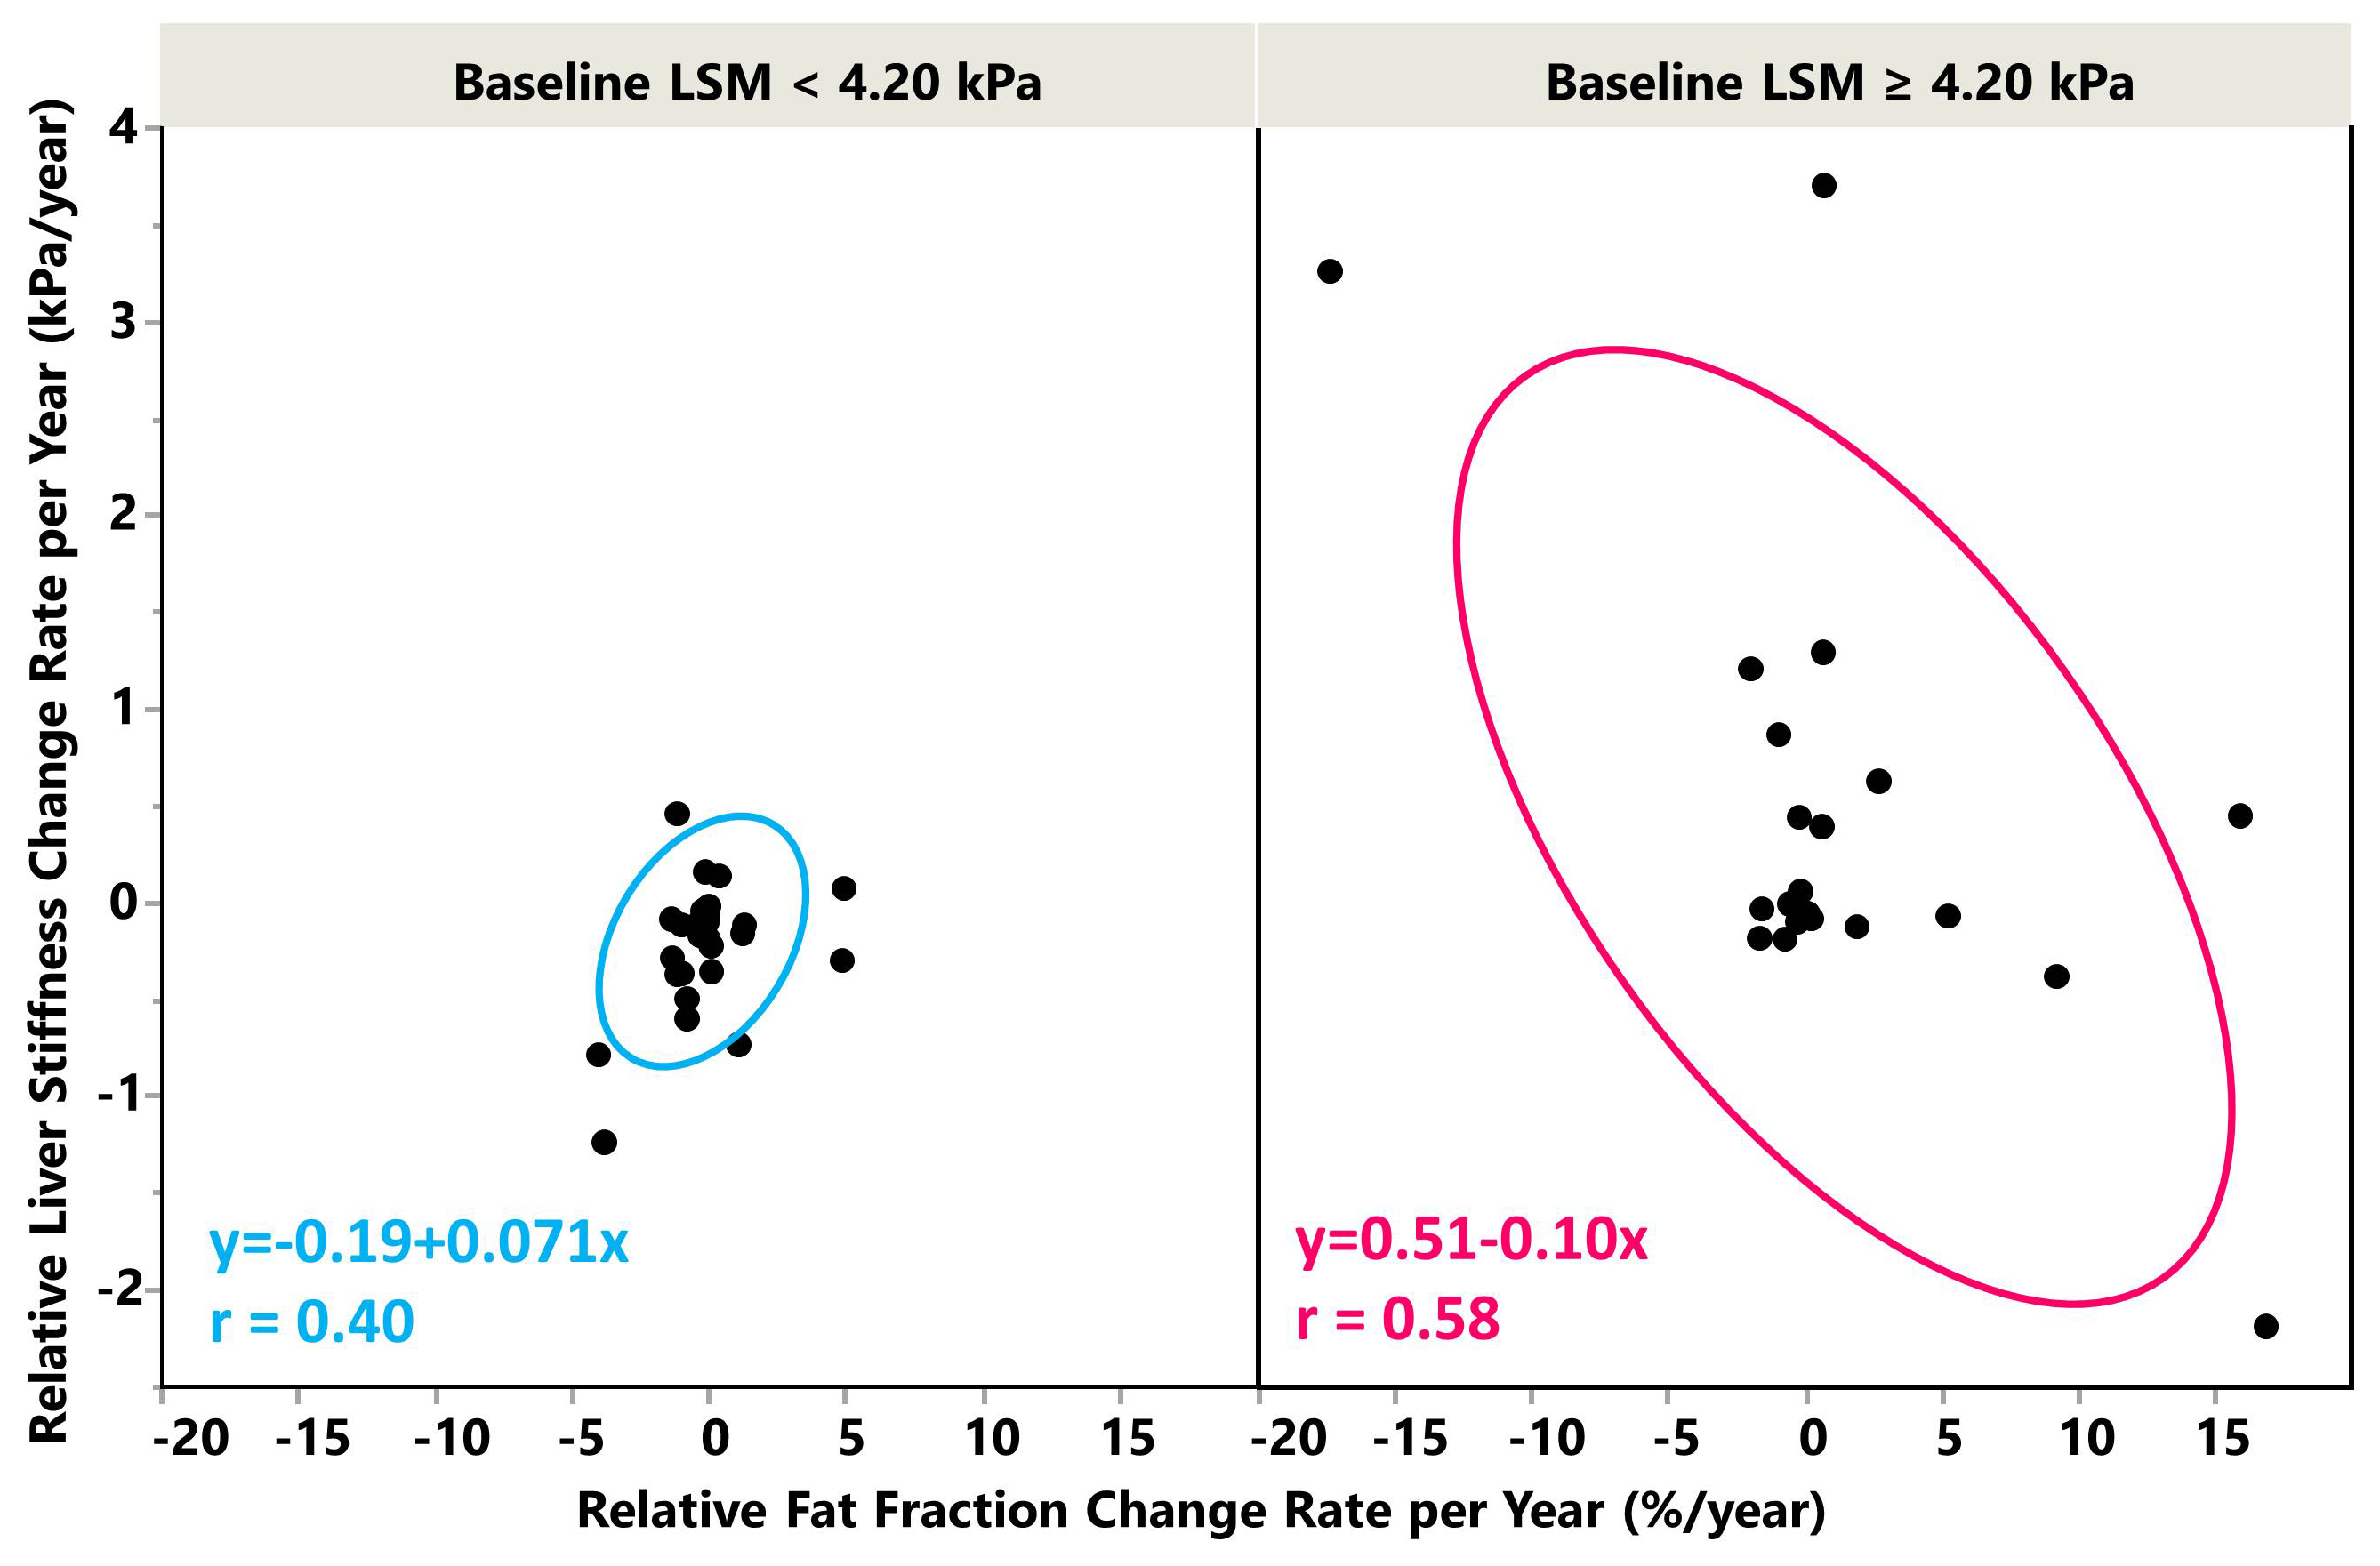
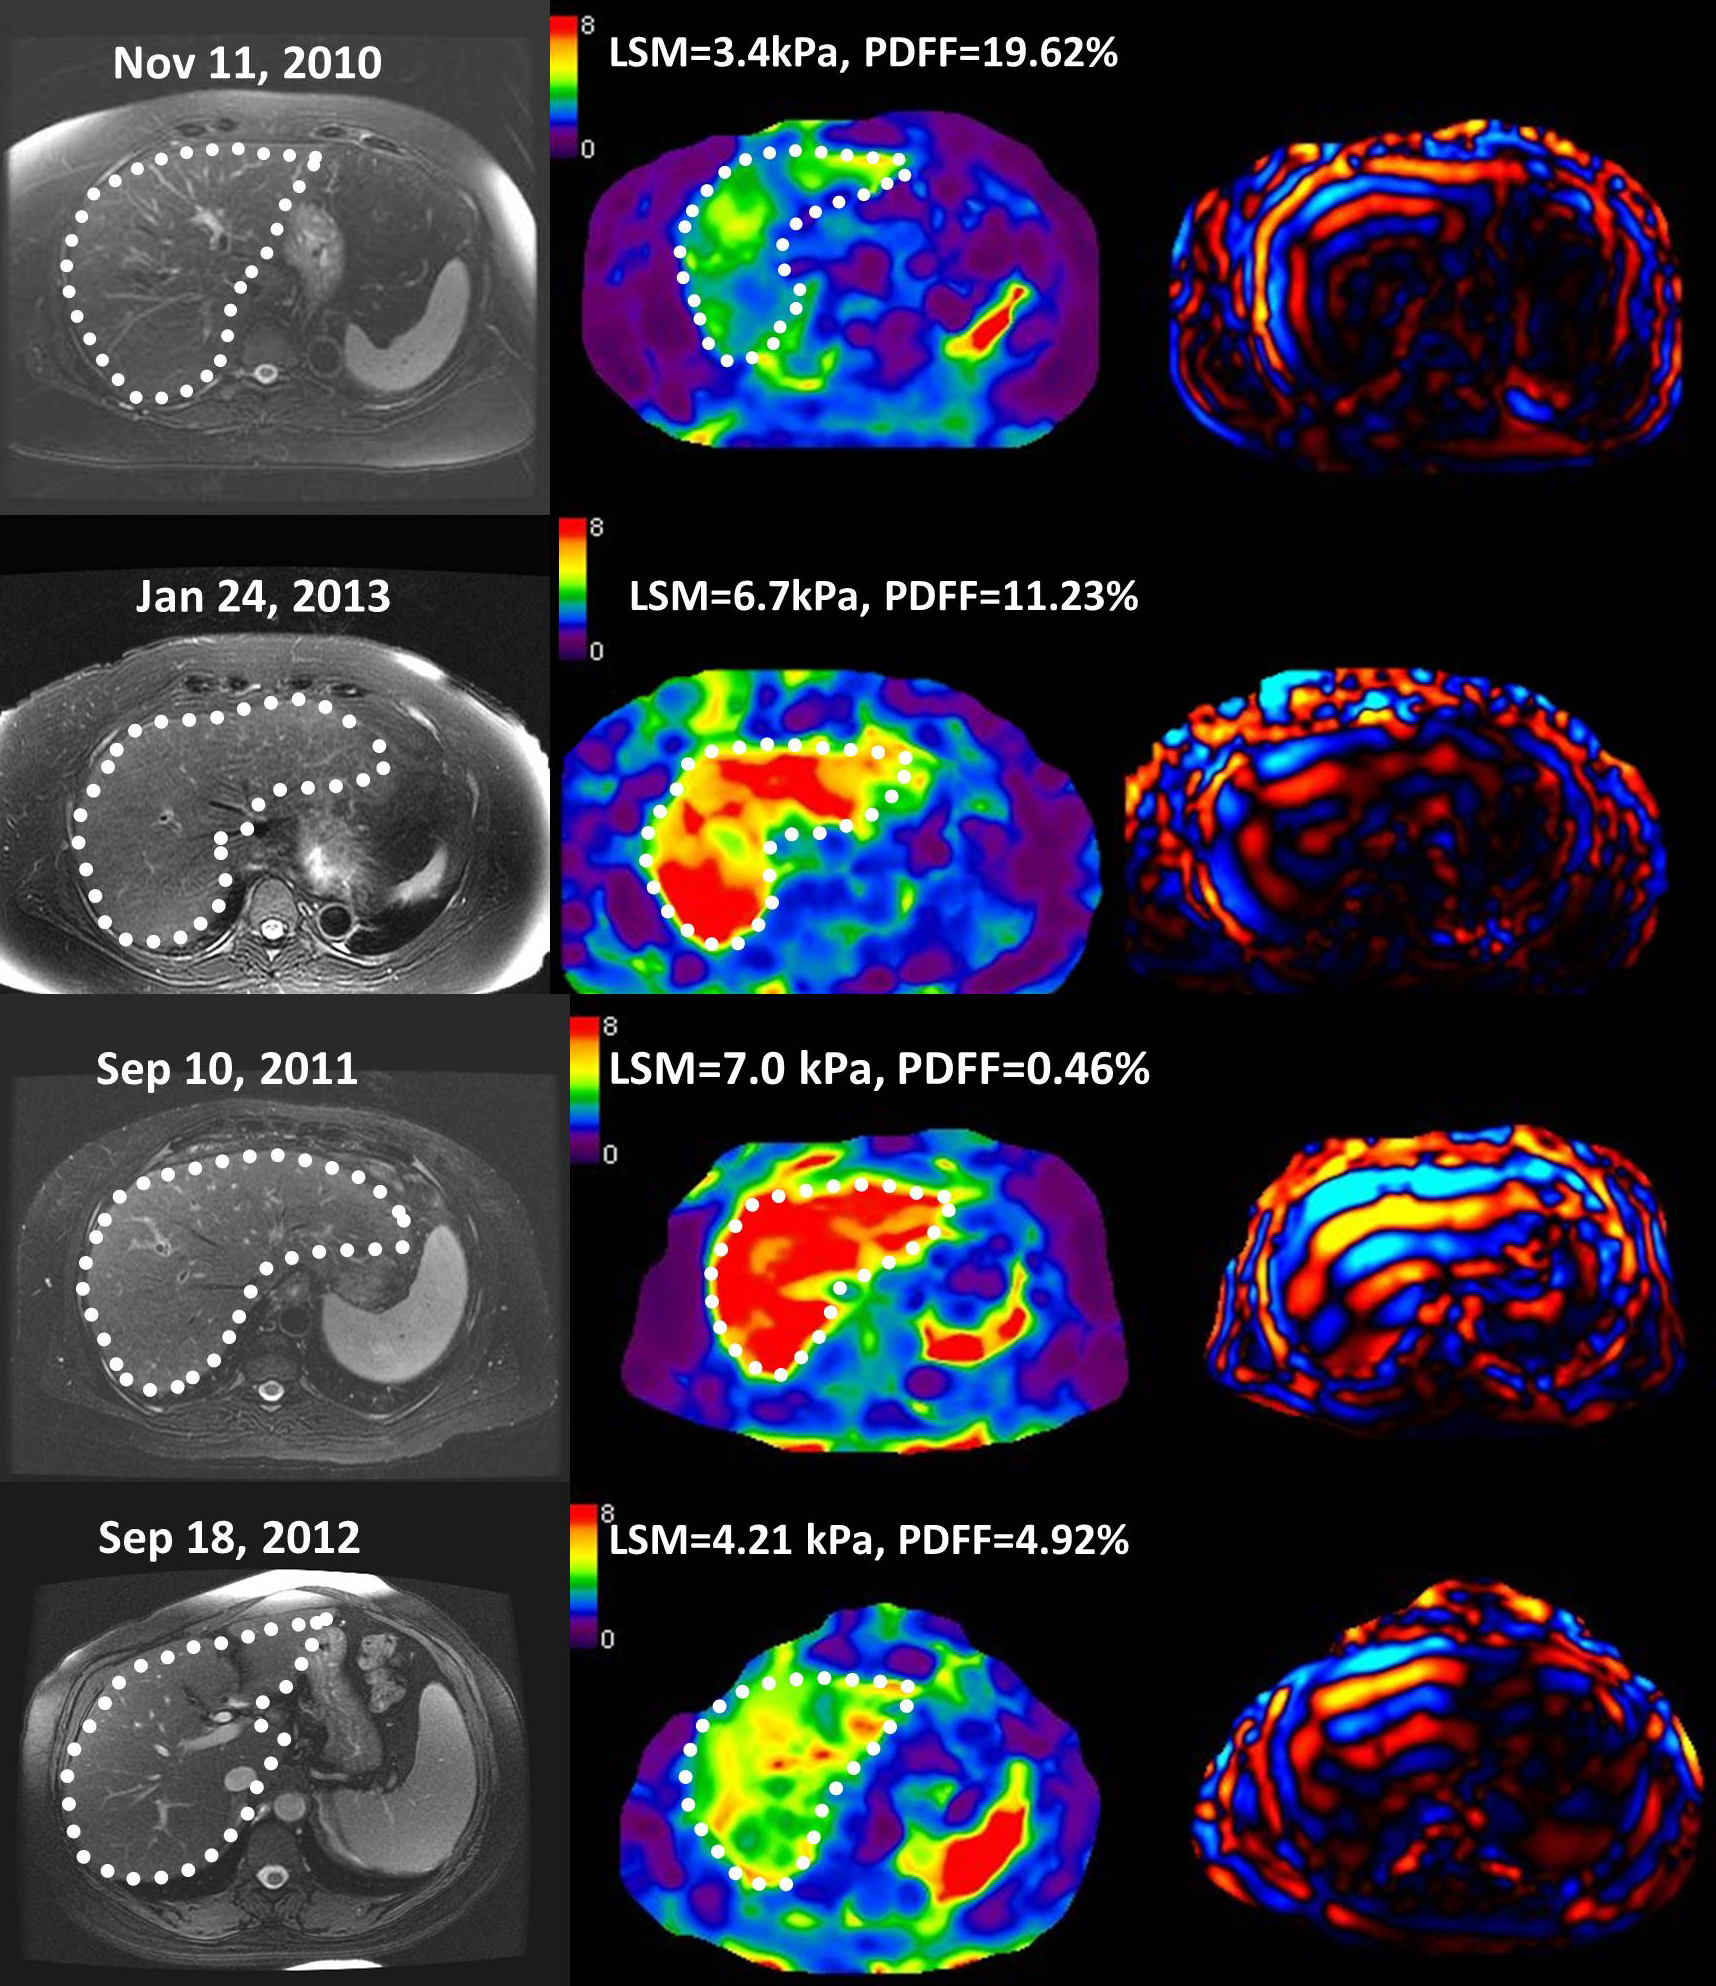
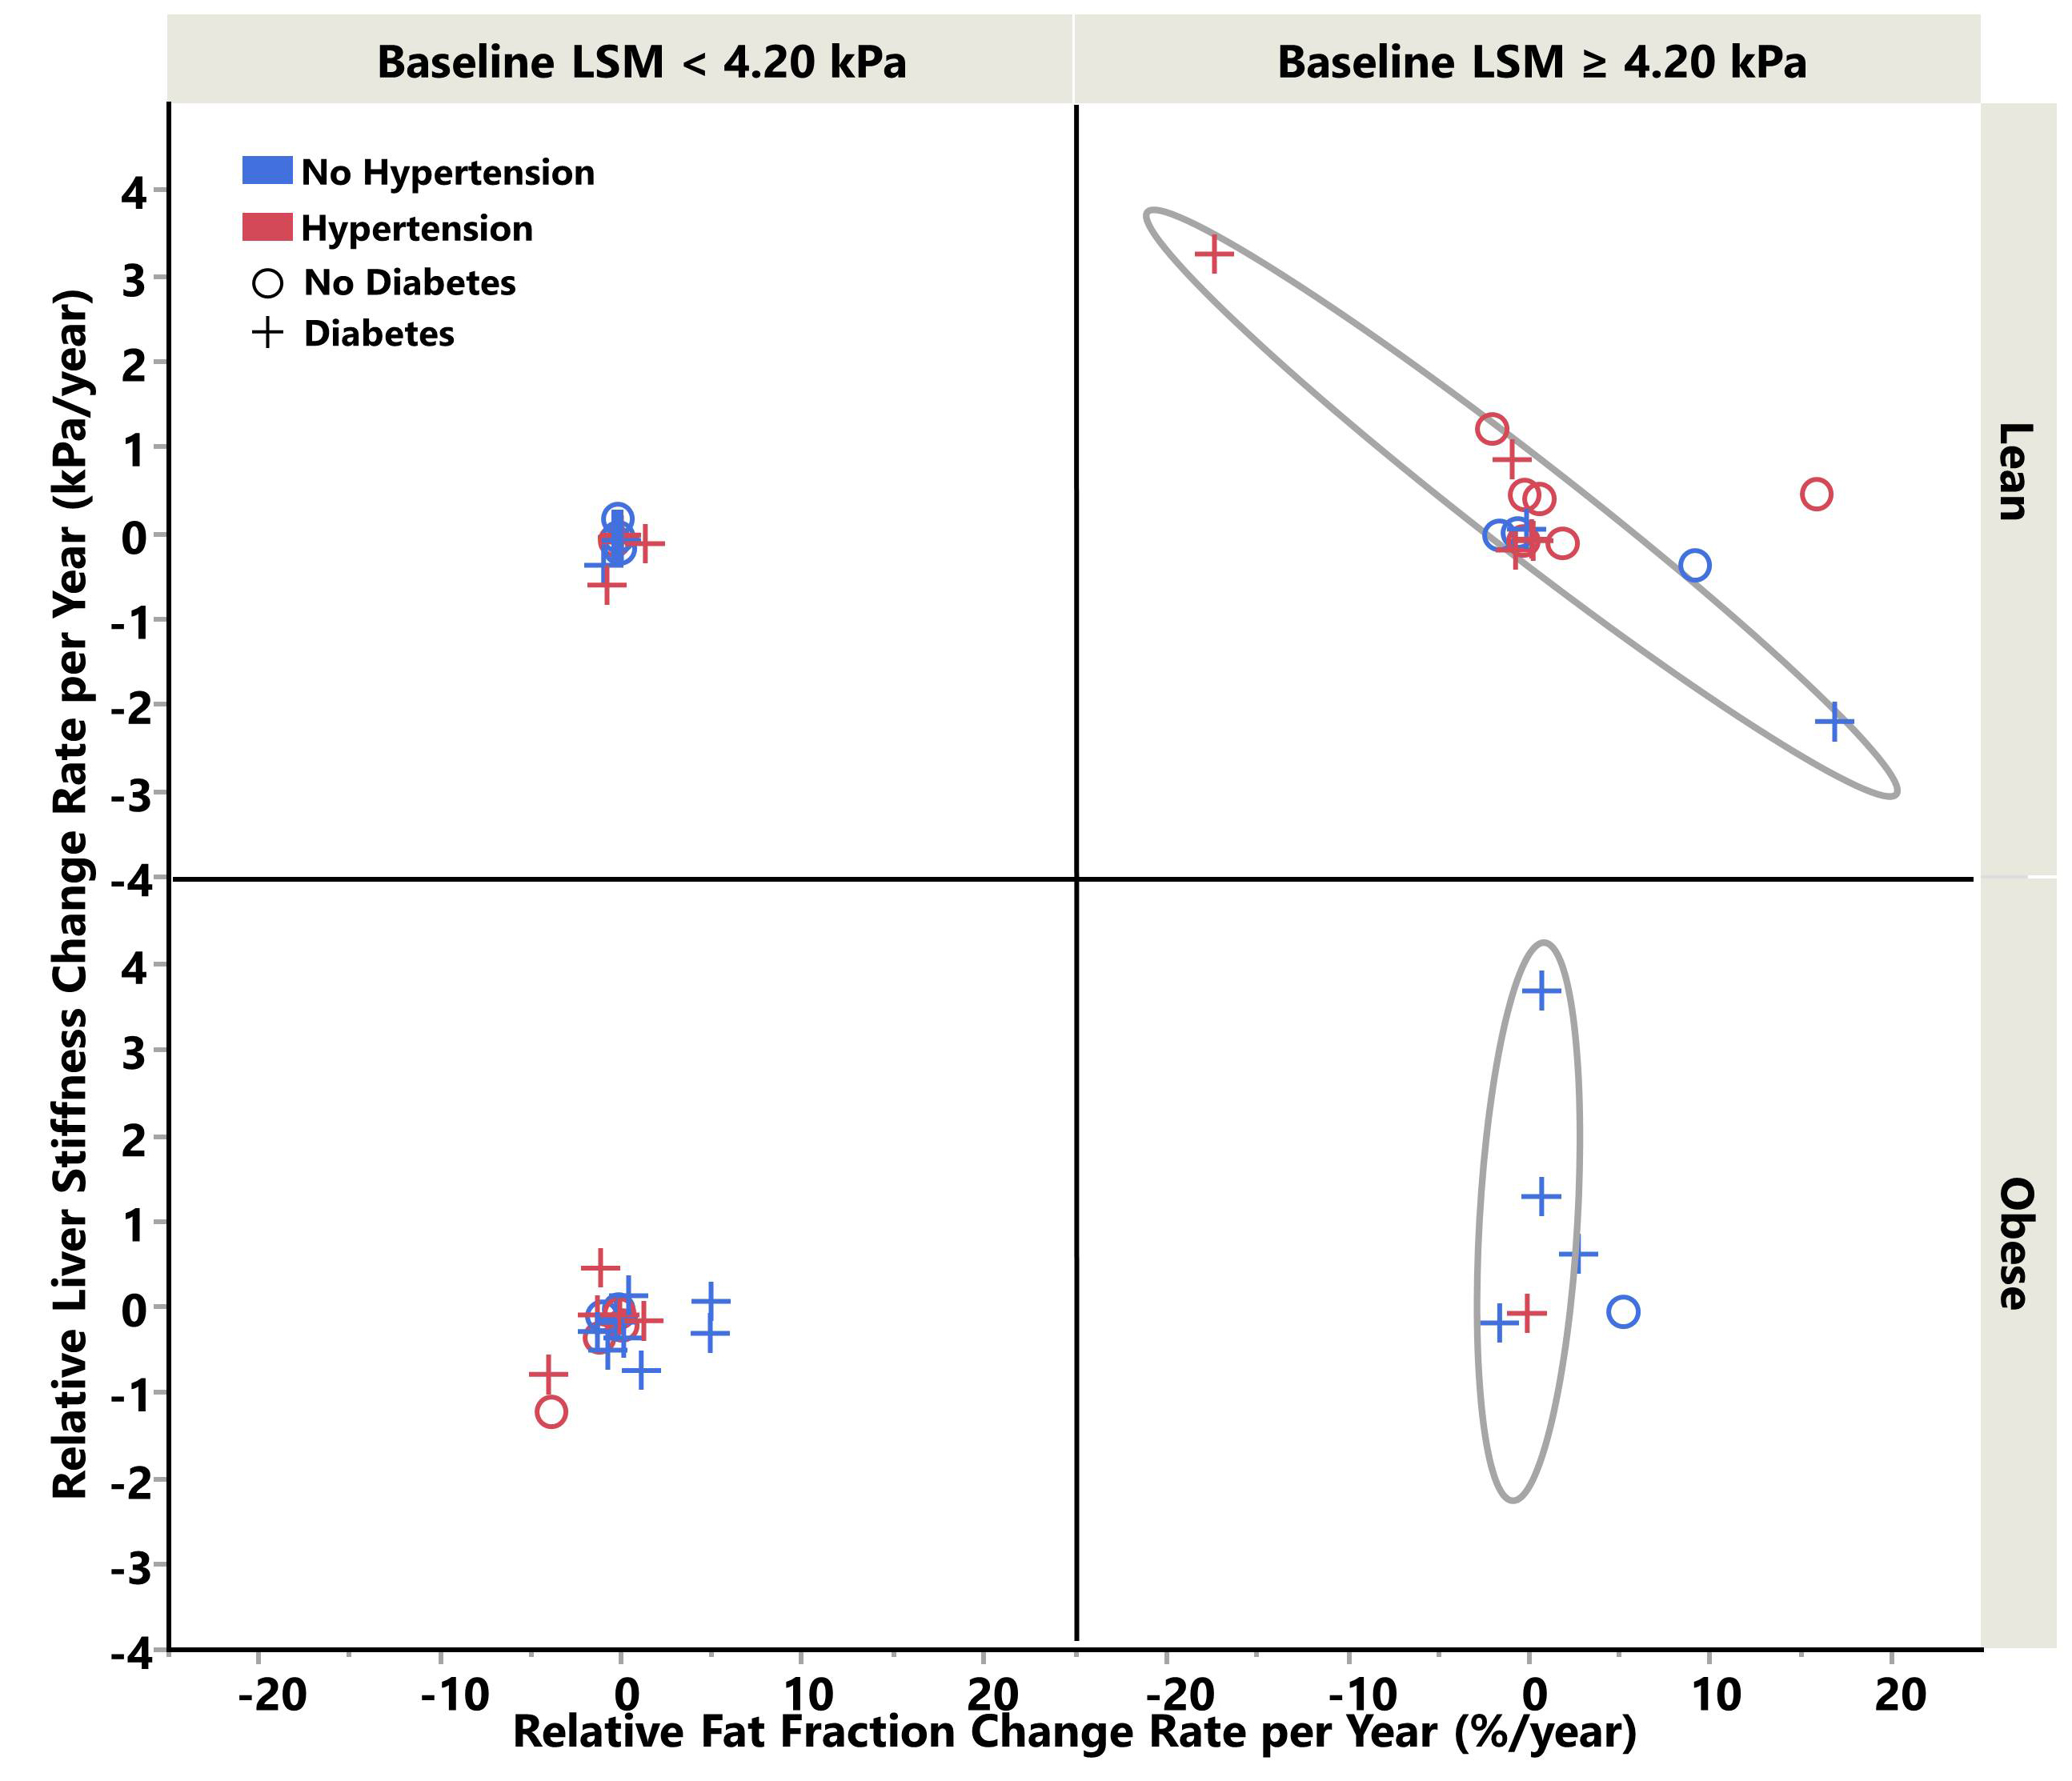
Figure 4. The scatter plot showed potential impact from obesity, diabetes, hypertension on top of the effect of baseline liver stiffness.
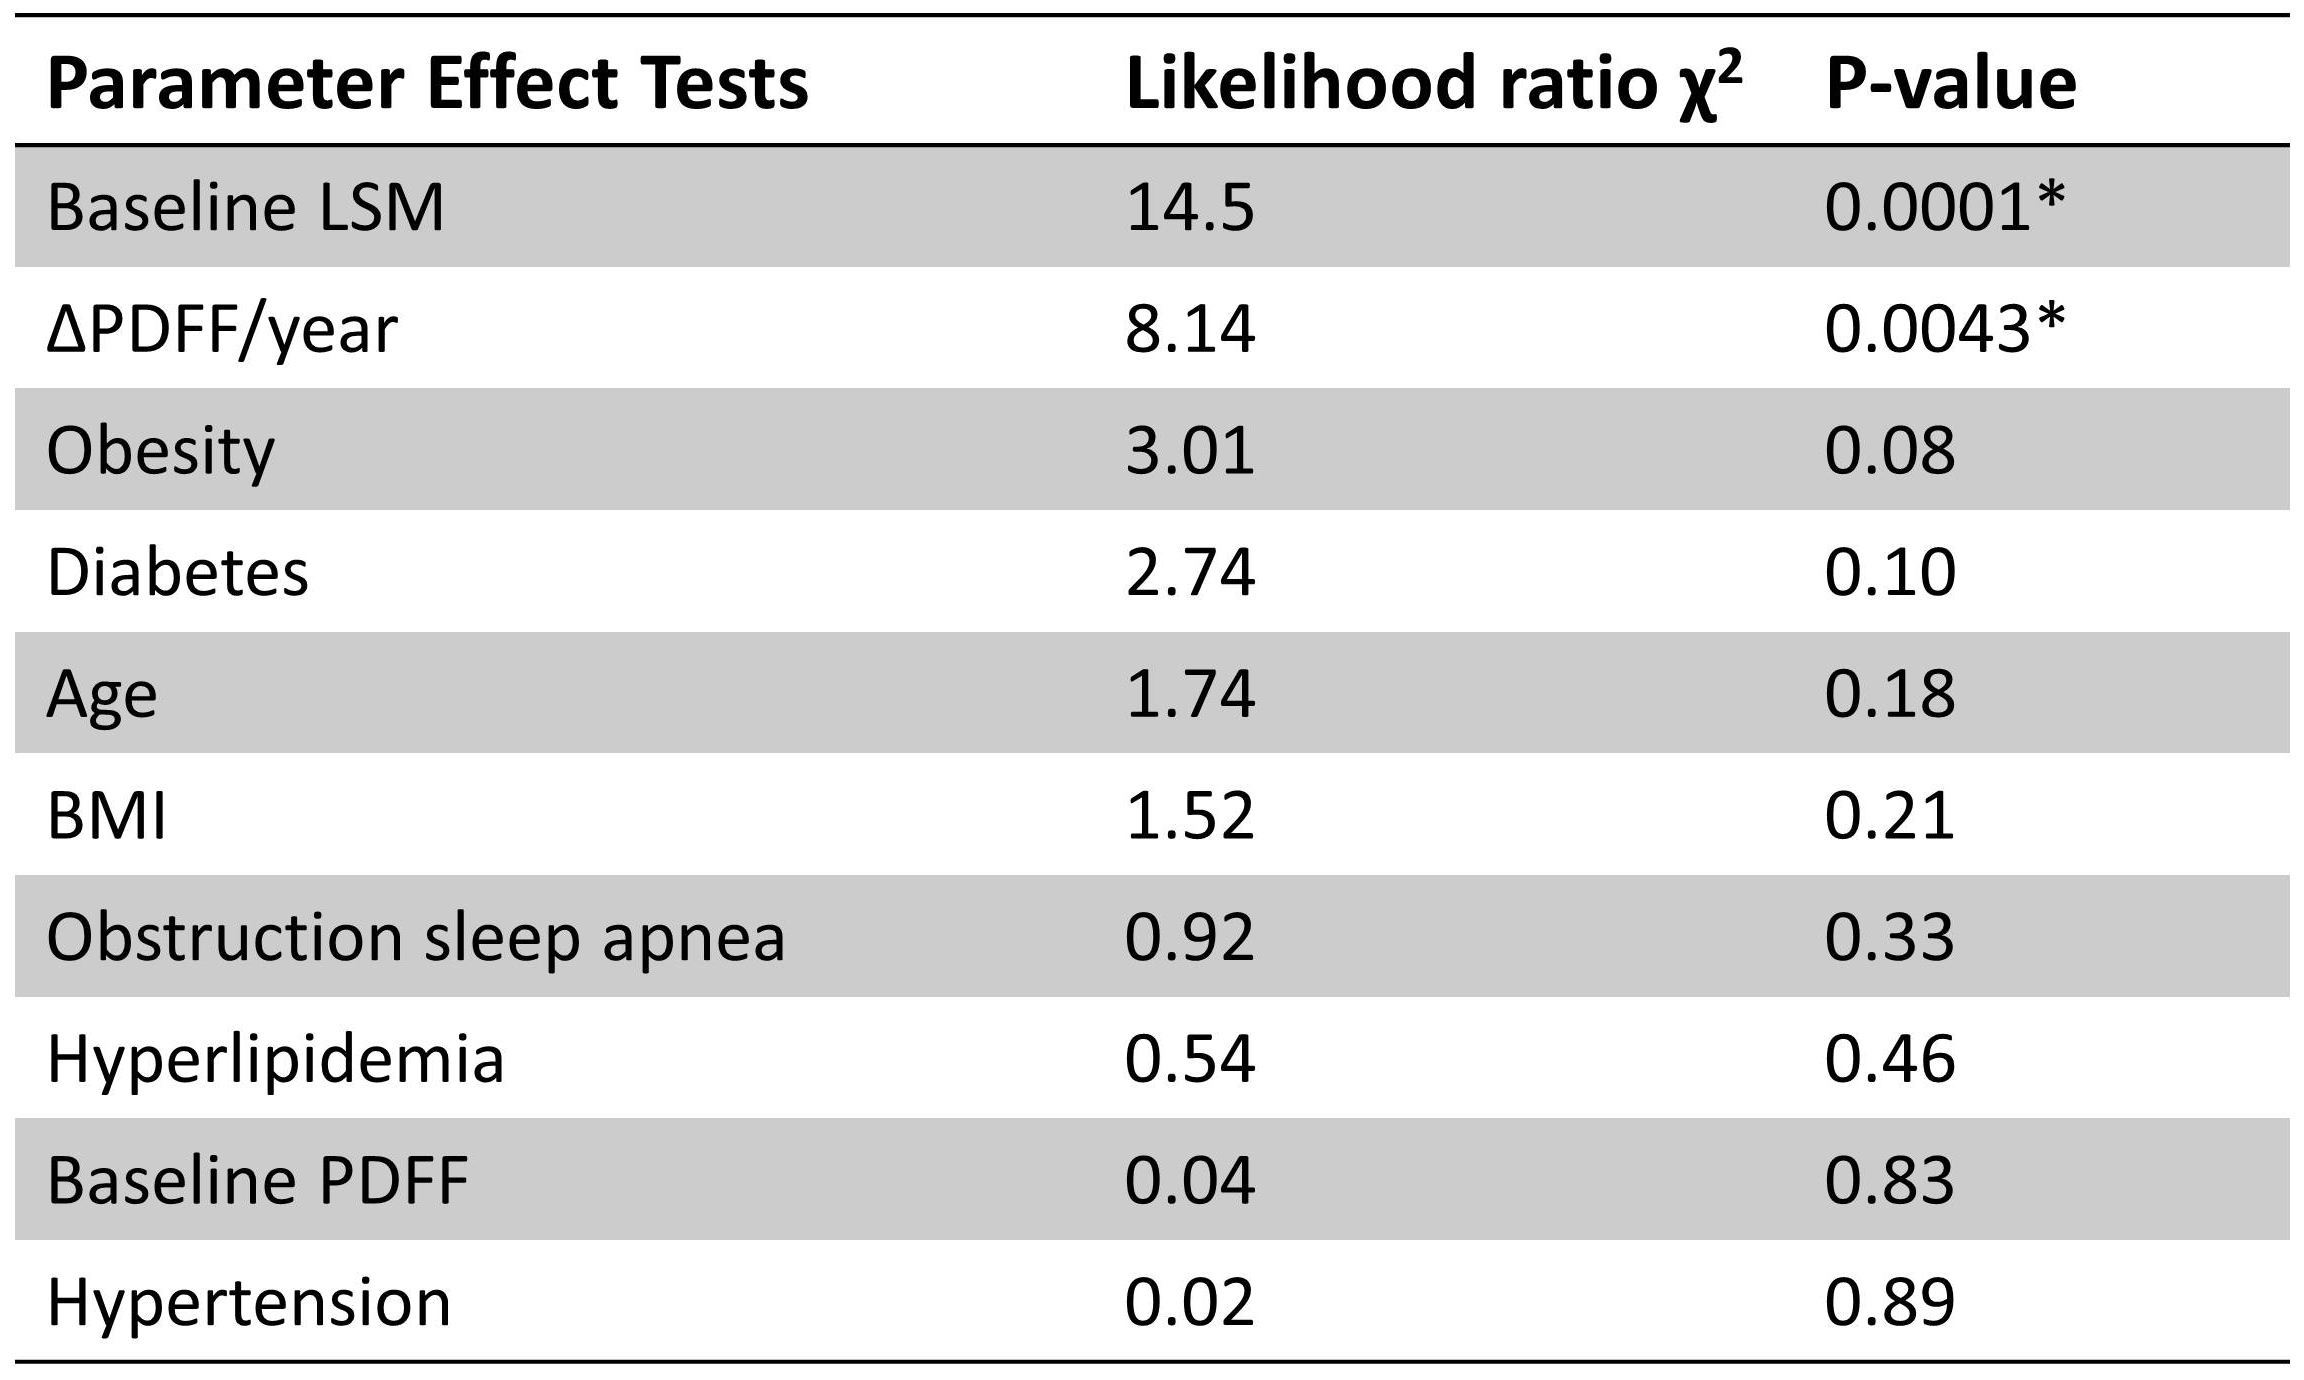
Table 1. Effect tests for potential risk factors as the dependent variable of LSM change rate.