1878
Feasibility of T1 Mapping with Histogram Analysis for the Diagnosis and Staging of Liver Fibrosis: Preclinical Results1Radiology, Third Affiliated Hospital of Soochow University & First People's Hospital of Changzhou, changzhou, China, 2Third Affiliated Hospital of Soochow University & First People's Hospital of Changzhou, changzhou, China, 3Healthcare,Shanghai,China, shanghai, China
Synopsis
We induced LF New Zealand white rabbits model by carbon tetrachloride to compare the diagnostic accuracy of parameters derived from the histogram analysis of precontrast, 10-min hepatobiliary phase (HBP) and 20-min HBP MOLLI T1 maps for staging liver fibrosis (LF). The mean, median, skewness, kurtosis, entropy, inhomogeneity and 10th/25th/75th/90th percentiles of T1native, T110min and T120min were compared. The 75th of T1native, entropy10min, and entropy20min were the three most reliable imaging markers in reflecting the stage of LF. The entropy derived from 20-min HBP T1 mapping is the best parameter for predicting the LF stage.
Purpose
Liver fibrosis (LF) may lead to cirrhosis and hepatocellular carcinoma(1). Only early stage LF is reversible by proper treatment(2,3). Therefore, accurate assessment of LF is critical to the prognosis and clinical management of chronic liver diseases. Invasive liver biopsy is still the gold standard for evaluating hepatic fibrosis, but it presents several limitations. Modified Look-Locker inversion recovery (MOLLI) T1 mapping technology is a noninvasive, quantitative method for determining tissue T1 relaxation time(4–7). Image histogram analysis is a method used to evaluate the grayscale distribution in the ROI and quantify the heterogeneity of pathological changes (8–11).This study was to compare the diagnostic accuracy of parameters derived from the histogram analysis of precontrast, 10-min hepatobiliary phase (HBP) and 20-min HBP T1 maps for staging liver fibrosis (LF).Materials and Methods
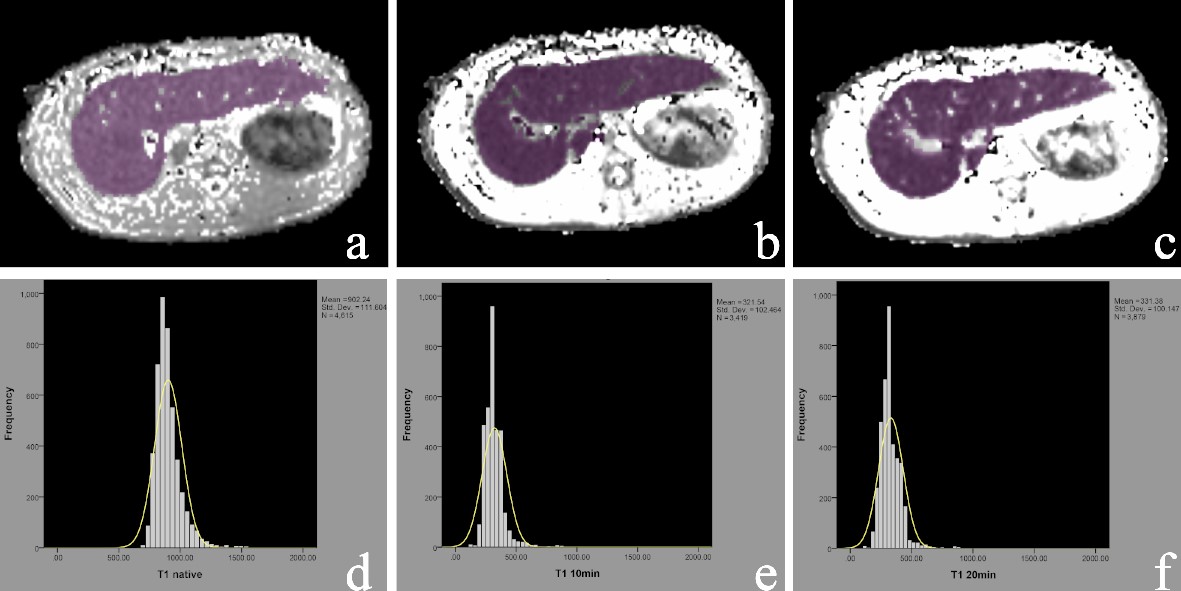
Methods LF was induced in New Zealand white rabbits by subcutaneous injections of carbon tetrachloride for 4-16 weeks (n=120), and 20 rabbits injected with saline served as controls. After 4, 8, 12, and 16 weeks injections of CCl4, rabbits underwent a MRI examination with a 20-channel HeadNeck coil on a 3T scanner (Ingenia; Philips Healthcare, Best, the Netherlands). Precontrast, 10-min and 20-min HBP MOLLI T1 mapping was performed. Histogram analysis was conducted using FireVoxel (FireVoxel,331; https://wp.nyu.edu/firevoxel/downloads/). Two radiologists processed the T1 mapping blinded to the histopathologic results. Region of interest (ROI) was manually placed on each axial image covering the whole liver parenchyma, avoiding visible vessels, bile ducts, artifacts, and the edge of the liver. Same ROIs are adapted to T1native, T110min and T120min for histogram analysis. The approach of selection of ROI is shown in Fig. 1. The mean, median, skewness, kurtosis, entropy, inhomogeneity and 10th/25th/75th/90th percentiles of T1native, T110min and T120min were derived. LF stage depending on the METAVIR score. The subjects were classified into five groups: F0 = no fibrosis, F1 = fibrous expansion of portal areas without short fibrous septa, F2 = fibrous expansion of most portal areas with occasional portal to portal bridging, F3 = marked bridging with occasional nodules and incomplete cirrhosis, and F4= liver cirrhosis. Quantitative histogram parameters were compared by Kolmogorov-Smirnov test or One-way analysis of variance (ANOVA). spearman correlation between all histogram parameters and LF stage were calculated. For significant parameters, further receiver operating characteristic (ROC) analyses were performed to evaluate the diagnostic performance in differentiating LF stages.Results
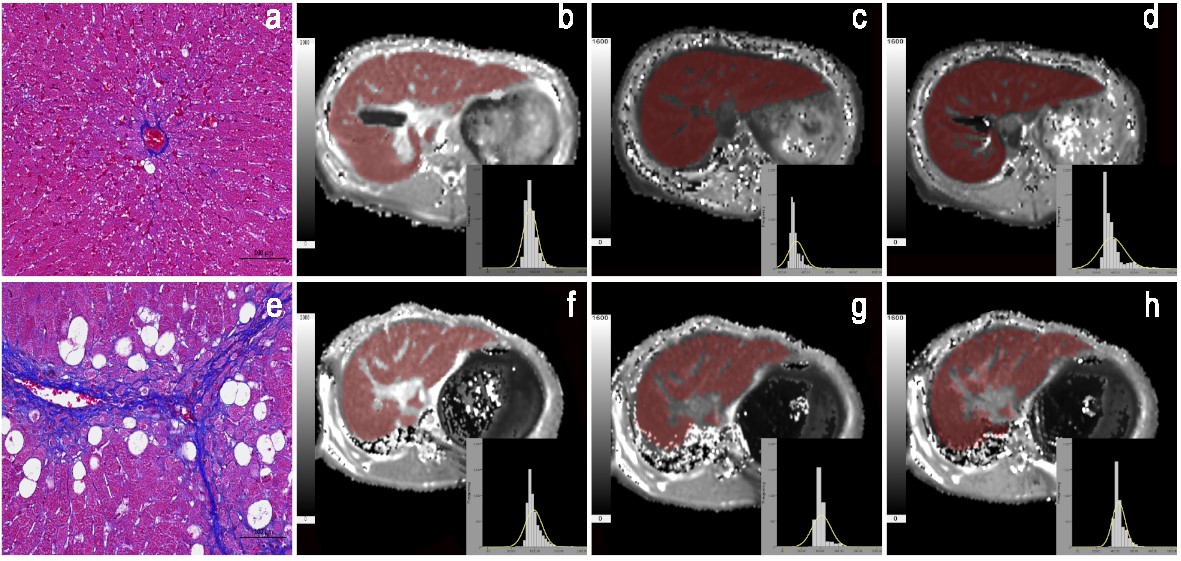
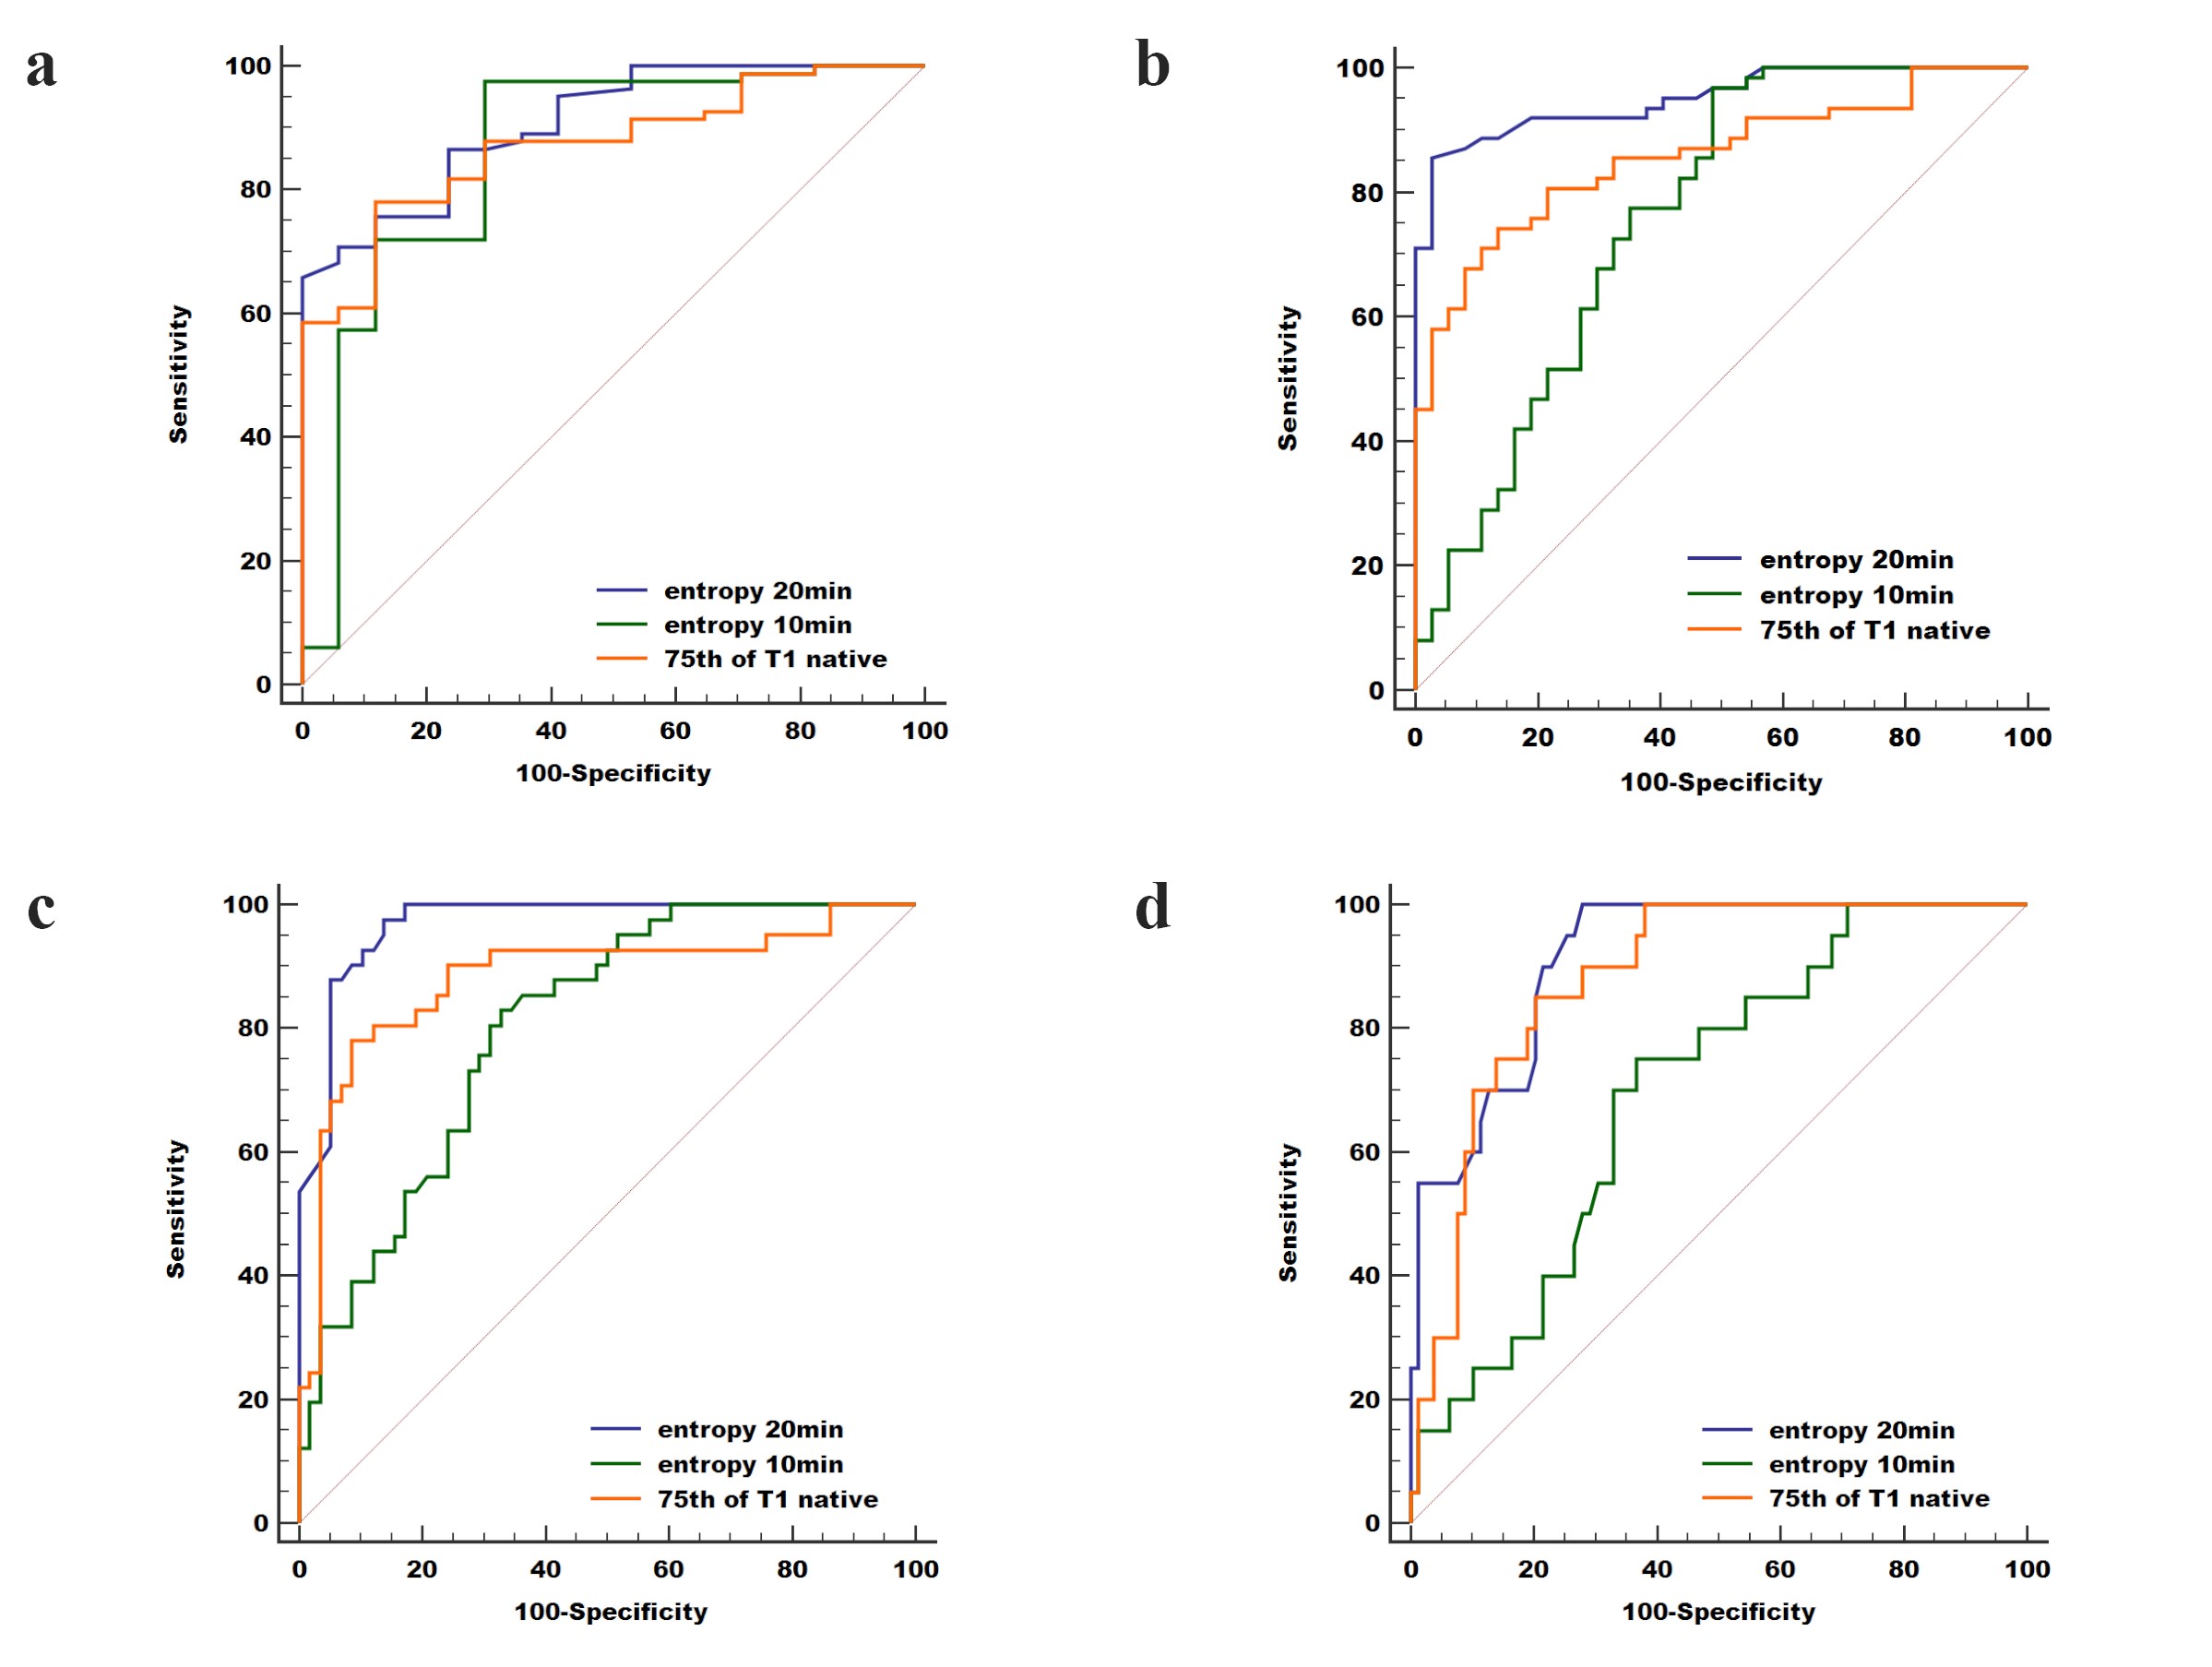
Results Finally, 17, 20, 21, 21 and 20 rabbits were included for the F0, F1, F2, F3, and F4 pathological grades of fibrosis, respectively. The mean/75th of T1native, entropy10min and entropy/mean/median/10th of T120min demonstrated a significant good correlation with the LF stage (|r|=0.543-0.866, all P<0.05). 75th of T1native, entropy10min, and entropy20min were the three most reliable imaging markers in reflecting the stage of LF. Two representative cases with LF=1 and LF=3 for the comparison of T1native, T110min and T120min are shown in Fig. 2. The area under the ROC curve of entropy20min (AUC=0.908, 0.951, 0.969, 0.914, respectively) was larger than that of entropy10min (0.859, 0.760, 0.802, 0.699,P<0.05 for LF ≥F2, ≥F3, and ≥F4) and the 75th of T1native (0.872, 0.857, 0.883 and 0.882, P<0.05 for LF ≥F2 and ≥F3) for staging LF and ROC for three optimal parameters (75th for T1native, entropy20min and entropy10min) are shown in Fig. 3.Discussion
Discussion The focus of our histogram analysis was to compare the diagnostic performance of precontrast T1 mapping, 10 min HBP T1 mapping and 20 min HBP T1 mapping in diagnosing and staging LF and identify factors associated with the LF stage, using histopathological results as the reference standard. Our result showed that entropy20min, which reflects irregularity of the value distribution, was the most valuable parameter in differentiating LF ≥F2 and LF ≥F3. Thus, we conclud that Gd-EOB-DTPA T1 mapping, especially 20 HBP T1 mapping, is a promising way to determine the LF stage.Our histogram analysis derived results indicated that optimal parameter were relatively higher than those obtained with our mean and conventional T1 values obtained by Cassinotto et al and Ding et al(4,12). It may be because that mean was influenced by outliers and advantage of histogram analysis of ROI(13). 75th of T1native showed good diagnostic performance demonstrated that 25% maximum values may represent high T1 values from vessel/bile duct and artifacts that were incorrectly included in ROIs because of the limitations of manual ROI placement. Entropy20min is the optimal parameter which may be probably explained that liver fibrosis tissue showed more heterogeneous due to the varying expression of Oatps and Mrps and abnormal liver function within different liver tissue region(5,14). T120min values both did better than corresponding same parameters of T1native and T110min. This can be well further validated that HBP T1 mapping, especially for 20min HBP, may be a more promising way describing the complexity of LF.
Conclusion
Conclusion Magnetic resonance histogram analysis of T1 maps, particularly the entropy derived from 20-min HBP T1 mapping, is promising for predicting the LF stage.Acknowledgements
The scientific guarantor of this publication is Wei Xing. This work was supported by the National Natural Science Foundation of China (NSFC81771798), Natural Science Foundation of Jiangsu Province (BK20180185) & Youth Project of Changzhou City Health Commission (QN202022). All authors declare that they have no conflict of interest.References
Reference
1. Baglieri J, Brenner D, Kisseleva T. The Role of Fibrosis and Liver-Associated Fibroblasts in the Pathogenesis of Hepatocellular Carcinoma. Int J Mol Sci. 2019;20(7):1723. doi: 10.3390/ijms20071723. 2. Campana L, Iredale J. Regression of Liver Fibrosis. Semin Liver Dis. 2017;37(01):001–010. doi: 10.1055/s-0036-1597816.
3. Ebrahimi H, Naderian M, Sohrabpour AA. New Concepts on Reversibility and Targeting of Liver Fibrosis; A Review Article. Middle East J Dig Dis. 2018;10(3):133–148. doi: 10.15171/mejdd.2018.103.
4. Ding Y, Rao S-X, Meng T, Chen C, Li R, Zeng M-S. Usefulness of T1 mapping on Gd-EOB-DTPA-enhanced MR imaging in assessment of non-alcoholic fatty liver disease. Eur Radiol. 2014;24(4):959–966. doi: 10.1007/s00330-014-3096-y.
5. Sheng RF, Wang HQ, Yang L, et al. Assessment of liver fibrosis using T1 mapping on Gd-EOB-DTPA-enhanced magnetic resonance. Dig Liver Dis. 2017;49(7):789–795. doi: 10.1016/j.dld.2017.02.006.
6. Pan S, Wang X-Q, Guo Q-Y. Quantitative assessment of hepatic fibrosis in chronic hepatitis B and C: T1 mapping on Gd-EOB-DTPA-enhanced liver magnetic resonance imaging. World J Gastroenterol. 2018;24(18):2024–2035. doi: 10.3748/wjg.v24.i18.2024.
7. Luetkens et al_2018_Quantification of Liver Fibrosis at T1 and T2 Mapping with Extracellular Volume.pdf. .
8. Varghese BA, Cen SY, Hwang DH, Duddalwar VA. Texture Analysis of Imaging: What Radiologists Need to Know. Am J Roentgenol. 2019;212(3):520–528. doi: 10.2214/AJR.18.20624.
9. Baessler B, Luecke C, Lurz J, et al. Cardiac MRI Texture Analysis of T1 and T2 Maps in Patients with Infarctlike Acute Myocarditis. Radiology. 2018;289(2):357–365. doi: 10.1148/radiol.2018180411.
10. Bektas CT, Kocak B, Yardimci AH, et al. Clear Cell Renal Cell Carcinoma: Machine Learning-Based Quantitative Computed Tomography Texture Analysis for Prediction of Fuhrman Nuclear Grade. Eur Radiol. 2019;29(3):1153–1163. doi: 10.1007/s00330-018-5698-2.
11. Chitalia RD, Kontos D. Role of texture analysis in breast MRI as a cancer biomarker: A review. J Magn Reson Imaging JMRI. 2019;49(4):927–938. doi: 10.1002/jmri.26556.
12. Cassinotto C, Feldis M, Vergniol J, et al. MR relaxometry in chronic liver diseases: Comparison of T1 mapping, T2 mapping, and diffusion-weighted imaging for assessing cirrhosis diagnosis and severity. Eur J Radiol. 2015;84(8):1459–1465. doi: 10.1016/j.ejrad.2015.05.019.
13.Zheng Y, Xu Y, Liu Z, et al. Whole‐Liver Apparent Diffusion Coefficient Histogram Analysis for the Diagnosis and Staging of Liver Fibrosis. J Magn Reson Imaging. 2020;51(6):1745–1754. doi: 10.1002/jmri.26987.
14. Tsuda N, Matsui O. Cirrhotic Rat Liver: Reference to Transporter Activity and Morphologic Changes in Bile Canaliculi—Gadoxetic Acid–enhanced MR Imaging. Radiology. 2010;256(3):767–773. doi: 10.1148/radiol.10092065.
Figures