1877
Performance of Radial Dual-Echo Inversion Recovery SPGR T1 mapping in comparison to SMART1 and MOLLI for the Evaluation of Liver Parenchyma.1Department of Radiology, Stanford University, Palo Alto, CA, United States, 2Department of Radiology and Electrical Engineering, Stanford University, Palo Alto, CA, United States, 3Stanford University, Palo Alto, CA, United States
Synopsis
Radial Dual-Echo Inversion Recovery SPGR T1 mapping is a technique that yields water and fat separated parametric maps for the evaluation of T1 values in the liver parenchyma. This novel method can serve as an alternative to SMART1 and MOLLI mapping techniques. From a cohort of 56 patients, we show the rIR-T1 outperforms MOLLI in the differentiation of patients with cirrhosis. We also show that the technique may be advantageous in the evaluation of patients with hepatic steatosis because of the ability to create composite and water-only images that yield T1 values that can better correlate to liver fibrosis.
INTRODUCTION
T1 mapping is a promising quantitative biomarker for differentiating stages of liver fibrosis1. Commercially available techniques such as the Modified Look-Locker sequence (MOLLI) and saturation method using adaptive recovery time (SMART1) are time consuming and use Cartesian sampling which is prone to motion artifact. MOLLI and similar sequences yield an apparent T1 value due to using a balanced steady-state readout, which underestimates the true T12. Estimated T1 values can be further confounded by the presence of intrahepatic fat or iron3. Here we compare a radial dual-echo inversion recovery (IR) Spoiled Gradient Echo technique4 (rIR-T1) with MOLLI and SMART1 in the evaluation of liver parenchyma. The radial sampling pattern is time efficient - allowing multi-slice acquisitions in a single breath hold, and motion robust. The dual echo technique allows reconstruction of water-only images, which may help mitigate the T1 effects of hepatic steatosis. We hypothesize that it can be used to differentiate patients with and without cirrhosis.METHODS
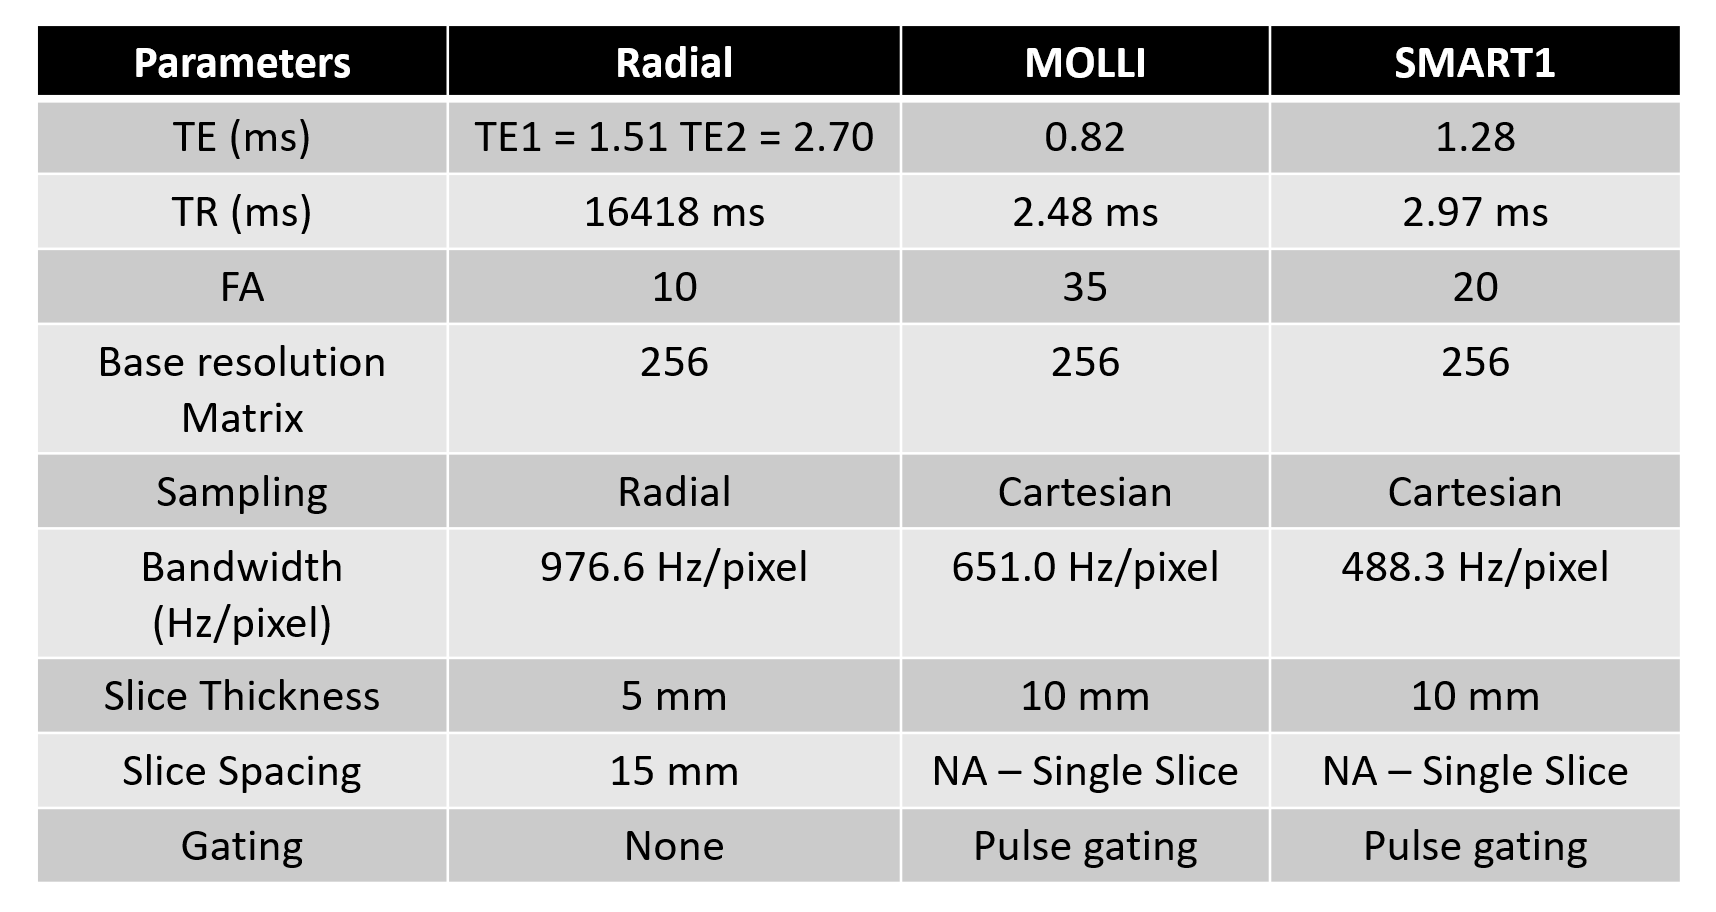
This IRB approved prospective study evaluated patients undergoing liver MRI on one of six 3T MRI scanners (GE Healthcare, Waukesha WI). Informed consent was obtained. Breath held T1 maps from rIR-T1, Fast Imaging Employing Steady-state Acquisition (FIESTA)-based MOLLI, and SMART1 pulse sequences were acquired (Figure 1). Multiparametric radial composite (RADc) and water (RADw) T1 maps were reconstructed. ROIs in T1 maps were drawn by two readers in consensus in the right lobe of the liver away from vessels, the hepatic capsule, artifact, treatment zones, and hepatic lesions. IDEAL proton density fat fraction (PDFF) and R2* maps were obtained and ROIs drawn in the right hepatic lobe. The presence or absence of cirrhosis was determined by chart review and imaging features.T1 values were compared using one-way ANOVA, and if significant, with post-hoc Tukey’s test. Pearson’s correlation coefficients (r) were used to compare T1 values between techniques, and PDFF versus measured T1 shift between RADc and RADw. T1 values between patients with and without cirrhosis were compared using Wilcoxon rank sum test. Correlation coefficients were scored with r < 0.30 interpreted as no correlation, 0.30-0.59 as mild correlation, 0.60-0.89 as moderate correlation, and 0.90 or greater as high correlation. A p-value of < 0.05 was considered statistically significant.
RESULTS
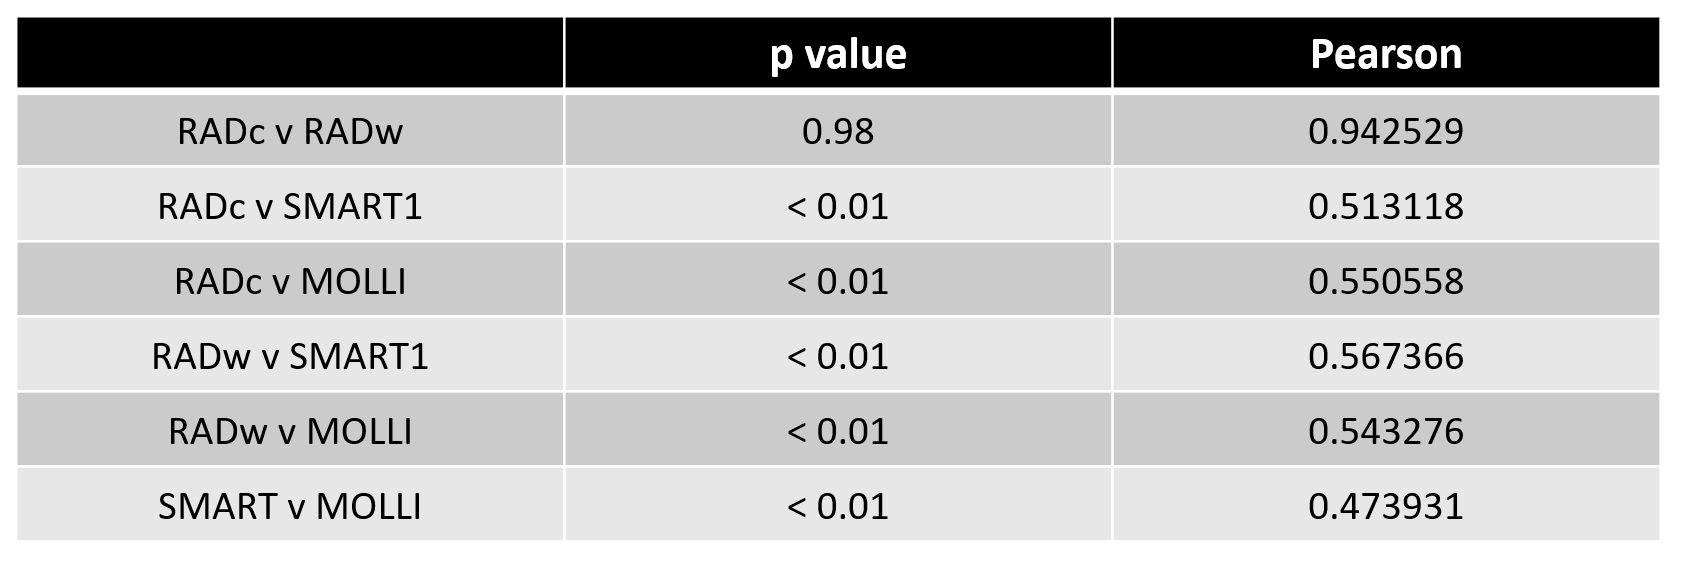
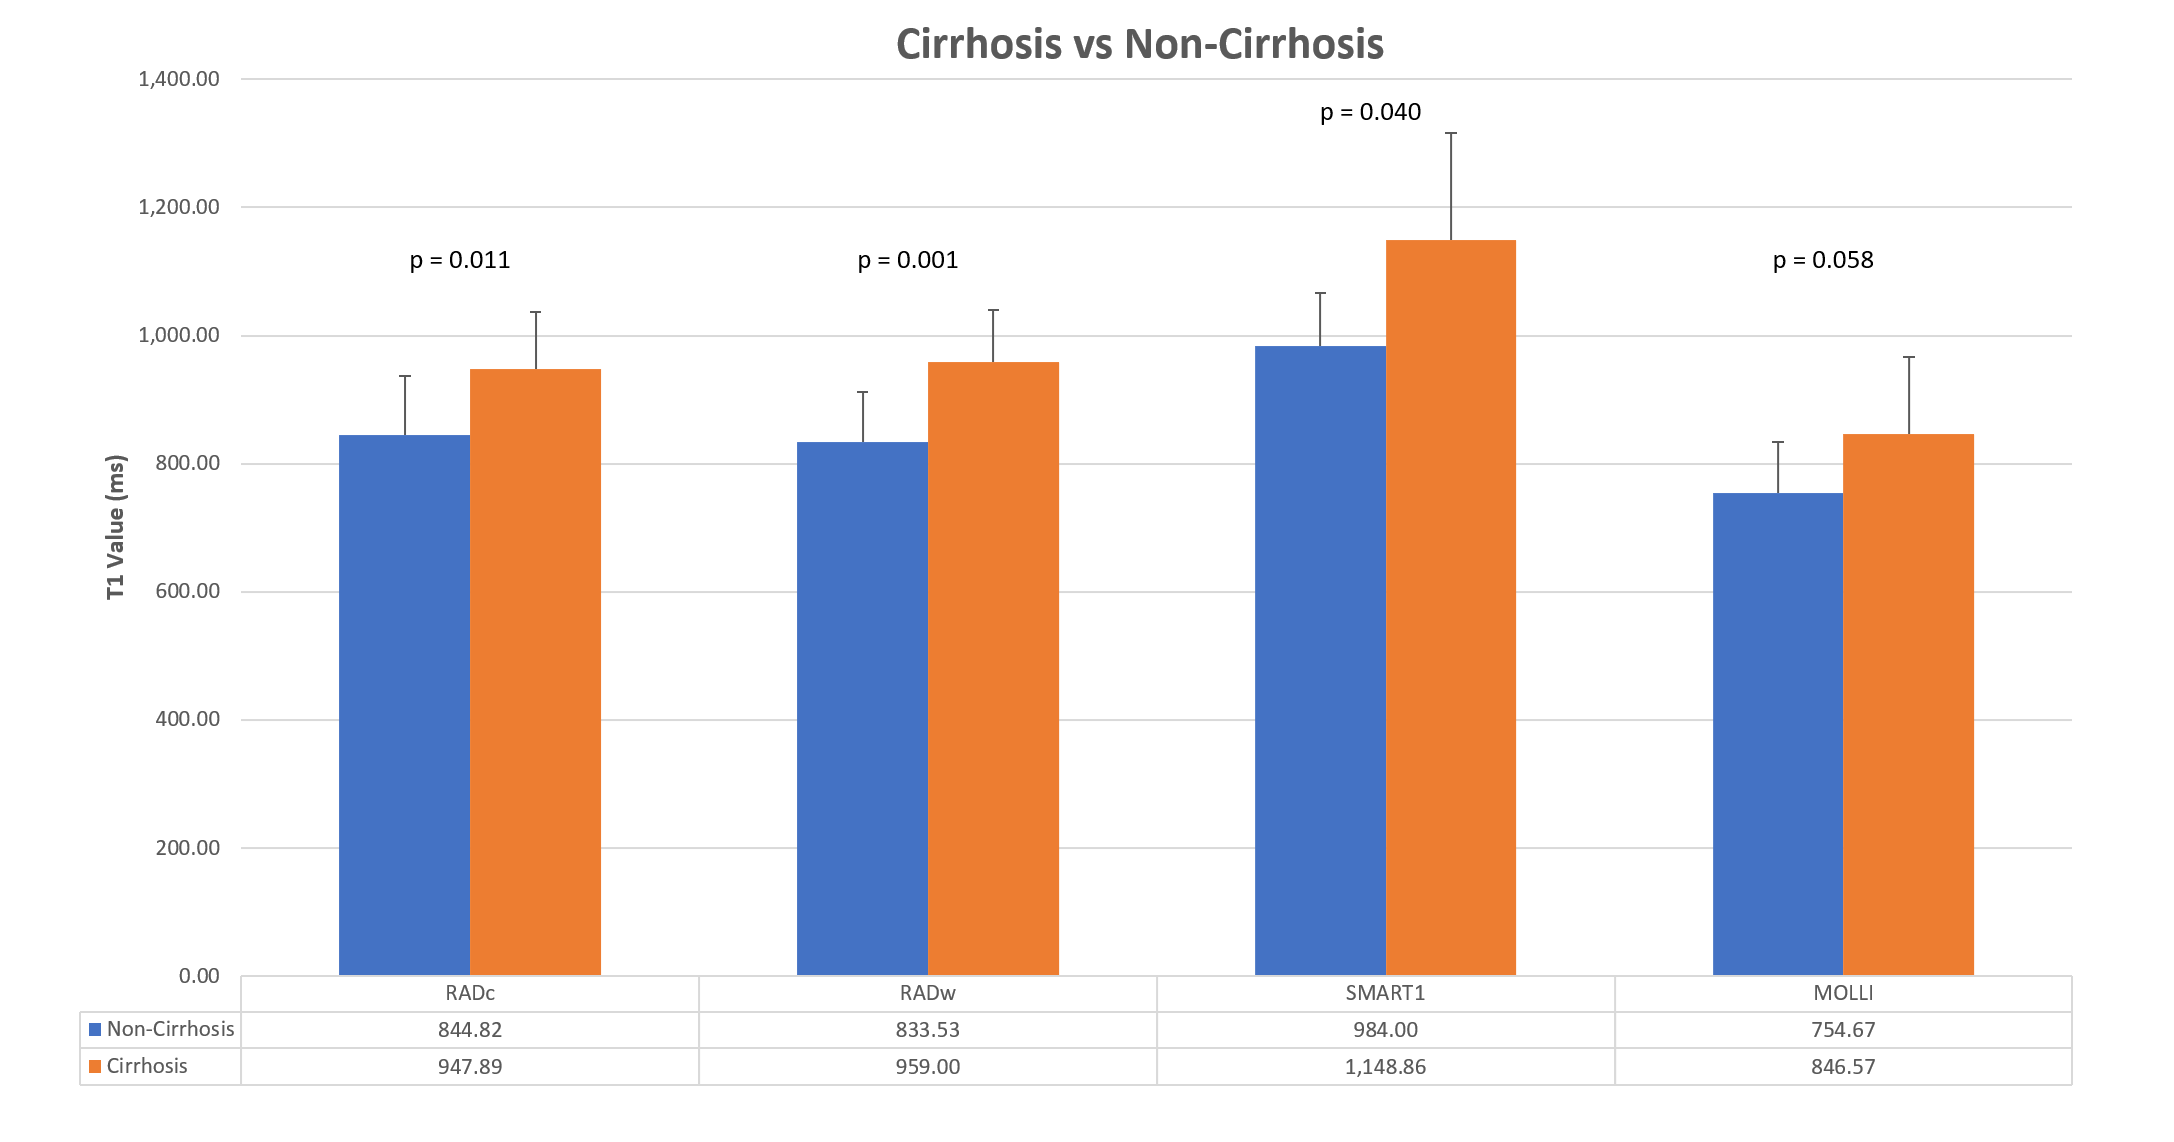
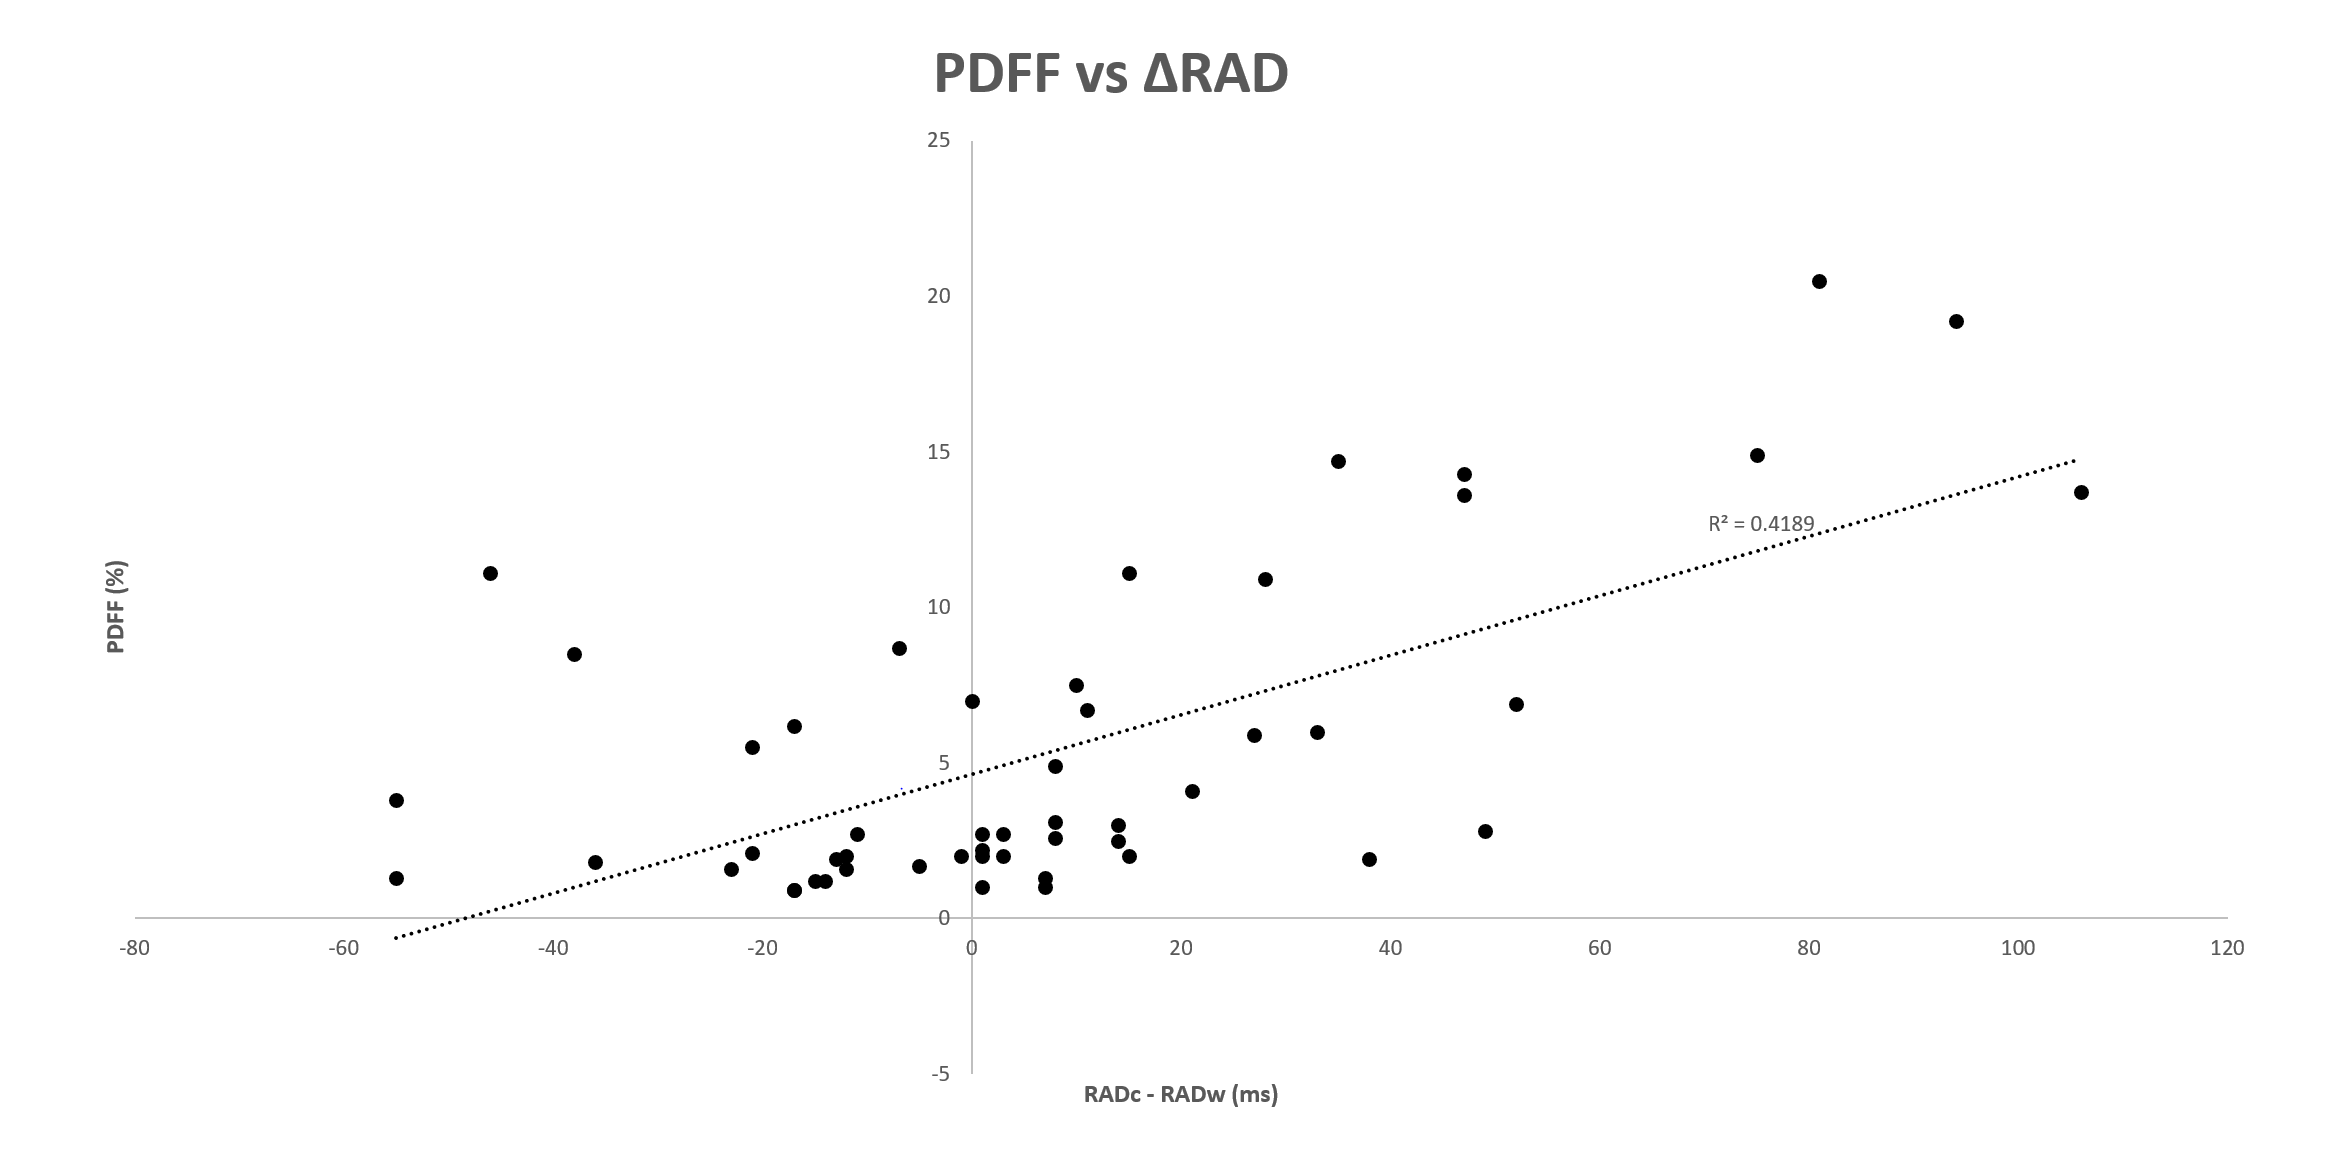
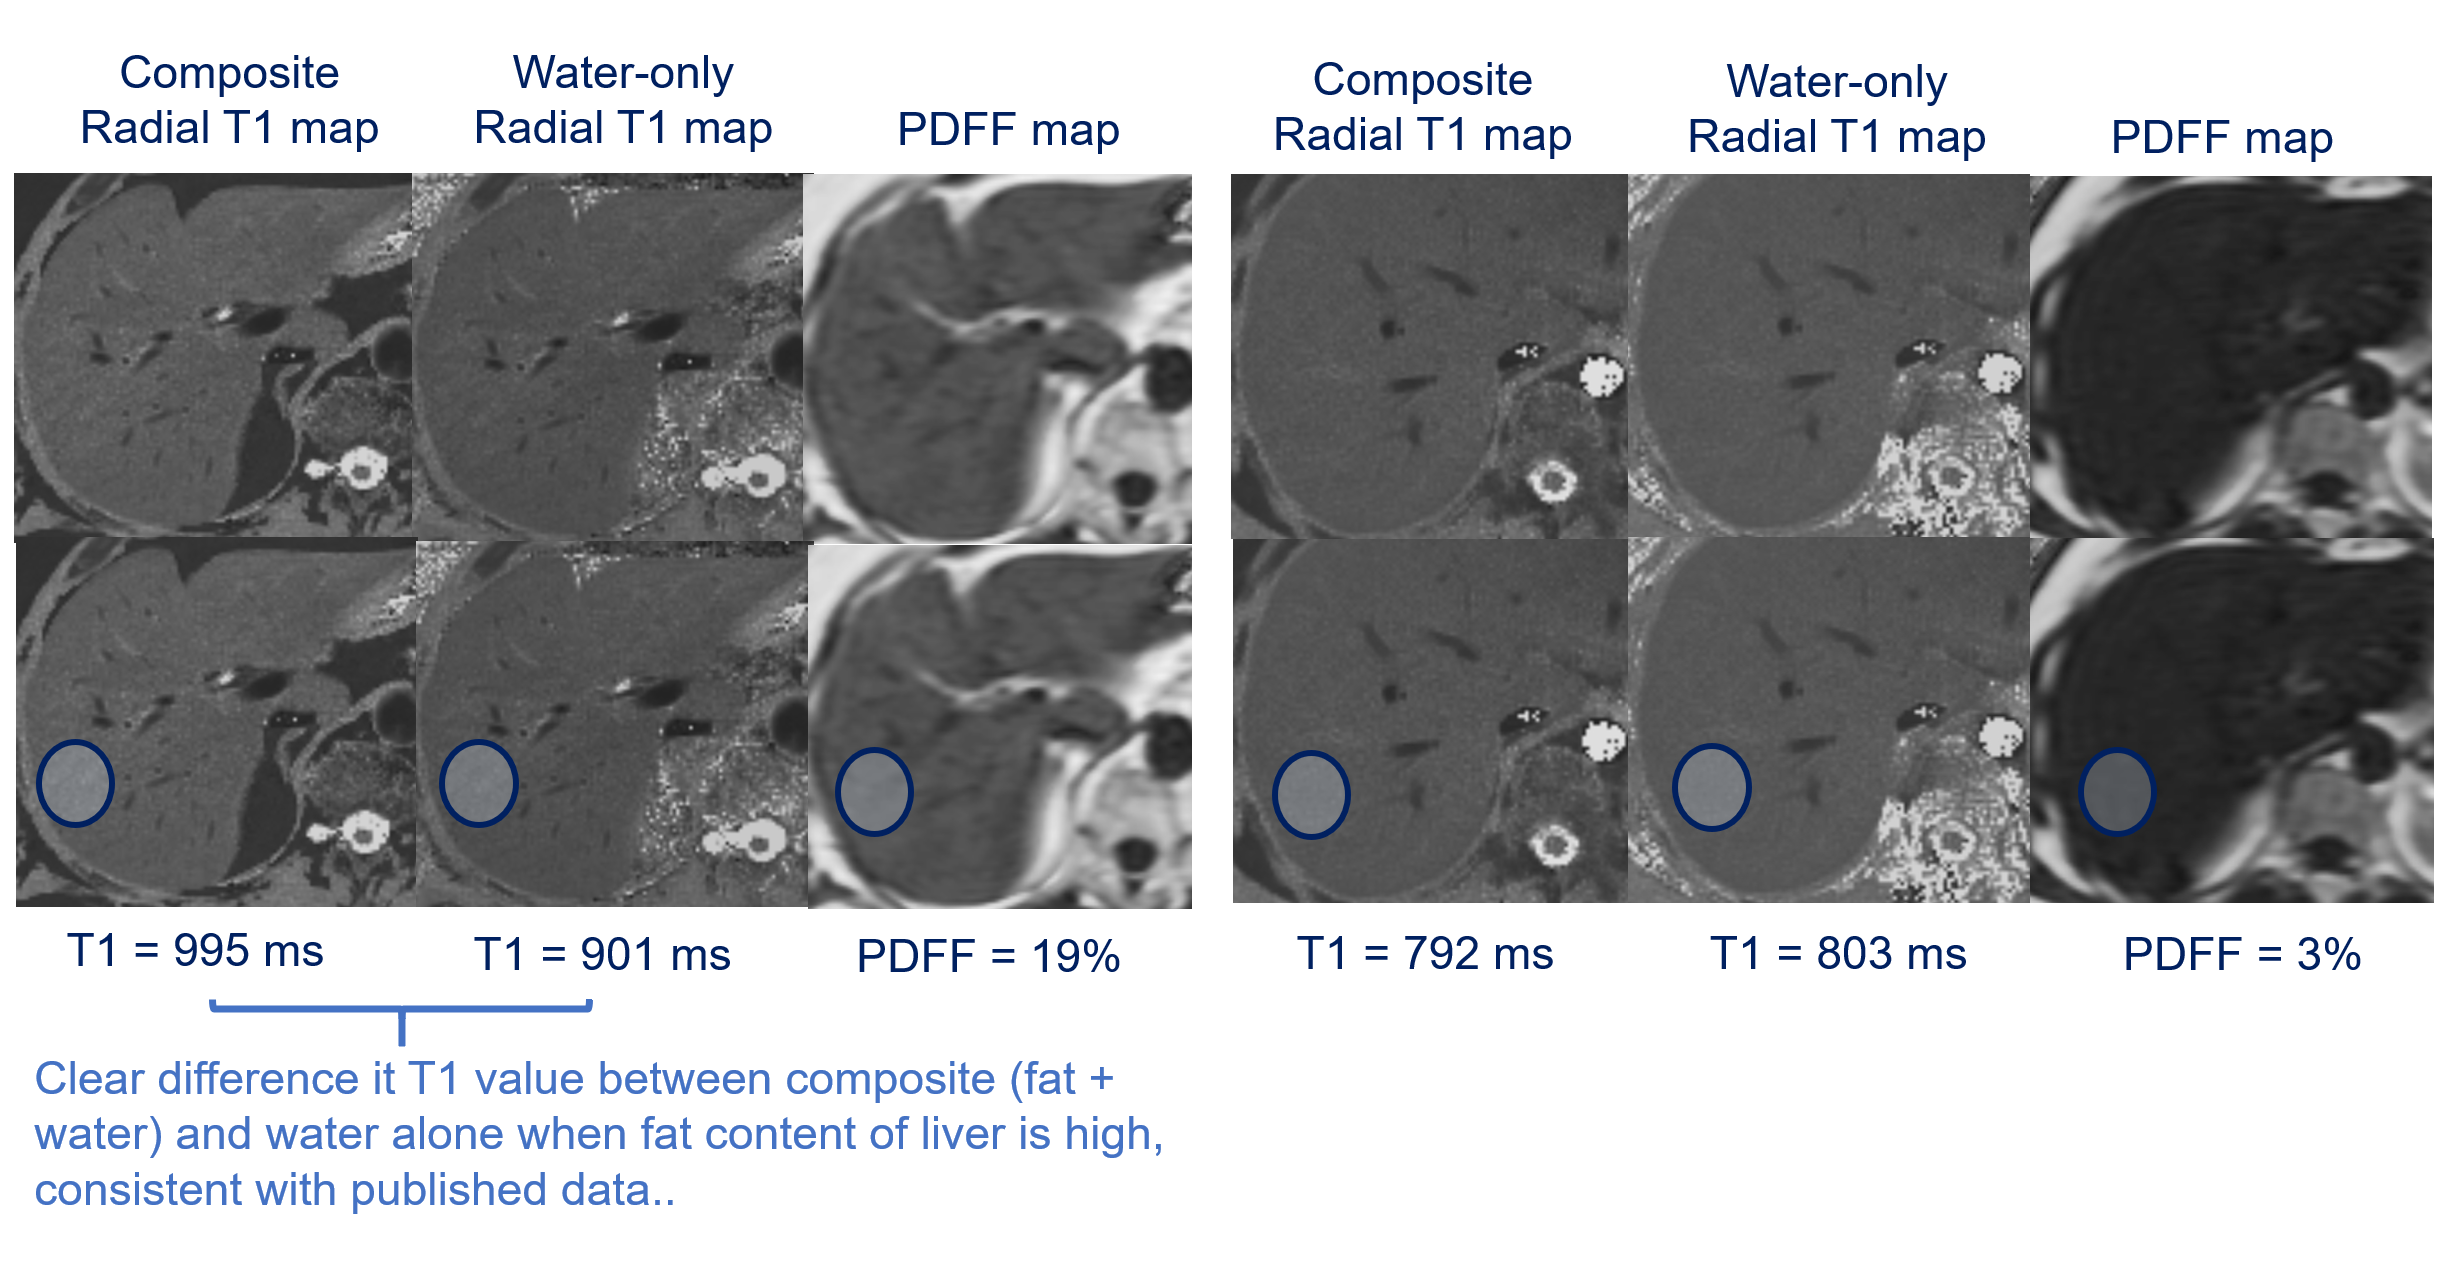
56 patients (32 female, mean age 60, mean BMI 29) were included in the study. Of these, 10 had cirrhosis. The T1 values produced by MOLLI (846.57 ms, ± 172.46) and SMART1 (1,148.86 ms, ± 67.07) were significantly different from both RADc (947.89 ms, ± 88.23) and RADw (959.00 ms, ± 81.13) (Figure 2), but all showed mild positive correlation (Figure 3). T1 values were significantly higher in patients with cirrhosis compared to those without for RADc (p=0.011), RADw (p=0.001), and SMART1 (p=0.040). MOLLI trended toward increased T1 values in patients with cirrhosis, however the difference was not significant (p=0.058). There was a moderate correlation (r=0.65) between PDFF and the measured T1 shift between RADc and RADw (Figure 4 and 5).DISCUSSION
We showed that hepatic parenchymal T1 estimates differ between MOLLI, SMART1, and rIR-T1. The T1 values obtained by the rIR-T1 were significantly higher than those obtained with MOLLI, which is known to underestimate true T1 values2. However, both rIR-T1 and MOLLI were still significantly lower than those obtained using SMART1. This suggests the rIR-T1 may more accurately reflect T1 values than a MOLLI-based approach, though perhaps still underestimate true T1 values in the liver.We also demonstrate that T1 mapping can differentiate patients with cirrhosis from those without , as seen previously1. Both SMART1 and rIR-T1, outperformed MOLLI, showing significantly higher T1 values in patients with cirrhosis, whereas the trend on MOLLI did not reach statistical significance.
There was a positive correlation between PDFF and the measured T1 shift between RADc and RADw, showing that fat can confound T1 values, which has been previously reported5. Thus, the ability to reconstruct water-only images may improve correlation between measured T1 values in the hepatic parenchyma and the degree of fibrosis (Figure 5).
While we did not assess it explicitly, rIR-T1 occasionally performed poorly in the left lobe, which maybe be related to cardiac motion artifact. Additionally, while rIR-T1 is inherently more motion insensitive, there were instances when respiratory motion related to suboptimal breath holding compromised image quality.
There are several limitations to this study. T1 measurements were made in consensus, and the differences in image reconstruction made blinding impossible, potentially introducing confirmation bias. Consensus reviewing also raises questions about the application of these findings in the clinical setting. The small patient number may have resulted in a type 2 error in determining whether FIESTA-MOLLI can differentiate between cirrhosis and not-cirrhosis, which run counter to prior studies3.
CONCLUSION
The radial T1 map generated by the dual echo IR SPGR sequence may be considered as an alternative technique for T1 mapping in the liver.Acknowledgements
No acknowledgement found.References
1. Li Z, Sun J, Hu X, et al. Assessment of liver fibrosis by variable flip angle T1 mapping at 3.0T. J Magn Reson Imaging JMRI. 2016;43(3):698-703. doi:10.1002/jmri.25030
2. Slavin GS, Stainsby JA. True T1 mapping with SMART1Map (saturation method using adaptive recovery times for cardiac T1 mapping): a comparison with MOLLI. J Cardiovasc Magn Reson. 2013;15(Suppl 1):P3. doi:10.1186/1532-429X-15-S1-P3
3. Mozes FE, Tunnicliffe EM, Moolla A, et al. Mapping tissue water T1 in the liver using the MOLLI T1 method in the presence of fat, iron and B0 inhomogeneity. NMR Biomed. 2019;32(2):e4030. doi:10.1002/nbm.4030
4. Li Z, Bilgin A, Johnson K, et al. Rapid high-resolution T1 mapping using a highly accelerated radial steady-state free-precession technique. J Magn Reson Imaging. 2019;49(1):239-252. doi:https://doi.org/10.1002/jmri.26170
5. Larmour S, Chow K, Kellman P, Thompson RB. Characterization of T1 bias in skeletal muscle from fat in MOLLI and SASHA pulse sequences: Quantitative fat-fraction imaging with T1 mapping. Magn Reson Med. 2017;77(1):237-249. doi:10.1002/mrm.26113
Figures