1876
T2 Quantification in Liver Iron Overload Using RF Phase Modulated Gradient Echo MRI
Ruvini Navaratna1,2, Daiki Tamada2, Gregory Simchick2, Diego Hernando1,2, and Scott B Reeder1,2,3,4,5
1Medical Physics, University of Wisconsin - Madison, Madison, WI, United States, 2Radiology, University of Wisconsin - Madison, Madison, WI, United States, 3Biomedical Engineering, University of Wisconsin - Madison, Madison, WI, United States, 4Medicine, University of Wisconsin - Madison, Madison, WI, United States, 5Emergency Medicine, University of Wisconsin - Madison, Madison, WI, United States
1Medical Physics, University of Wisconsin - Madison, Madison, WI, United States, 2Radiology, University of Wisconsin - Madison, Madison, WI, United States, 3Biomedical Engineering, University of Wisconsin - Madison, Madison, WI, United States, 4Medicine, University of Wisconsin - Madison, Madison, WI, United States, 5Emergency Medicine, University of Wisconsin - Madison, Madison, WI, United States
Synopsis
MR-based relaxation parameters such as T2 are sensitive to iron content in the liver. Unfortunately, current T2 mapping techniques often suffer from long acquisition times. A recently introduced phase-based T2 mapping technique shows promise for rapid liver T2 quantification within a single breath-hold. However, its ability to quantify short T2 in liver iron overload is unknown. In this work, we present a modified 3D phase-based T2 mapping method for quantifying short T2 values encountered in liver iron overload. Our results demonstrate preliminary feasibility of phase-based RF modulated GRE to map short T2 values rapidly and accurately.
Introduction
MR-based relaxation parameters such as T2 are increasingly used for liver iron overload assessment because of their good correlation with liver iron concentration (LIC).1–4 Unfortunately, current T2 mapping methods suffer from lengthy acquisition times. A novel phase-based T2 mapping method, in which T2 is encoded into the phase (Figure 1a) of a 3D gradient echo (GRE) signal, has emerged as a promising technique to rapidly quantify whole-liver T2 within a breath-hold.5 However, the ability of this technique to quantify short T2 levels seen in iron overload patients is unknown. Therefore, the purpose of this work is to modify the phase-based T2 mapping method for short T2 quantification.Theory
The following three modifications are proposed for phase-based short T2 quantification:- Short TR acquisition: To facilitate the buildup of coherent transverse magnetization in order to measure short T2 values, we propose the use of a TR on the order of the shortest expected iron overload T2, about 3-5ms at 3T (St. Pierre et al1 and $$$R2(3T)\approx1.5\times R2(1.5T)$$$6).
- "Average first, fit second”: To avoid negative phase (and therefore non-physical T2 estimates) due to noise (Figure 1b), we propose that the signal phase is averaged within an ROI, then mapped to the corresponding T2 value.
-
T1-corrected reconstruction: Although previous work has demonstrated insensitivity to T1 (required
for the lookup table) at long T1,5 to minimize inaccuracies in our T2
estimate due to unknown, shorter T1, we propose a T1-corrected T2 estimation: $$\begin{equation}T2_{corrected}=T2_{PB}(\widehat{T1})\tag{1}\end{equation}$$ where: $$\begin{equation}\widehat{T1}=\underset{T1}{\operatorname{argmin}}|T2_{PB}(T1)-T2_{fit}(T1)|\tag{2}\end{equation}$$ and $$$T2_{PB}$$$
is the T2 estimated using the phase-based lookup
table, and
$$$T2_{fit}$$$
is an a priori equation relating T2 and T1 (Figure 3b).
Methods
Simulations: Bloch equation simulations of the phase-based T2 encoding method5 were performed using 1000 isochromats with flip angle = 18°, RF phase increment = $$$\pm$$$2°, TE = 0ms, and T1 = 500ms. The signal phase as a function of T2 (0-10ms) was plotted for various TRs (3, 6, 9ms) for noiseless simulations. In addition, the signal phase distributions were plotted at various T2 (10, 50ms) at TR = 10ms for simulations with added complex noise to the signal (SNR$$$\approx$$$20) to demonstrate the effects of noise on phase estimation.To validate the choice of flip angle = 18° and RF phase increment = $$$\pm$$$2° under noise and B1 inhomogeneity, 1000 isochromats were simulated with TE = 0ms, TR = 10ms, T2 = 10ms, and T1 = 500ms. T2 standard deviation and absolute T2 bias were calculated for various flip angle (5-40°) and phase increment (1-5°) combinations in simulations with noise (SNR$$$\approx$$$20) or with a B1 calibration coefficient7 of $$$\beta=1.2$$$, respectively.
Phantom Acquisition: Eleven agarose gel (2% w/v) vials with varying MnCl2 concentration (0.3 – 3.7 mM) were constructed to achieve short T2 values, nominally 3 – 30ms (Figure 3a), and short T1 values, nominally 30 – 300ms. Vials were imaged on a 3T MR system (Signa Premier, GE Healthcare, Waukesha, WI) using a standard head coil (AIR coil, 48 channel, GE Healthcare). Reference T2 and T1 values were found using a single-echo spin-echo (SE) or inversion-recovered fast spin-echo (FSE-IR) sequence, respectively. Acquisition parameters are shown in Table 1.
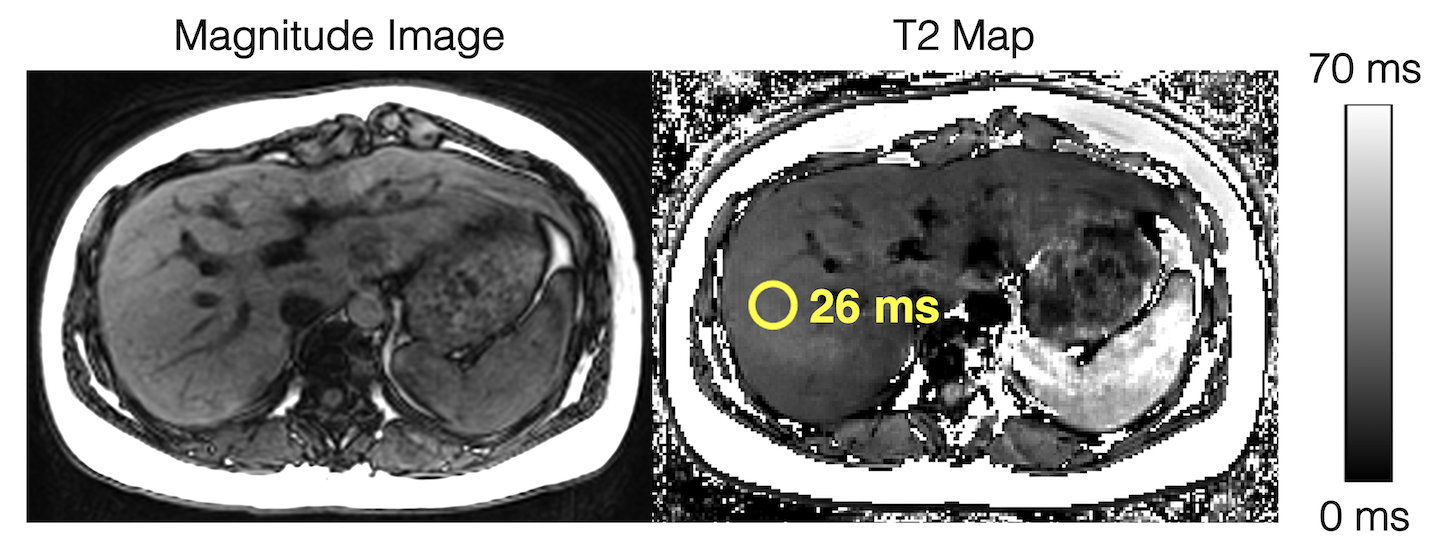
In Vivo Acquisition: One healthy volunteer participated in an in vivo feasibility study (under IRB approval with informed consent). Liver imaging was performed on a 3T MR system (Signa Premier, GE Healthcare, Waukesha, WI) using a posterior and anterior receive array coil (AIR Coil, GE Healthcare) for the abdomen. The reference T2 value in the volunteer’s liver was found using single-voxel, multi-TE STEAM-MRS8 on a 20 x 20 x 20mm3 volume. Acquisition parameters are shown in Table 1.
Reconstruction/Analysis: The phase-based T2 estimate was found by selecting an ROI, averaging the signal phase, then estimating T2 using Eqs. 1-2. $$$T2_{fit}$$$ in phantoms was found from the reference T2 vs. T1 linear regression. For the in vivo study, this is $$$T2_{fit}(ms)=0.07\cdot T1(ms)-44$$$ (from a recent iron overload prospective study9 - manuscript in preparation).
Results
Simulations: Simulations demonstrate that shorter TRs improve short T2 estimation and averaging signal phase before estimation of T2 is necessary when T2 is short (Figure 1). Optimization simulations demonstrate low T2 standard deviation due to noise and low bias due to B1 inhomogeneity using a flip angle of 18° and RF phase increment of $$$\pm$$$2° (Figure 2).Phantom Experiments: $$$T2_{fit}$$$ in phantoms was found to be $$$T2_{fit}(ms)=0.09\cdot T1(ms)+0.22$$$. Results confirm that T2 estimation is improved using the T1-corrected reconstruction (Figure 3).
In Vivo Feasibility Study: Images from the volunteer study demonstrate good agreement between the modified phase-based T2 (26ms) and reference STEAM-MRS T2 (28ms) (Figure 4).
Discussion and Conclusions
In this work, we have proposed three modifications to a phase-based T2 mapping method: the use of reduced TRs, “average first, fit second,” and a T1-corrected reconstruction. The feasibility of this modified T2 mapping method was tested using simulations, phantom experiments, and in vivo studies.In summary, this study demonstrates that the proposed modifications to the phase-based T2 mapping method has potential to quantify T2 in even the most severe iron overloaded patients within a breath-hold. Studies in patients with known or suspected iron overload are planned.
Acknowledgements
The authors wish to acknowledge support from the NIH (R01-DK100651, UL1-TR00427, R01-DK117354), as well as GE Healthcare who provides research support to the University of Wisconsin. Finally, Dr. Reeder is a Romnes Faculty Fellow, and has received an award provided by the University of Wisconsin-Madison Office of the Vice Chancellor for Research and Graduate Education with funding from the Wisconsin Alumni Research Foundation.References
-
St
Pierre TG, Clark PR, Chua-anusorn W, et al. Noninvasive measurement and imaging
of liver iron concentrations using proton magnetic resonance. Blood.
2005;105(2):855-861. doi:10.1182/blood-2004-01-0177
- Hernando D, Kramer JH, Reeder SB. Multipeak Fat-Corrected Complex R2* Relaxometry: Theory, Optimization, and Clinical Validation. Magn Reson Med. 2013;70(5):1319-1331. doi:10.1002/mrm.24593
- Reeder SB, Bice EK, Yu H, Hernando D, Pineda AR. On the Performance of T2∗ Correction Methods for Quantification of Hepatic Fat Content. Magn Reson Med. 2012;67(2):389-404. doi:10.1002/mrm.23016
- Wood JC, Enriquez C, Ghugre N, et al. MRI R2 and R2* mapping accurately estimates hepatic iron concentration in transfusion-dependent thalassemia and sickle cell disease patients. Blood. 2005;106(4):1460-1465. doi:10.1182/blood-2004-10-3982
- Wang X, Hernando D, Reeder SB. Phase-based T2 mapping with gradient echo imaging. Magn Reson Med. 2020;84(2):609-619. doi:10.1002/mrm.28138
- Hernando D, Wang C, Mattison R, Yokoo T, Reeder S. Spectroscopy-Based R2 Relaxometry for Liver Iron Quantification at 1.5T and 3.0T. In Proceedings of the Annual Meeting of ISMRM. No. 1993.; 2017.
- Roberts NT, Hinshaw LA, Colgan TJ, Ii T, Hernando D, Reeder SB. B0 and B1 inhomogeneities in the liver at 1.5 T and 3.0 T. Magn Reson Med. doi:https://doi.org/10.1002/mrm.28549
- Hamilton G, Middleton MS, Hooker JC, et al. In vivo breath-hold 1H MRS simultaneous estimation of liver proton density fat fraction, and T1 and T2 of water and fat, with a multi-TR, multi-TE sequence. J Magn Reson Imaging. 2015;42(6):1538-1543. doi:10.1002/jmri.24946
- Hernando D, Zhao R, Taviani V, et al. Repeatability and reproducibility of confounder-corrected R2* as a biomarker of liver iron concentration: interim results from a multi-center, multivendor study at 1.5T and 3T. In Proceedings of the Annual Meeting of ISMRM. No. 1020; 2019.
Figures
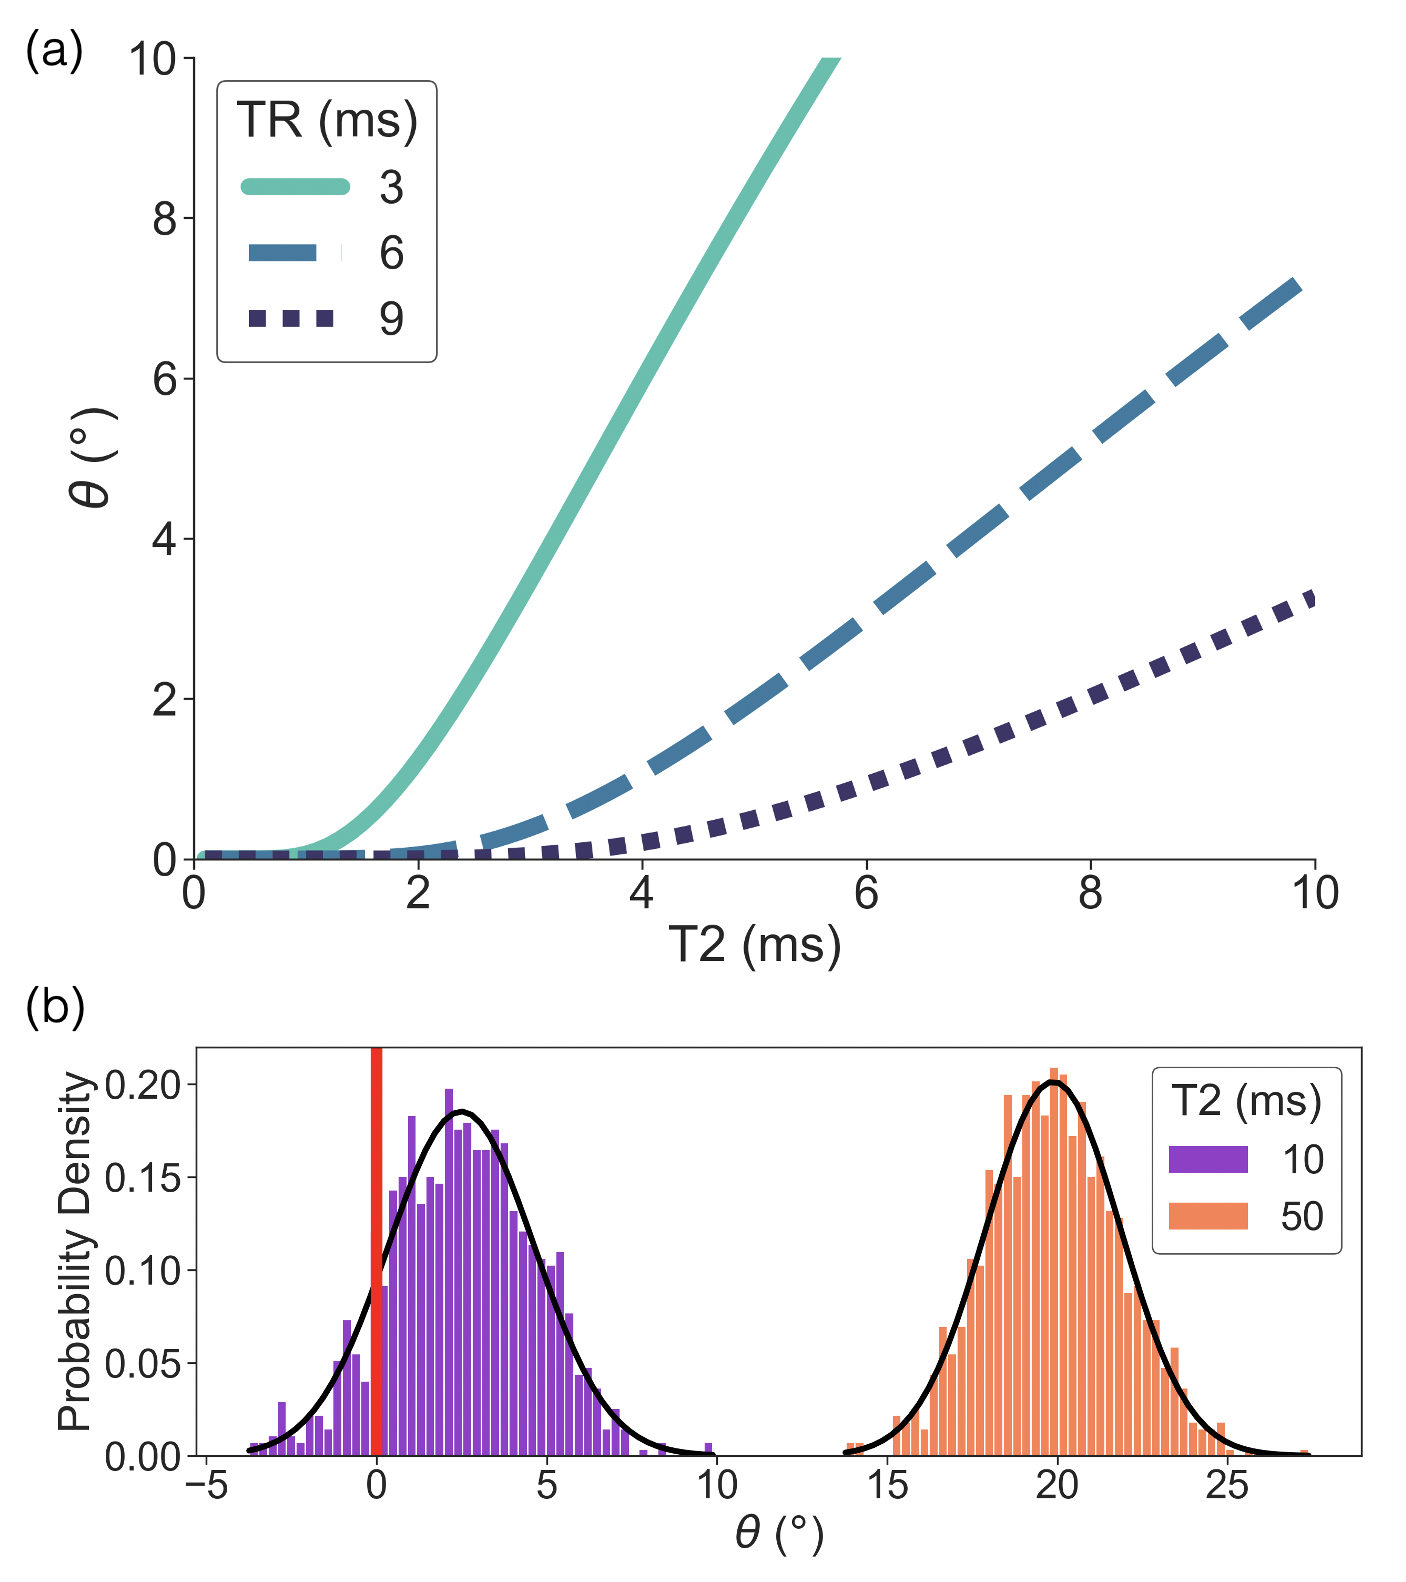
Figure
1. Simulations demonstrate the necessity of a reduced TR and the use of
“average first, fit second” to improve estimation of short T2 values. (a)
Signal phase (θ) as a function of T2 is plotted for
various TRs in noiseless simulations. The minimum T2 that produces a non-zero
phase is reduced with reduced TR. (b) The distribution of signal phase for
various T2 is plotted in simulations with added noise. The phase distribution
for T2 = 10 ms contains negative values resulting in non-physical T2 estimates
if no averaging is done.
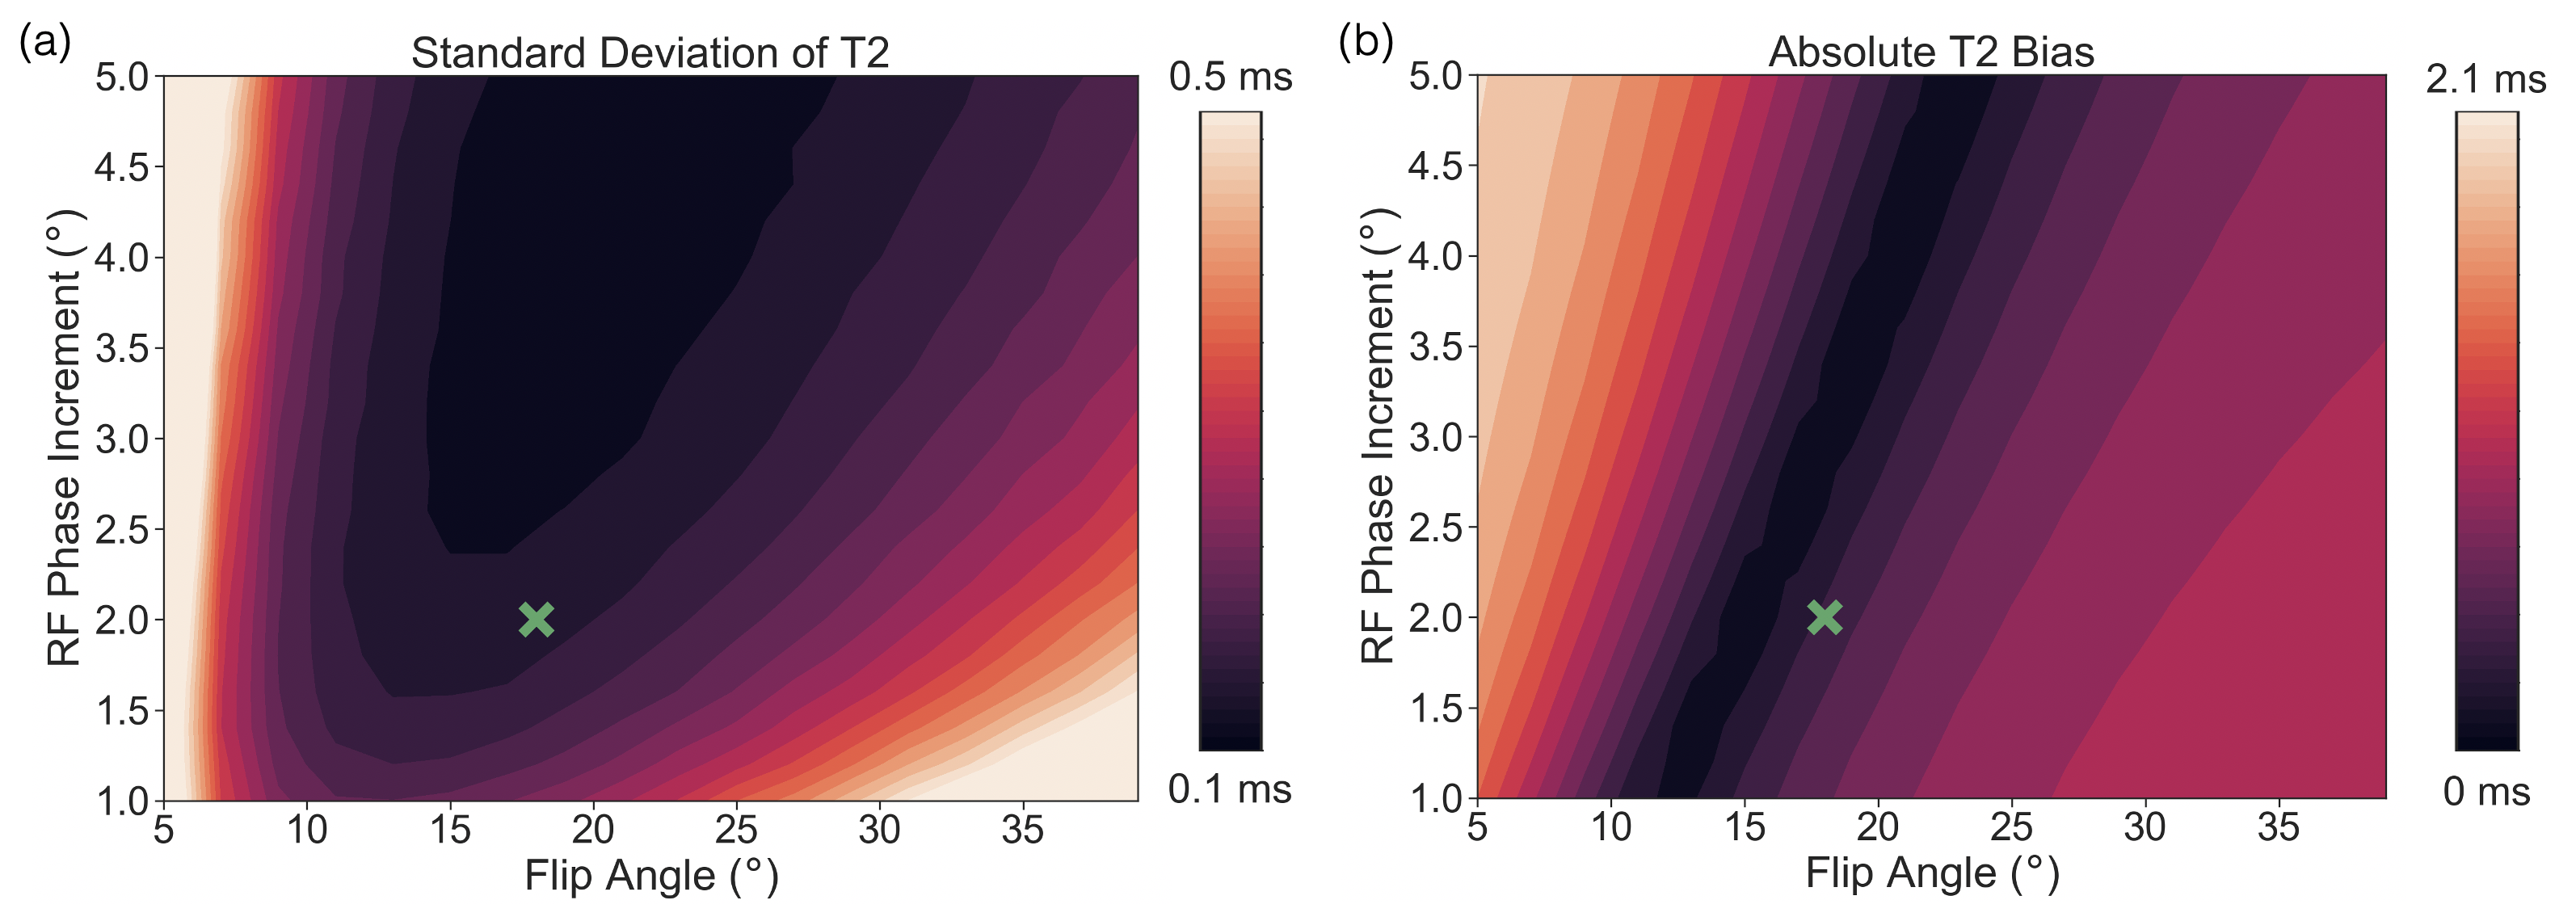
Figure
2. Simulations demonstrate good noise behavior and low bias from B1
inhomogeneity with a flip angle of 18° and RF phase increment of ±2°. (a) Standard deviation of T2 as a
function of flip angle and RF phase increment is plotted for simulations with
added noise. (b) Absolute T2 bias as a function of flip angle and RF phase
increment is plotted for noiseless simulations with a B1 calibration
coefficient of 1.2. A flip angle of 18° and RF phase increment of ±2° is marked with a green cross on each
plot.
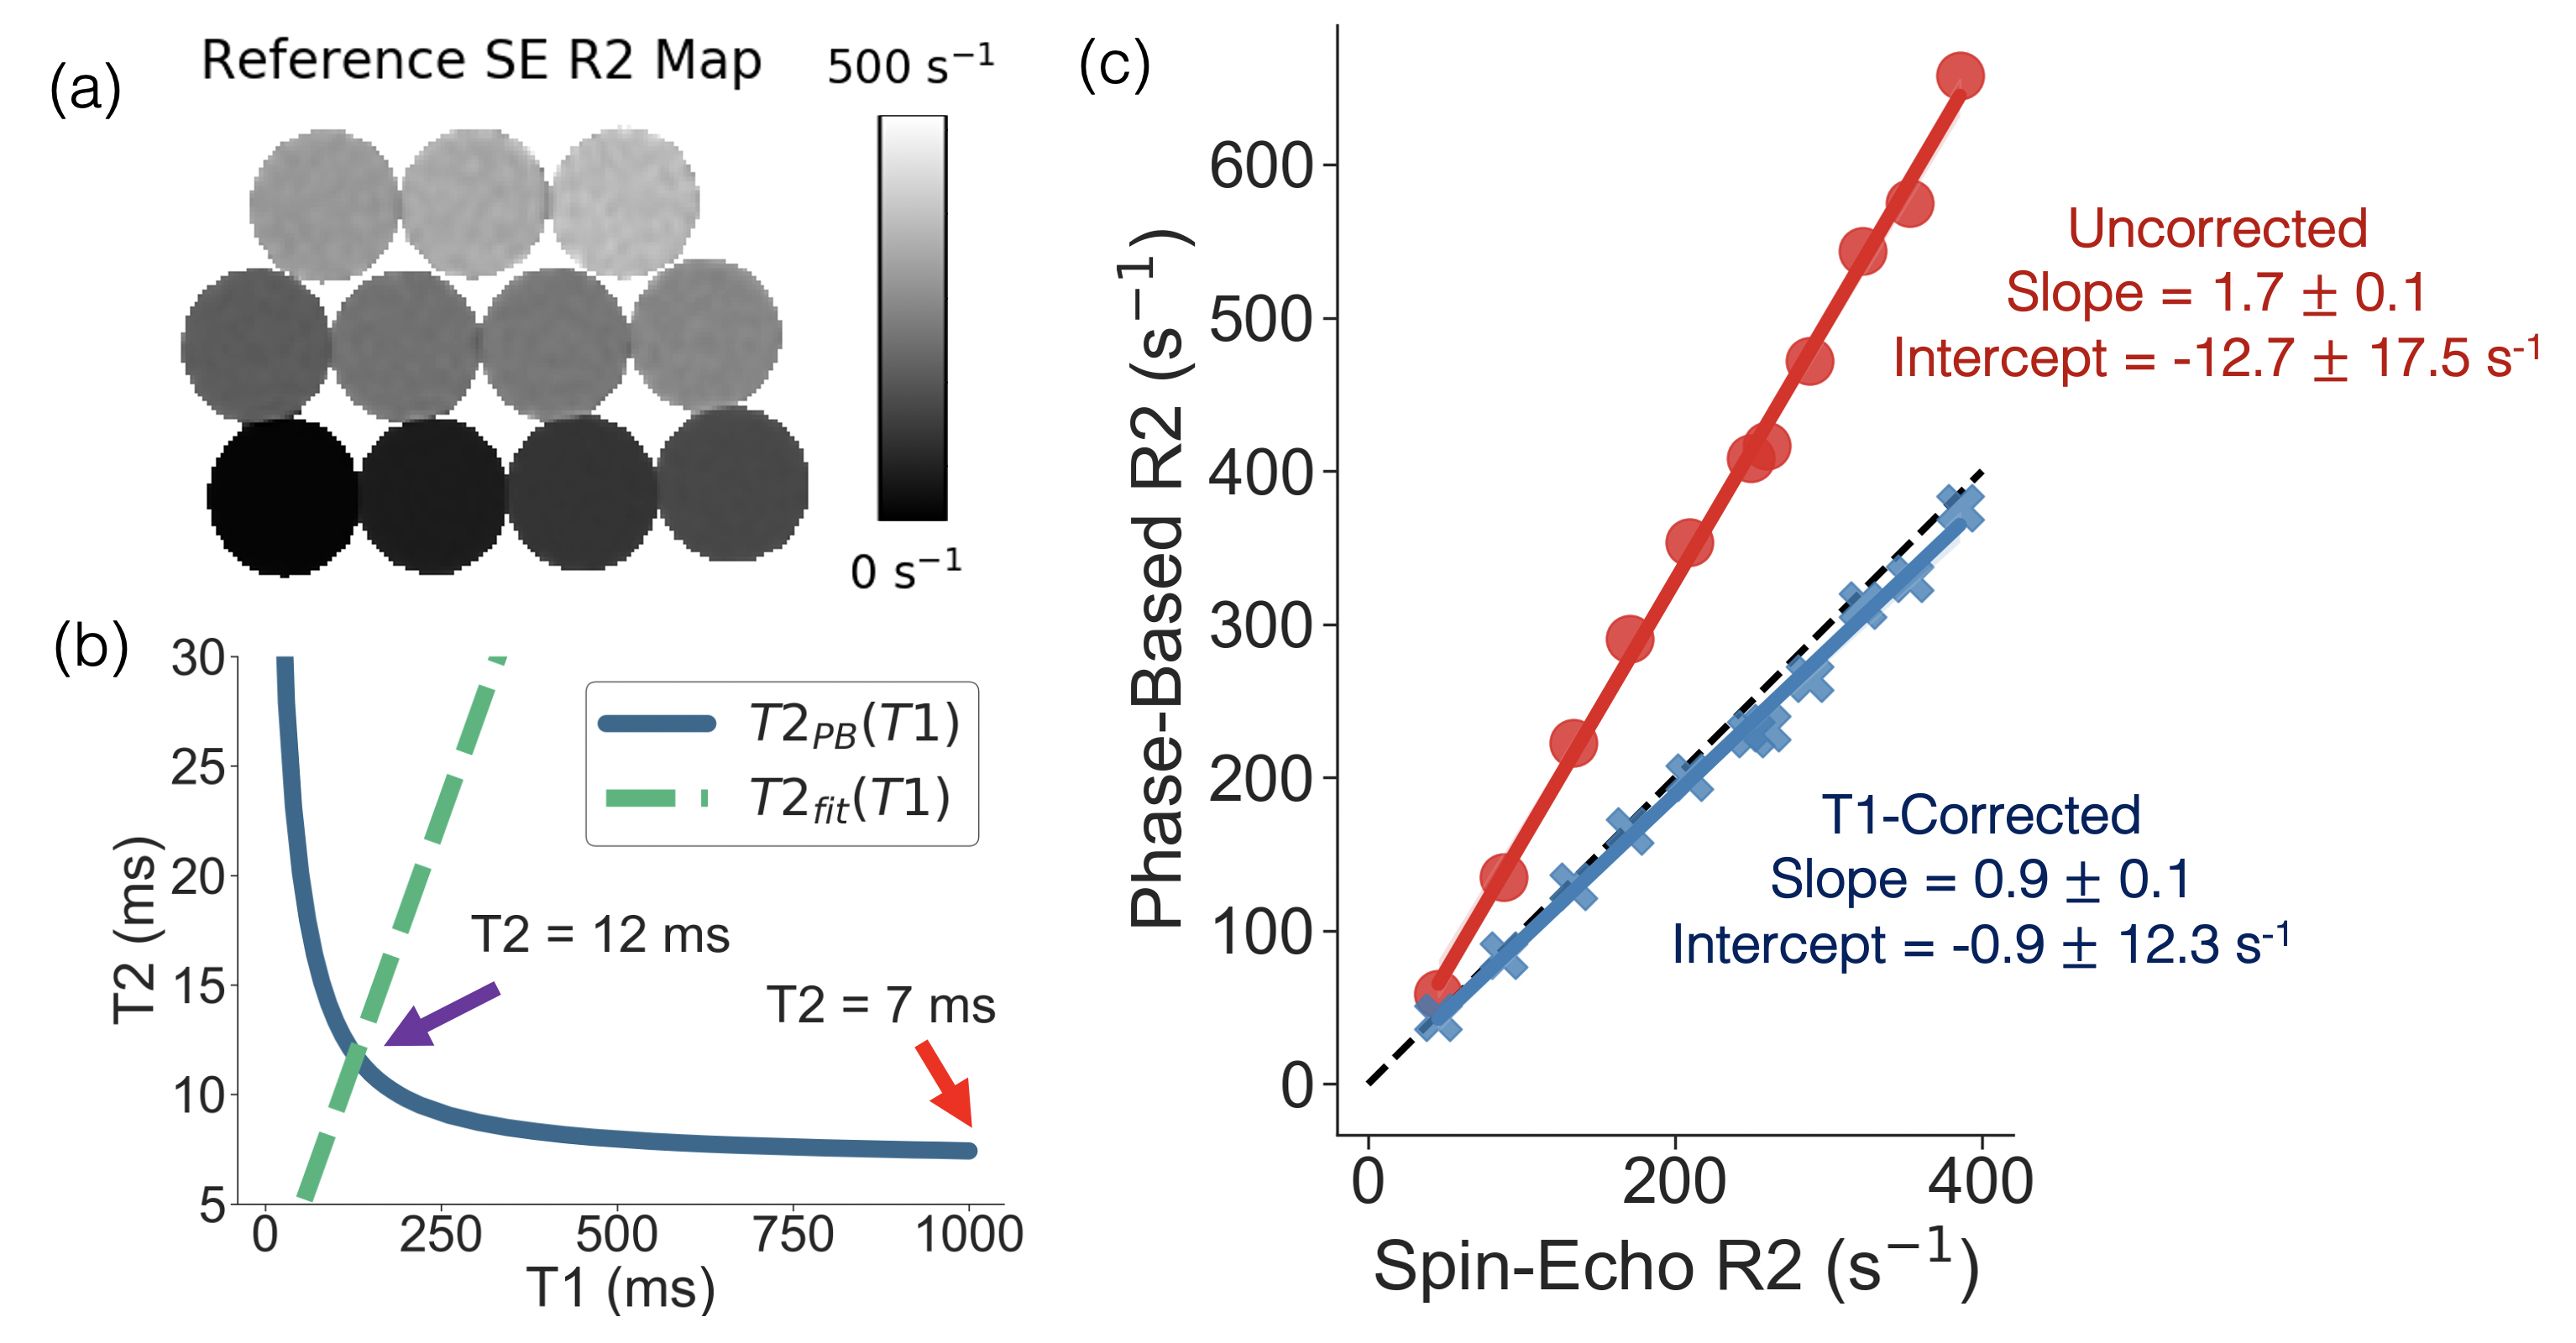
Figure
3. Phantom experiments demonstrate improved T2/R2 estimation with the
T1-corrected phase-based T2 mapping method. (a) Reference R2 map generated from
a single-echo SE sequence. (b) An example of T2PB(T1), T2fit(T1), and
the uncorrected (red arrow) and corrected (purple arrow) T2 estimate are
plotted for a single vial (reference T2 = 11ms). (c) Linear regressions of
phase-based R2 as a function of single-echo SE R2 for the uncorrected
(assuming T1 = 1000ms) and T1-corrected phase-based T2 method are shown. Slope and intercept are shown with their 95% confidence
interval.
Figure
4. In vivo feasibility studies demonstrate diagnostic image quality for T2
estimation in the liver using the modified phase-based T2 mapping method. An
ROI drawn in the liver shows a T2 estimate of 26ms. Multi-TE STEAM-MRS shows a
T2 estimate of 28ms. The phase-based T2 map is generated assuming T1 = 1000ms, while the T2 estimate in the ROI is estimated using "average first, fit second" and a T1-corrected T2 estimation.
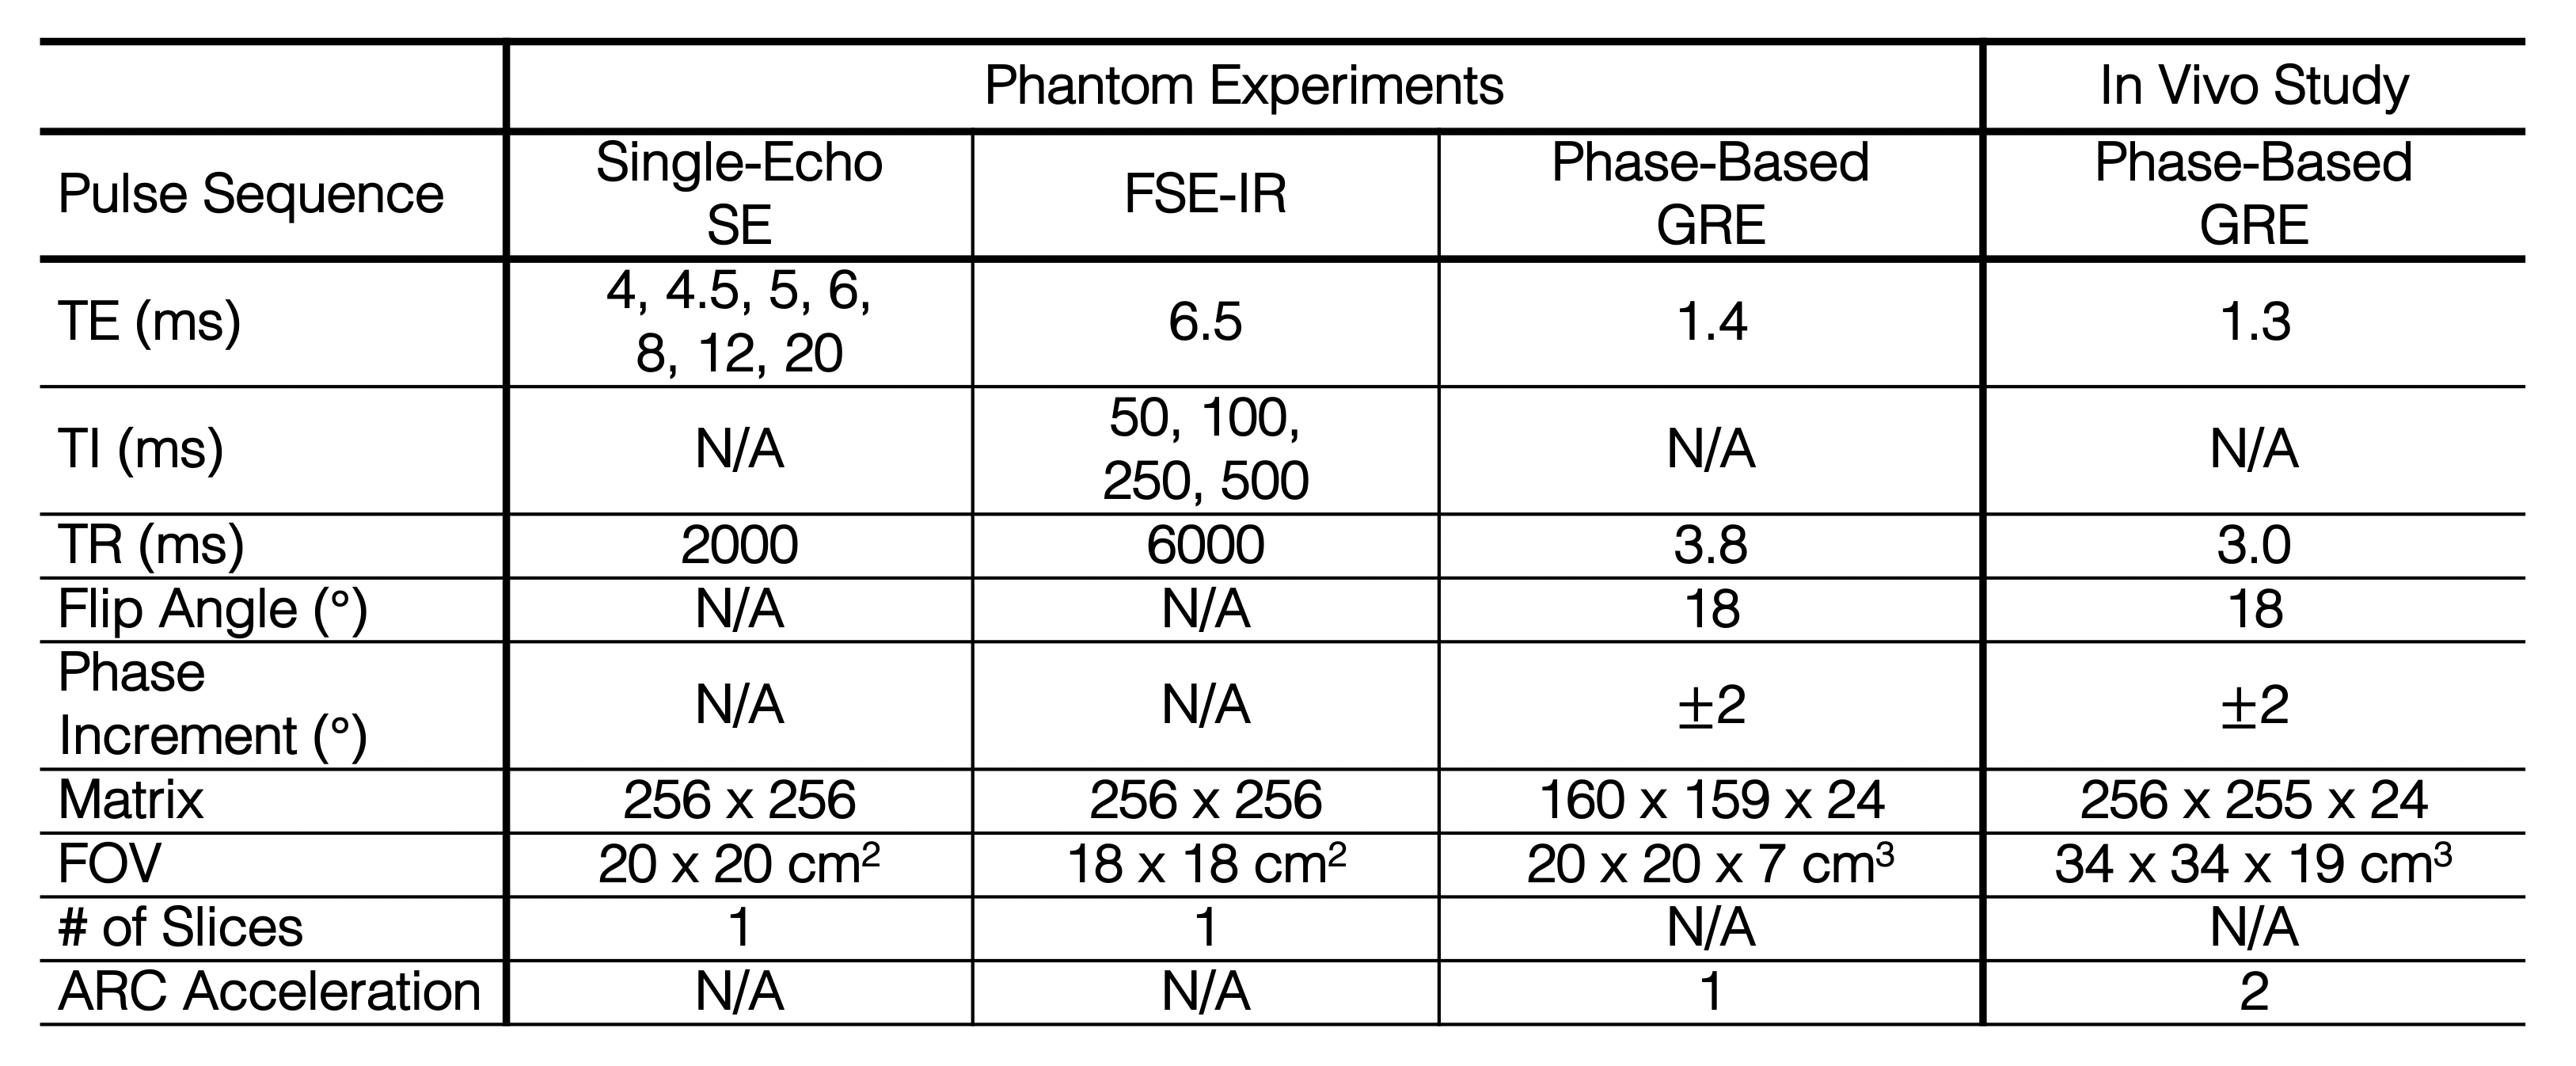
Table 1. Acquisition parameters for the
phantom experiments and in vivo study. All acquisitions were performed at 3T.