1874
R2* mapping in liver iron quantification using multi-echo ultra-short echo time MRI: a rabbit model study1Northern Jiangsu People’s Hospital, Yangzhou, China., Yangzhou, China, 2GE Healthcare,MR Research China, Beijing, China., Beijing, China
Synopsis
In this study, we aimed to investigate the feasibility of quantitative R2* mapping measured using multi-echo ultra-short echo time (multi-TE UTE) MRI for evaluating liver iron content coexisting with liver fat. Iron accumulation and fat deposition with different levels was built in rabbit liver in vivo. We found that the obtained R2* mapping measured with multi-TE UTE with fat suppression could accurate measure liver iron content at different levels without an influence from fat. With this finding, multi-TE UTE imaging can be considered a potential technique for noninvasive hepatic iron measurement.
Introduction
Accurate measurement of liver iron concentration (LIC) is important in the treatment of blood transfusion-dependent patients or other liver iron overload patients [1]. Liver biopsy was still the gold standard for iron quantification, although it might associate with sample error or possible severe complication [2].Conventionally, LIC was measured through R2*or R2 values using gradient echo based MRI sequences [3]. However, the accuracy for iron determination was usually restricted by limited echo time applied usually in mini-second range [4], especially when liver iron is overload larger than 15.0 mg/g.
Ultra-short Echo Time (UTE) MR imaging, as a relatively novel technique for high signal-to-noise ratio (SNR), can be applied with echo time (TE) within micro-second range[5]. With this feature, we assumed that multi-echo UTE imaging has the potential to accurately measure R2* values in liver with iron overloaded. Therefore, this study aimed to investigate the feasibility of R2* mapping measured by multi-TE UTE for evaluating liver iron overload with different levels and with coexisting fat in a rabbit model.
Materials and Methods
Animal modelAnimal experiments were performed under a project license (2018KY-056) granted by the institutional ethics board of local hospital, in compliance with institutional guidelines for the care and use of animals. Thirty-one male New Zealand rabbits were fed a high-fat diet with 2-8 weeks to construct different grades of fatty liver. Iron overload was induced by intravenous injection of iron dextran (100 mg Fe/mL) during a feeding at 1–2 weeks. Based on our preliminary results[6], a series of total iron injection doses of 0, 200, 800, 1200, and 2400 mg Fe were used to construct different degrees of iron overload.
MRI experiment
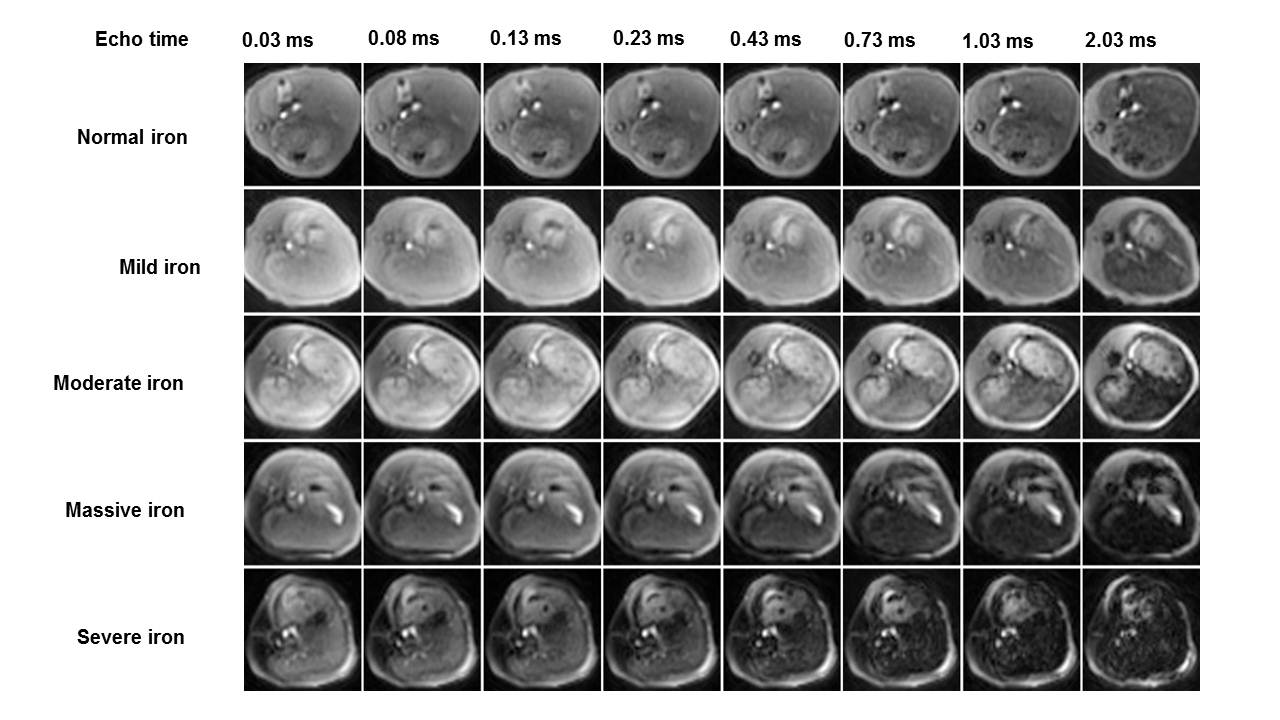
All MR examinations were performed on a clinical 3T scanner (MR750W, GE Healthcare, USA) using a 16-channel soft surface coil. UTE imaging was performed using a three-dimensional (3D) gradient echo sequence with repetition time (TR) = 63.4 ms, flip angle =15°, field of view (FOV) = 180 mm ×180 mm, pixel size =0.2 mm × 0.2 mm, slice thickness = 6 mm, no slice gap, and slice number =10. Eight TEs of 0.03, 0.08, 0.13, 0.23, 0.43, 0.73, 1.03 and 2.03ms were respectively applied in UTE imaging and scanned. Total scan time was 2 mins 24 seconds.
Data analysis
R2* mapping was processed using an in-house software implemented in Matlab (Mathworks, Natick, MA, USA). Two radiologists specializing in liver imaging traced regions of interest (ROIs) using Itk-Snap. ROIs were draw on the UTE images at first echo and copied to R2* maps. Three ROIs were drawn slice-by-slice for each rabbit. Meanwhile, ROIs were 5 mm distance away from the boundary. The obtained R2* values of ROIs were measured and expressed as mean and standard deviation. In addition, LIC was measured using an inductively coupled plasma spectrometer (ICP).
Statistical analysis
All statistical analyses were performed using SPSS software (SPSS version 19.0). Intraclass correlation coefficients (ICCs) were performed to test the inter-rater reliability for R2* measurement between two radiologists. If excellent agreement was obtained, the datasets were averaged for further analyses. The correlation between R2* and LIC was evaluated by Spearman rank correlation analysis. In order to evaluate the influence of fat on iron determination, a linear regression equation R2* value and LIC was established for the normal group or the fatty liver group, respectively. The covariance analysis was used to compare slopes of the regression equation for two groups. Receiver operating characteristic (ROC) analysis was performed in all 31 rabbits to differentiate four iron levels on the basis of prespecified LIC thresholds (1.8, 3.2, 7.0, and 15.0 mg of iron per gram of dry tissue) that are widely used in iron chelation therapy. P<0.05 was considered statistical significance.
Results
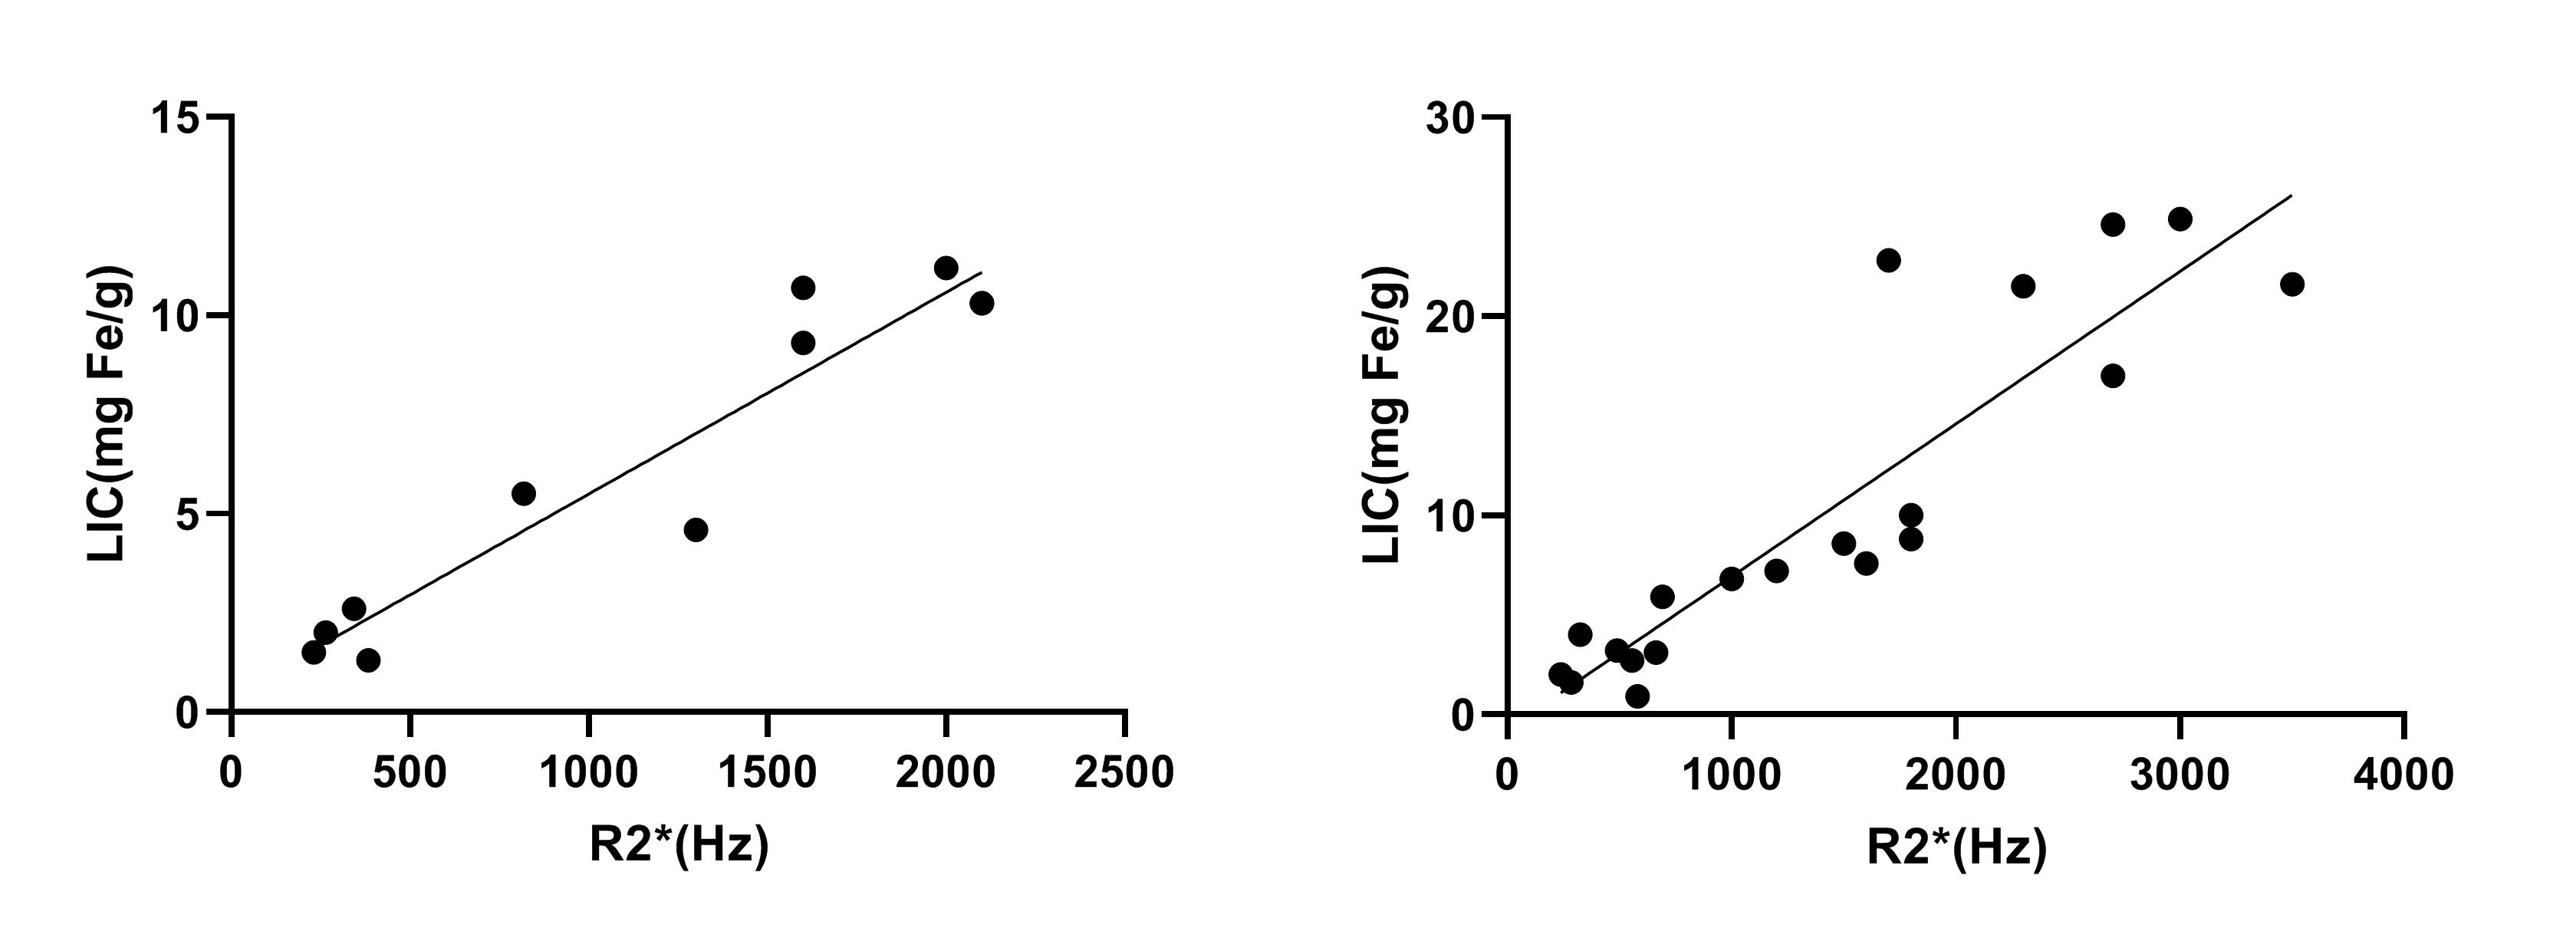
As iron levels increase, the signal intensities of liver in multi-TE UTE images decrease gradually (Figure 1).There is a strong positive correlation between R2* value and liver iron concentration. The correlation coefficient between R2* and LIC in the normal fat group and fatty liver group are ρ=0.911 and ρ=0.811, respectively (Figure 2). The analysis of covariance showed that there was no significant difference in the slope of the equation between the normal group and fatty liver group (P > 0.05), suggesting that fat has no effect on the iron quantification using fat-suppressed UTE imaging.
Using ROC analysis, for four iron levels, the corresponding optimal cutoff values of R2* were 58.32, 96.03, 150.52, and 385.13Hz, respectively, and the areas under the curve (AUC)s were separately of: 0.950, 0.945, 1.000 and 0.933.
Discussion
Our study demonstrated that multi-TE UTE derived R2* were accurately calculated even in liver with severe iron overload (LIC>15mg/g), and showed strong positive correlation with liver iron content. Additionally, with fat suppression, UTE derived R2* can quantify different degrees of liver iron overload with a potential contamination of fat.Conclusion
In conclusion, multi-TE UTE imaging has been demonstrated to accurate measure R2* value at severe iron accumulation. With this finding, UTE imaging might be useful for clinical diagnosis of grading liver iron overload to guide iron chelation therapy.Acknowledgements
Funded by the Youth Project from Department of Science and Technology of Jiangsu (BKM20160450); Top Six Talent SummitProject of Jiangsu Province Human Resources and Social Security Department (2016-WSN-277).References
1.Porter JB, Garbowski M. Hematol Oncol Clin North Am 2014;28:683-701
2.St Pierre TG, Clark PR, Chua-Anusorn W, Blood 2005;105:855-61
3.Eamon, K.D., Kristin T., Bertin,V.,et al. Magn Reson Med. 2018 ar;79(3):1579-1585.
4.Wu Q, Fu X, Zhuo Z,, et al. Quant Imaging Med Surg 2019;9(2):180-187.
5.Dou W, Mastrogiacomo S, Veltien A, NMR Biomed. 2018 Feb;31(2).
6.Luo XF, Yang Y, Yan J, Eur Radiol 2015;25:2657-64.
Figures