1873
The Effect of Hepatic Fat on T2 of water signal in single voxel multi-echo MRS and fat-suppressed radial TSE T2 mapping.1Department of Radiology, Medical University Vienna, Vienna, Austria, 2Christian Doppler Laboratory for Clinical Molecular Imaging, MOLIMA, Vienna, Austria, 3Division of Endocrinology and Metabolism, Department of Medicine III, Medical University of Vienna, Vienna, Austria
Synopsis
MRI-based T2 mapping was suggested for the grading of hepatic parenchyma inflammation. Studies using multi-echo MRS suggest the effect of hepatic fat accumulation on T2 values of the water signal. Here, we analyzed the effect of hepatic fat fraction on water T2s in phantoms and patients in vivo with MRS and T2 mapping based on fast radial turbo-spin-echo acquisition with fat saturation. While there was an effect in phantoms of low FF, in the population of patients with FF up to 15%, no significant influence could be observed.
Introduction
T2 mapping, providing useful information about pathological status of an organ, has been shown to be very sensitive for edema and hemosiderosis (1). It has also been proposed to be a marker of hepatic tissue inflammation in preclinical models, and it was suggested to differentiate inflammation from fibrosis (2). However, the role of fat accumulation in T2 mapping has not been extensively examined. Carlier proposed to differentiate “global” T2 from water T2 in fatty-infiltrated muscles (3). In the absence of fat, global T2 and water T2 are almost identical. Lipids, having a much higher T2 than water, shift overall T2 decay, and this increase is proportional to the fat-fraction (FF). Yet, the FF in the liver can be considerably high, up to 50% (4). We have shown recently that applying fat-suppression eliminates the effect of fat in T2 mapping in phantoms with FF up to ≈ 35%, and significantly reduces the observed T2 value (5).The effect of fat on water T2 signal was previously investigated by multi-echo MRS (6) (7), which is capable of separately measuring water and lipid signal and assess relaxation times individually from a limited volume of interest. A decrease in T2 of water with increasing FF was reported, which may be attributed to change of the micro-environment. To our knowledge, no such effect was reported with in-vivo MRI T2 mapping of liver.
Therefore, the goal of this study was to investigate the effect of FF on T2 values of water in a group of patients with a novel radial turbo-spin-echo sequence (rTSE) (8), which enables T2 mapping during a single breath-hold, with the elimination of fat signal using fat-suppression. A standard single-voxel multi-echo STEAM MRS sequence was used to measure T2 values of water signal for comparison.
Materials and methods
All measurements were performed on a 3T MR system (MAGNETOM Prismafit, Siemens Healthcare, Erlangen, Germany) equipped with an 18-channel body coil and a 32-channel spine coil. A prototype rTSE sequence (9) was used (TR = 1500ms, ETL = 29, TE range = 9.2 – 266ms, echo-spacing = 9.2ms, FOV 400x400mm2, matrix = 256x256, radial views = 290, FA = 180°, slice thickness = 6mm, time of acquisition = 17sec). T2 calculation was performed inline using a mono-exponential signal model and noise floor subtraction; the effect of stimulated echoes was reduced by excluding the first echo. Spectral fat suppression was used. Single voxel multi-echo STEAM spectroscopy (HISTO, 5 TEs = 12, 24, 36, 48 and 72ms, TR = 3s) for separate water and fat signal relaxometry along with fat-fraction assessment, was performed for comparison (10).The effect of fat content on water T2s was evaluated in a phantom containing 6 agarose samples with different FF from 0 to 35%. The effect of liver fat content on water T2 values was examined in a group of patients undergoing abdomen examination. The exclusion criteria for data evaluation were the presence of iron overload in the liver or bad-quality spectra from the HISTO acquisition. The T2 values were assessed via ROI analysis from the rTSE T2 maps and from inline reports included in the output from HISTO together with FF values.
Results
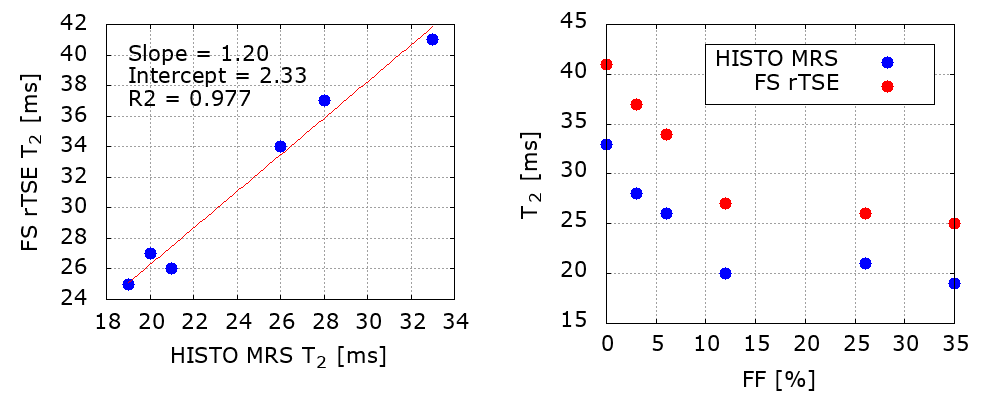
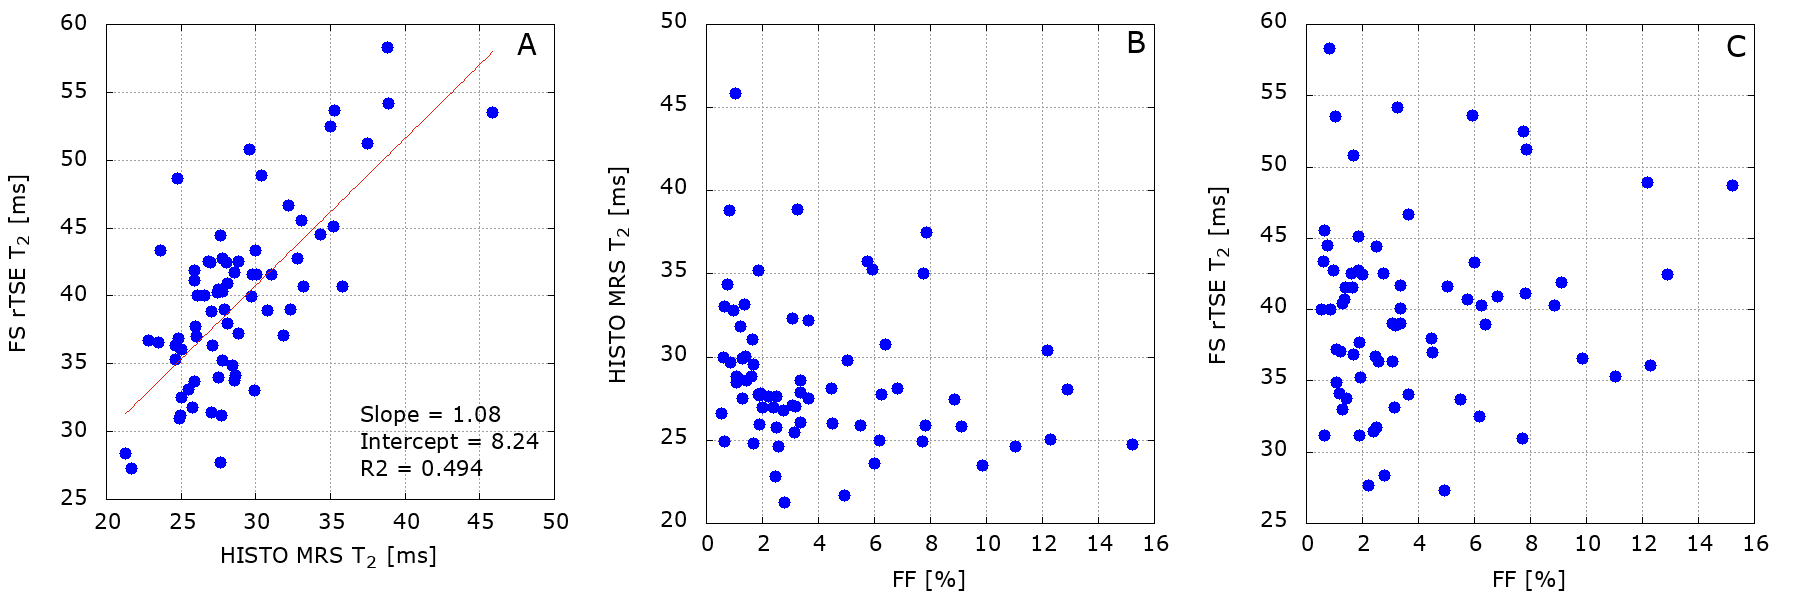
There is a strong correlation between HISTO-MRS T2 of water and FS-rTSE T2 values in phantom (Fig. 1A) and patient (Fig. 2A) data.Results from the phantom measurements are depicted in Figure 1. The presence of fat up to 10% decreases the T2 values, for higher FF the decrease levels out.
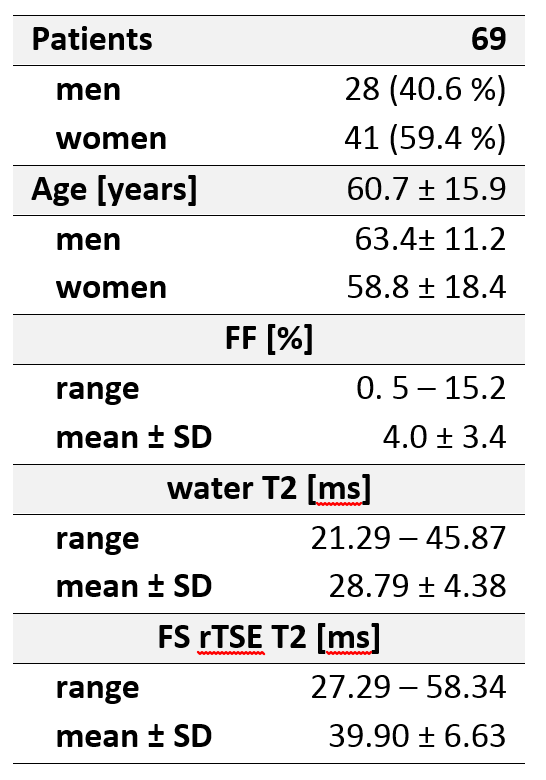
From the in-vivo analysis, 2 patients had to be excluded due to bad quality spectra, and 7 patients due to iron overload, which yielded 69 patients with hepatic FF ranging between 0 and 15%. Characteristics of included patients are summarized in Table 1. There is no statistically significant relationship between FF and HISTO-MRS T2 of water or FS-rTSE T2 values (Fig. 2).
Discussion
Our in-vivo results did not show any statistically significant dependence of water T2 on fat accumulation in the range of hepatic FF up to 15%, but phantom data show a decrease in T2 in this range. Level out beyond this FF can be due to phantom composition: the samples were constructed in 50ml tubes with the given FF filled up with MnCl2 solution. The main limitation of the study was the absence of cases with higher liver FF. This could be the source of the lack of significance in our MRS data, as in the published works a significant negative correlation was reported in patients with a broader range of hepatic FF (6), (7). A further limitation is the lack of ROI co-localization for FF and T2 values: While data for HISTO-MRS water T2 and FF were derived from the same voxel, the FS-rTSE T2 value was calculated as an average value from 2 to 3 different circular ROIs from liver parenchyma. In the future, this could be improved by obtaining additional FF values from an image-based acquisition using the same ROI as for the T2 map, e.g. multi-echo Dixon mapping.Conclusion
In the FF range ≤ 15% we could not confirm a correlation between water T2 and FF. The diagnostic potential of T2 mapping will be explored further.Acknowledgements
Fei Han and Stephan Kannengiesser, Siemens Healthineers, for providing the rTSE prototype.References
[1] DEKKERS, Ilona A.; LAMB, Hildo J. Clinical application and technical considerations of T 1 & T 2 (*) mapping in cardiac, liver, and renal imaging. The British Journal of Radiology, 2018, 91.1092: 20170825.
[2] GUIMARAES, Alexander R., et al. T2 relaxation time is related to liver fibrosis severity. Quantitative imaging in medicine and surgery, 2016, 6.2: 103.
[3] CARLIER, Pierre G. Global T2 versus water T2 in NMR imaging of fatty infiltrated muscles: different methodology, different information and different implications. Neuromuscular Disorders, 2014, 24.5: 390-392.
[4] SZCZEPANIAK, Lidia S., et al. Magnetic resonance spectroscopy to measure hepatic triglyceride content: prevalence of hepatic steatosis in the general population. American Journal of Physiology-Endocrinology and Metabolism, 2005, 288.2: E462-E468.
[5] BENCIKOVA, D., et al. Fast radial T2 mapping of the liver. In: Proc. Intl. Soc. Mag. Reson. Med. 28, 2020.
[6] GILMAN, A. J., et al. Liver fat and water MR T2 values at 3T: Dependence upon steatosis level. In: Proc. Intl. Soc. Mag. Reson. Med. 2011.
[7] VEERAIA, P., et al. Water and lipid T2 are associated with hepatic lipid content. In: ESMRMB Congress, 2019.
[8] ALTBACH, Maria I., et al. Radial fast spin‐echo method for T2‐weighted imaging and T2 mapping of the liver. Journal of Magnetic Resonance Imaging: An Official Journal of the International Society for Magnetic Resonance in Medicine, 2002, 16.2: 179-189.
[9] NATSUAKI, Yutaka, et al. Flexible and efficient 2D radial TSE T2 mapping with tiered echo sharing and with “pseudo” golden angle ratio reordering. In: Proc ISMRM. 2017.
[10] PINEDA, Nashiely, et al. Measurement of hepatic lipid: high-speed T2-corrected multiecho acquisition at 1H MR spectroscopy—a rapid and accurate technique. Radiology, 2009, 252.2: 568-576.
Figures