1872
Multi-Parametric Relationships in Subjects with Liver Iron Overload Obtained using STEAM-MRS at 1.5T and 3T1Radiology, University of Wisconsin-Madison, Madison, WI, United States, 2Medical Physics, University of Wisconsin-Madison, Madison, WI, United States, 3Radiology, University of California-San Diego, San Diego, CA, United States, 4Biomedical Engineering, University of Wisconsin-Madison, Madison, WI, United States, 5Medicine, University of Wisconsin-Madison, Madison, WI, United States, 6Emergency Medicine, University of Wisconsin-Madison, Madison, WI, United States
Synopsis
The relationships between several promising MR biomarkers of diffuse liver disease were evaluated at both 1.5T and 3T in subjects with liver iron overload using stimulated echo acquisition mode (STEAM) MRS. Multi-TE and multi-TE-TR sequences were acquired in order to obtain estimates of R1, R2, FWHM, and PDFF. Linear regression analysis was performed to evaluate the relationships between these various parameters and their relationships across field strengths. Several biomarkers demonstrated moderate to high correlations with each other, and the multi-TE-TR sequence (lower spectral resolution and higher number of spectra than the multi-TE sequence) tended to produce better correlations.
Introduction
There is growing interest in multi-parametric MR-based quantitative techniques for the assessment of diffuse liver disease,1-3 which includes several biomarkers, such as R1 (biomarker of fibrosis and inflammation), R2 and R2* (biomarkers of iron overload), and PDFF (biomarker of fatty liver disease).4-7 Quantification of these parameters using imaging methods can suffer from long scan times and the complexities of separating the relaxation properties of water and fat.In contrast, multi-acquisition stimulated echo acquisition mode (STEAM)-MRS can be performed within a breath-hold and is capable of simultaneously quantifying R1, R2, PDFF, and full-width at half-maximum (FWHM=R2*/π, i.e., a potential biomarker of iron overload).8,9 Currently, the relationships between these biomarkers are unknown in the context of liver iron overload. Therefore, the purpose of this work was to determine the relationships between several MR parameters in subjects with liver iron overload using STEAM-MRS at 1.5T and 3T.
Methods
Subjects: Subjects with known or suspected liver iron overload were recruited for this prospective IRB-approved study, with written informed consent.MR acquisition: Subjects underwent MR imaging at both 1.5T (Signa HDxt and Optima MR450W, GE Healthcare) and 3T (MR750, GE Healthcare) during the same visit. At each field strength, two STEAM-MRS sequences (multi-TE8 and multi-TE-TR9) were acquired, each in an 18-21sec breath-hold from a 2x2x2 cm3 to 3x3x3 cm3 voxel placed in the right liver lobe.
The multi-TE sequence acquired six spectra (one pre-acquisition) using the following parameters: TE1=10ms, $$$\Delta$$$TE=5ms, 5 echo times acquired in separate TRs, TR=3500ms, spectral width (sw)=5000Hz, and 2048 samples. The multi-TE-TR sequence acquired 32 spectra (four pre-acquisitions) using the following parameters: TRs between 140-1990ms, TEs between 10-110ms, sw=5000Hz, and 256 samples. Additionally, liver iron concentration (LIC) was measured using R2-based FerriScan (Resonance Health, Claremont, WA, Australia) obtained at 1.5T.10
MRS data analysis: MRS data were analyzed using an automated procedure11 to estimate R2water, R2fat, FWHMwater, FWHMfat, and PDFF from the multi-TE datasets. Using multi-TE-TR data, these same parameters, as well as R1water and R1fat, were estimated.
Multi-parametric relationship analysis: Linear regression analysis was performed in order to evaluate the relationships between the various estimated parameters at and across the two field strengths. For fat estimates (R2, FWHM, and R1), subjects with PDFF < 3% were removed from the analysis. Additionally, outliers (studentized residual > 3) were also removed from the statistical analysis using an automated iterative procedure, followed by manual evaluation of potential outliers.
Results
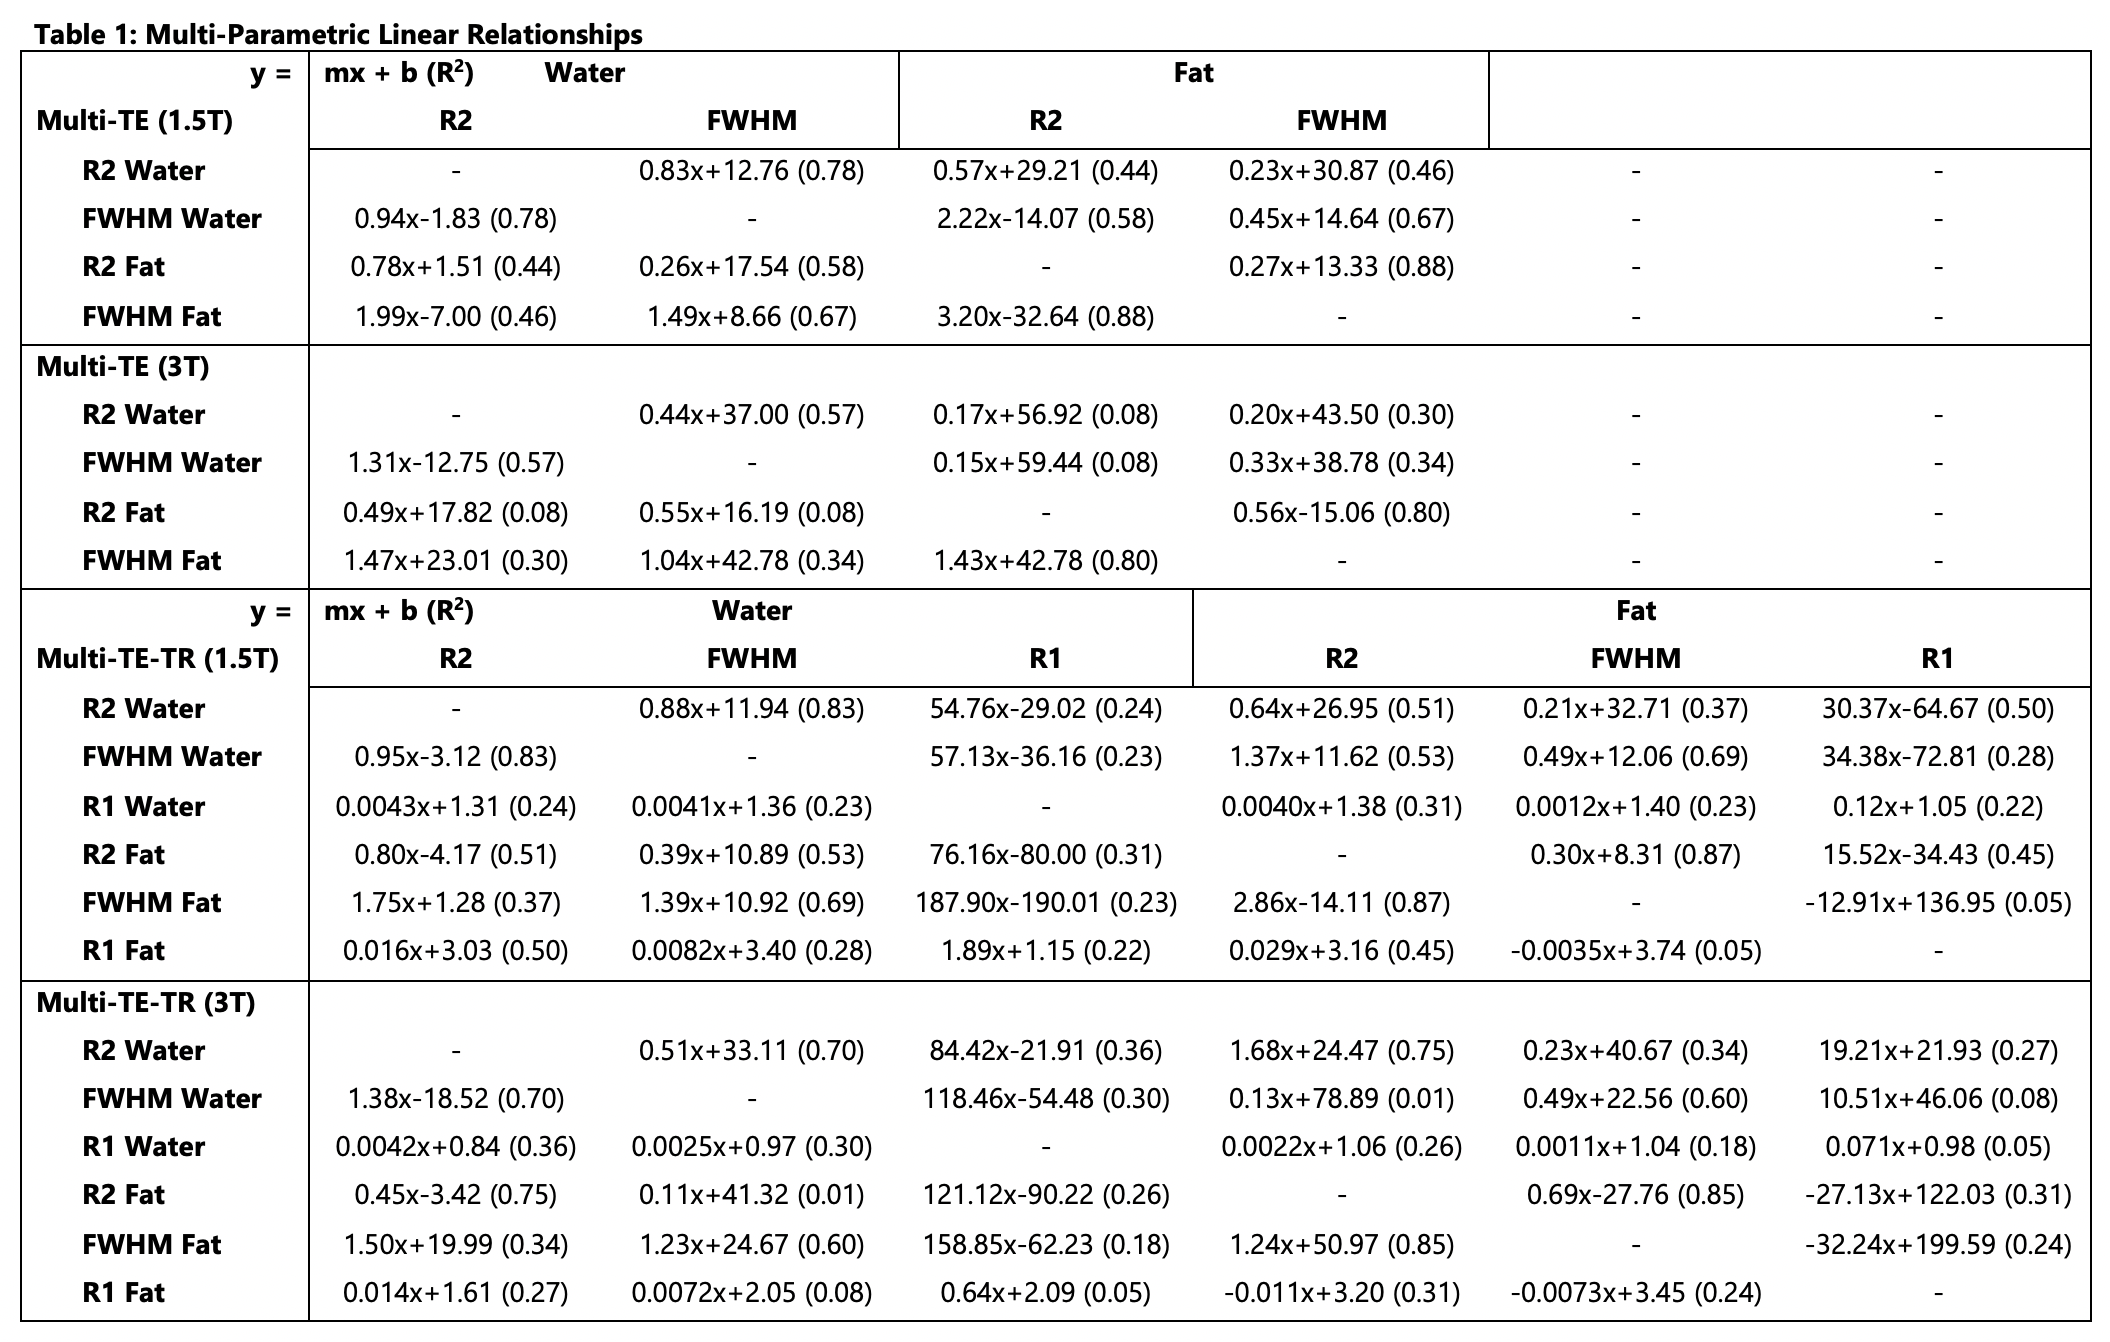
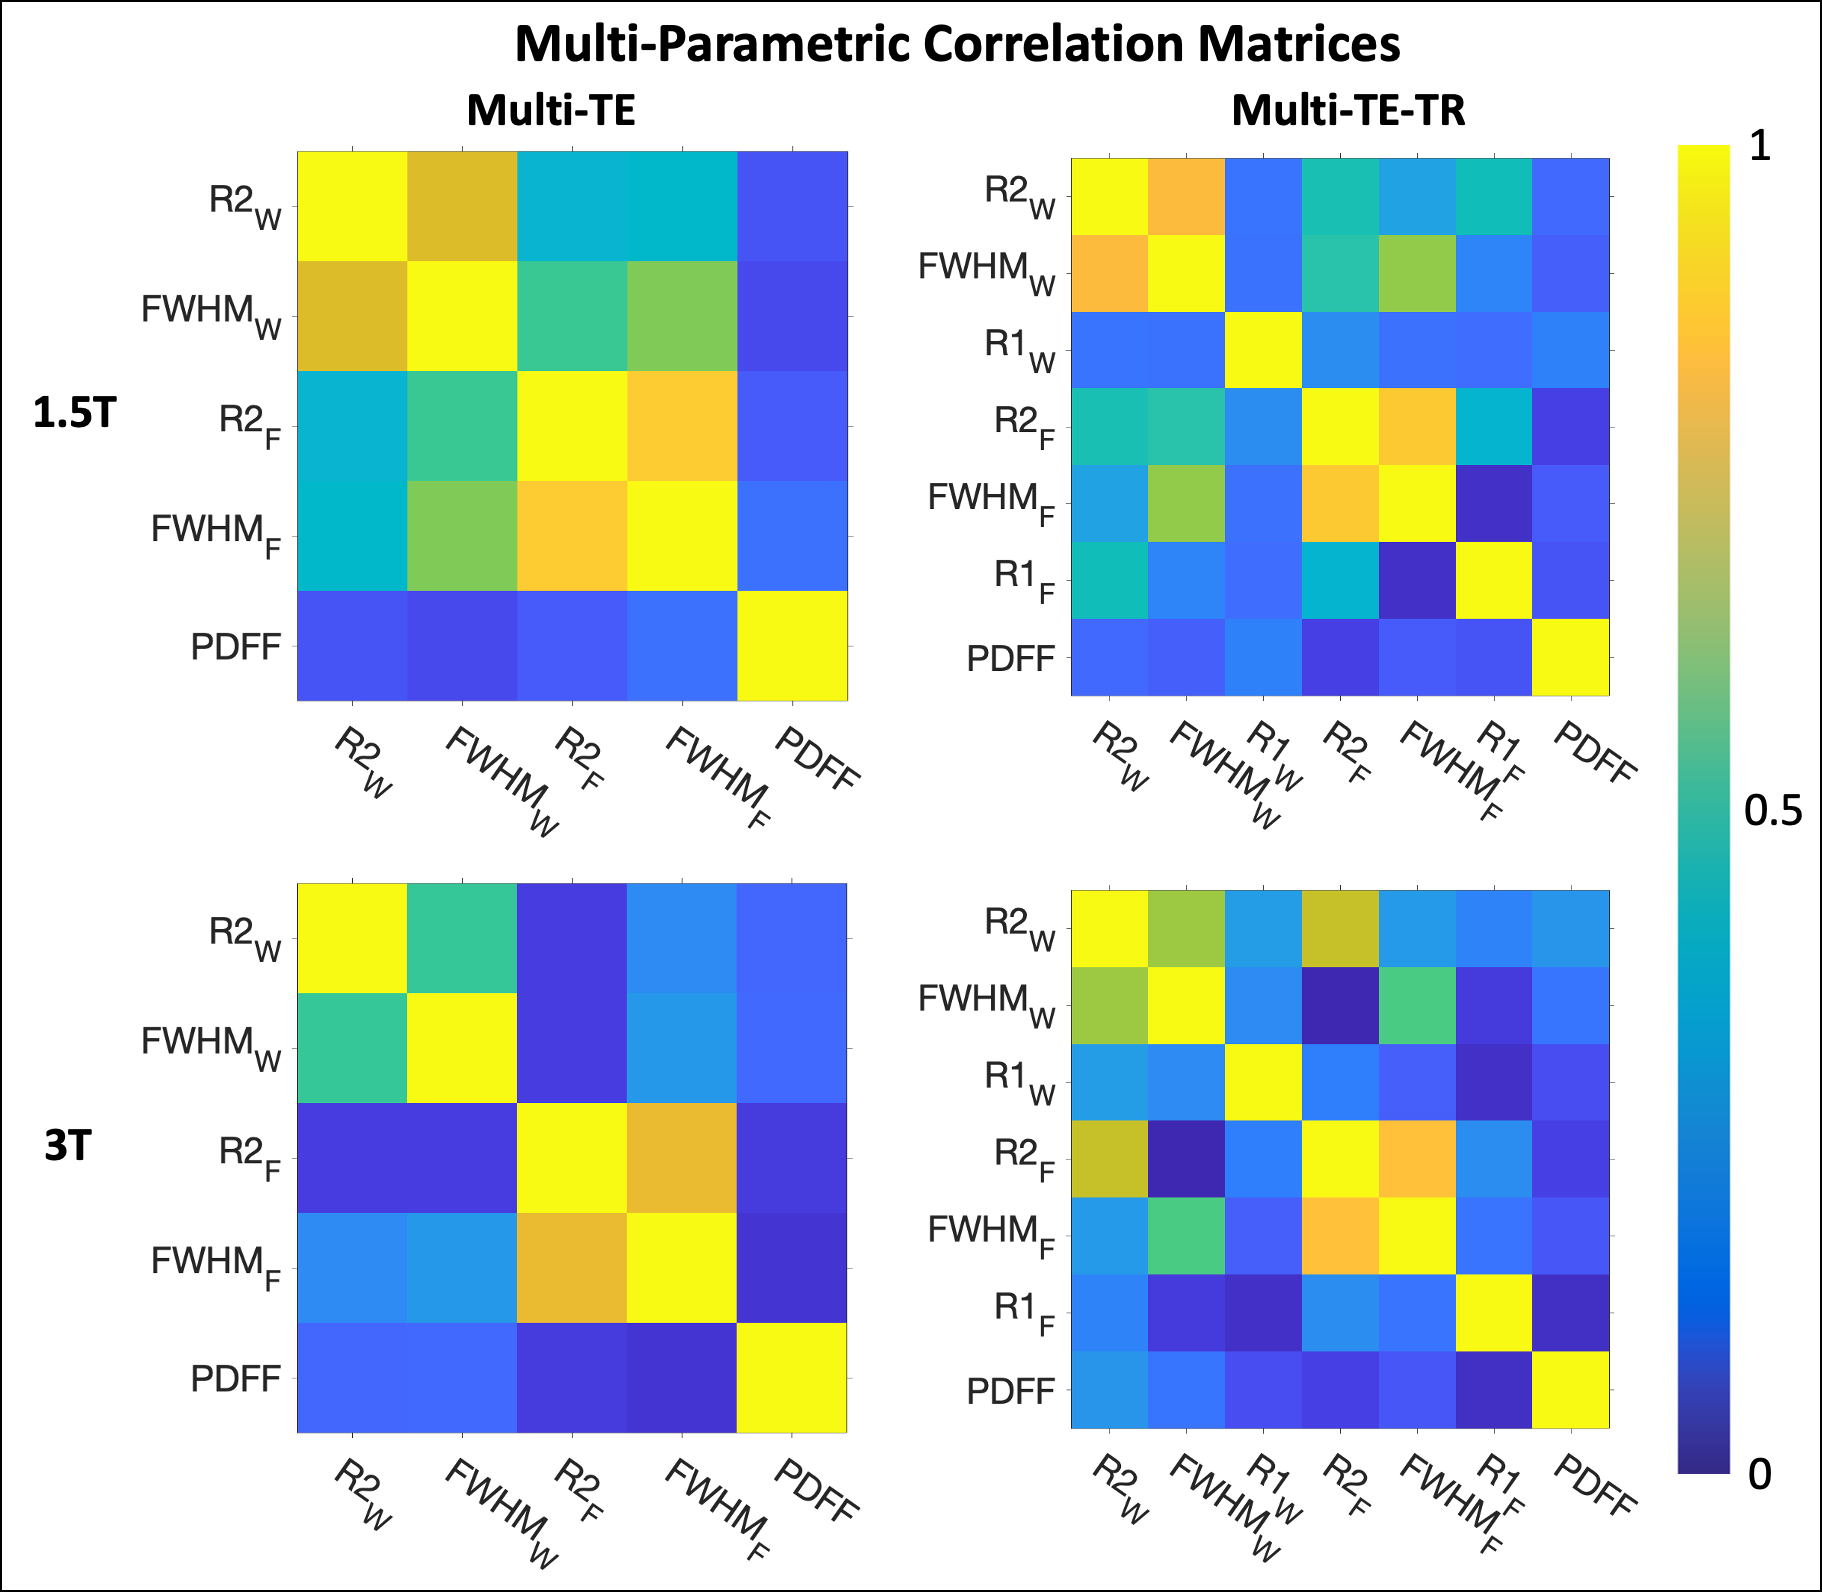
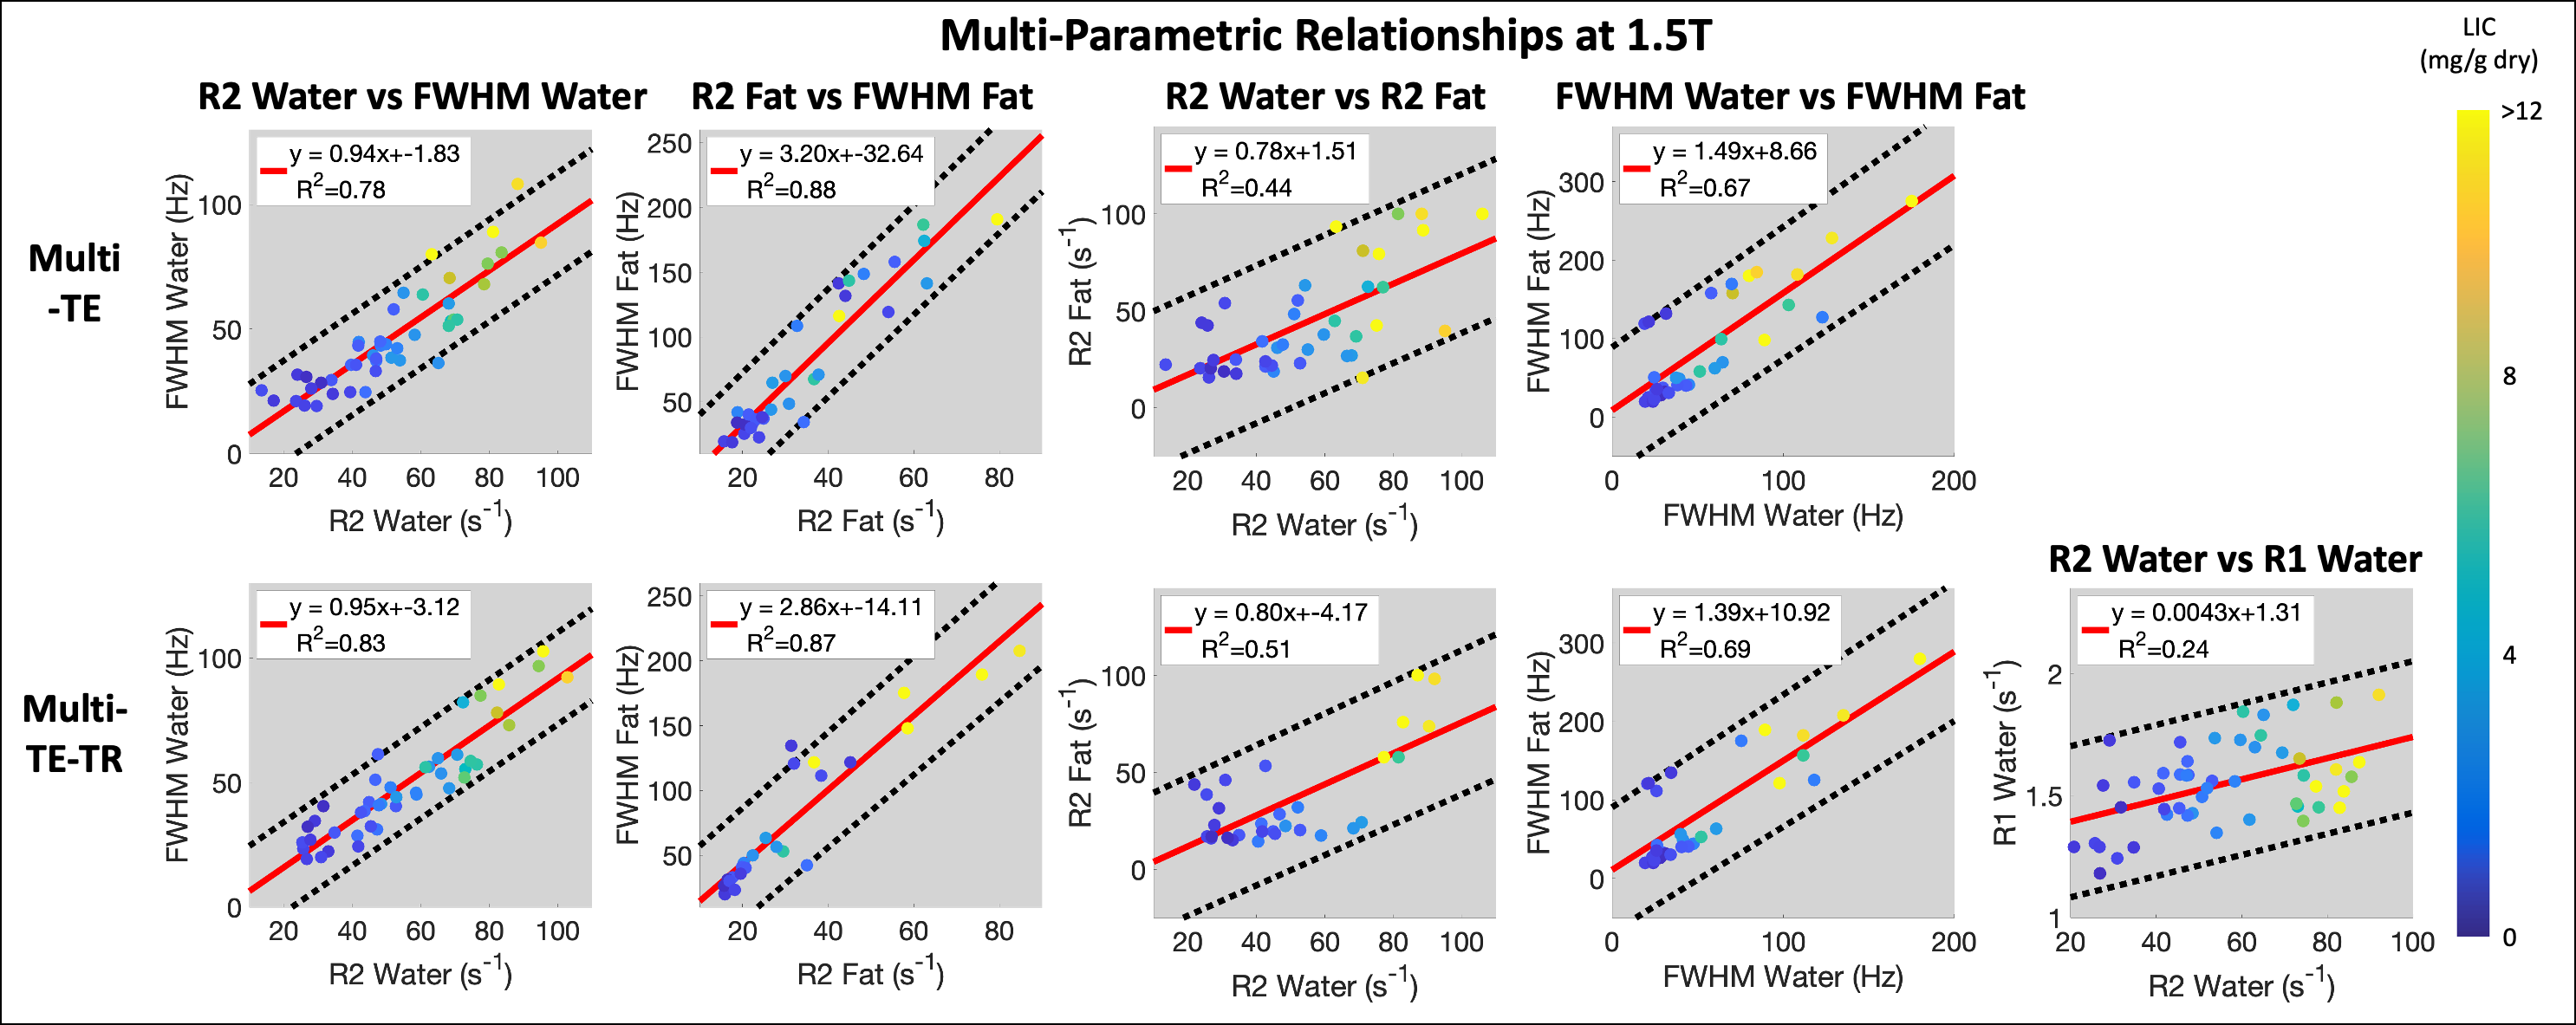
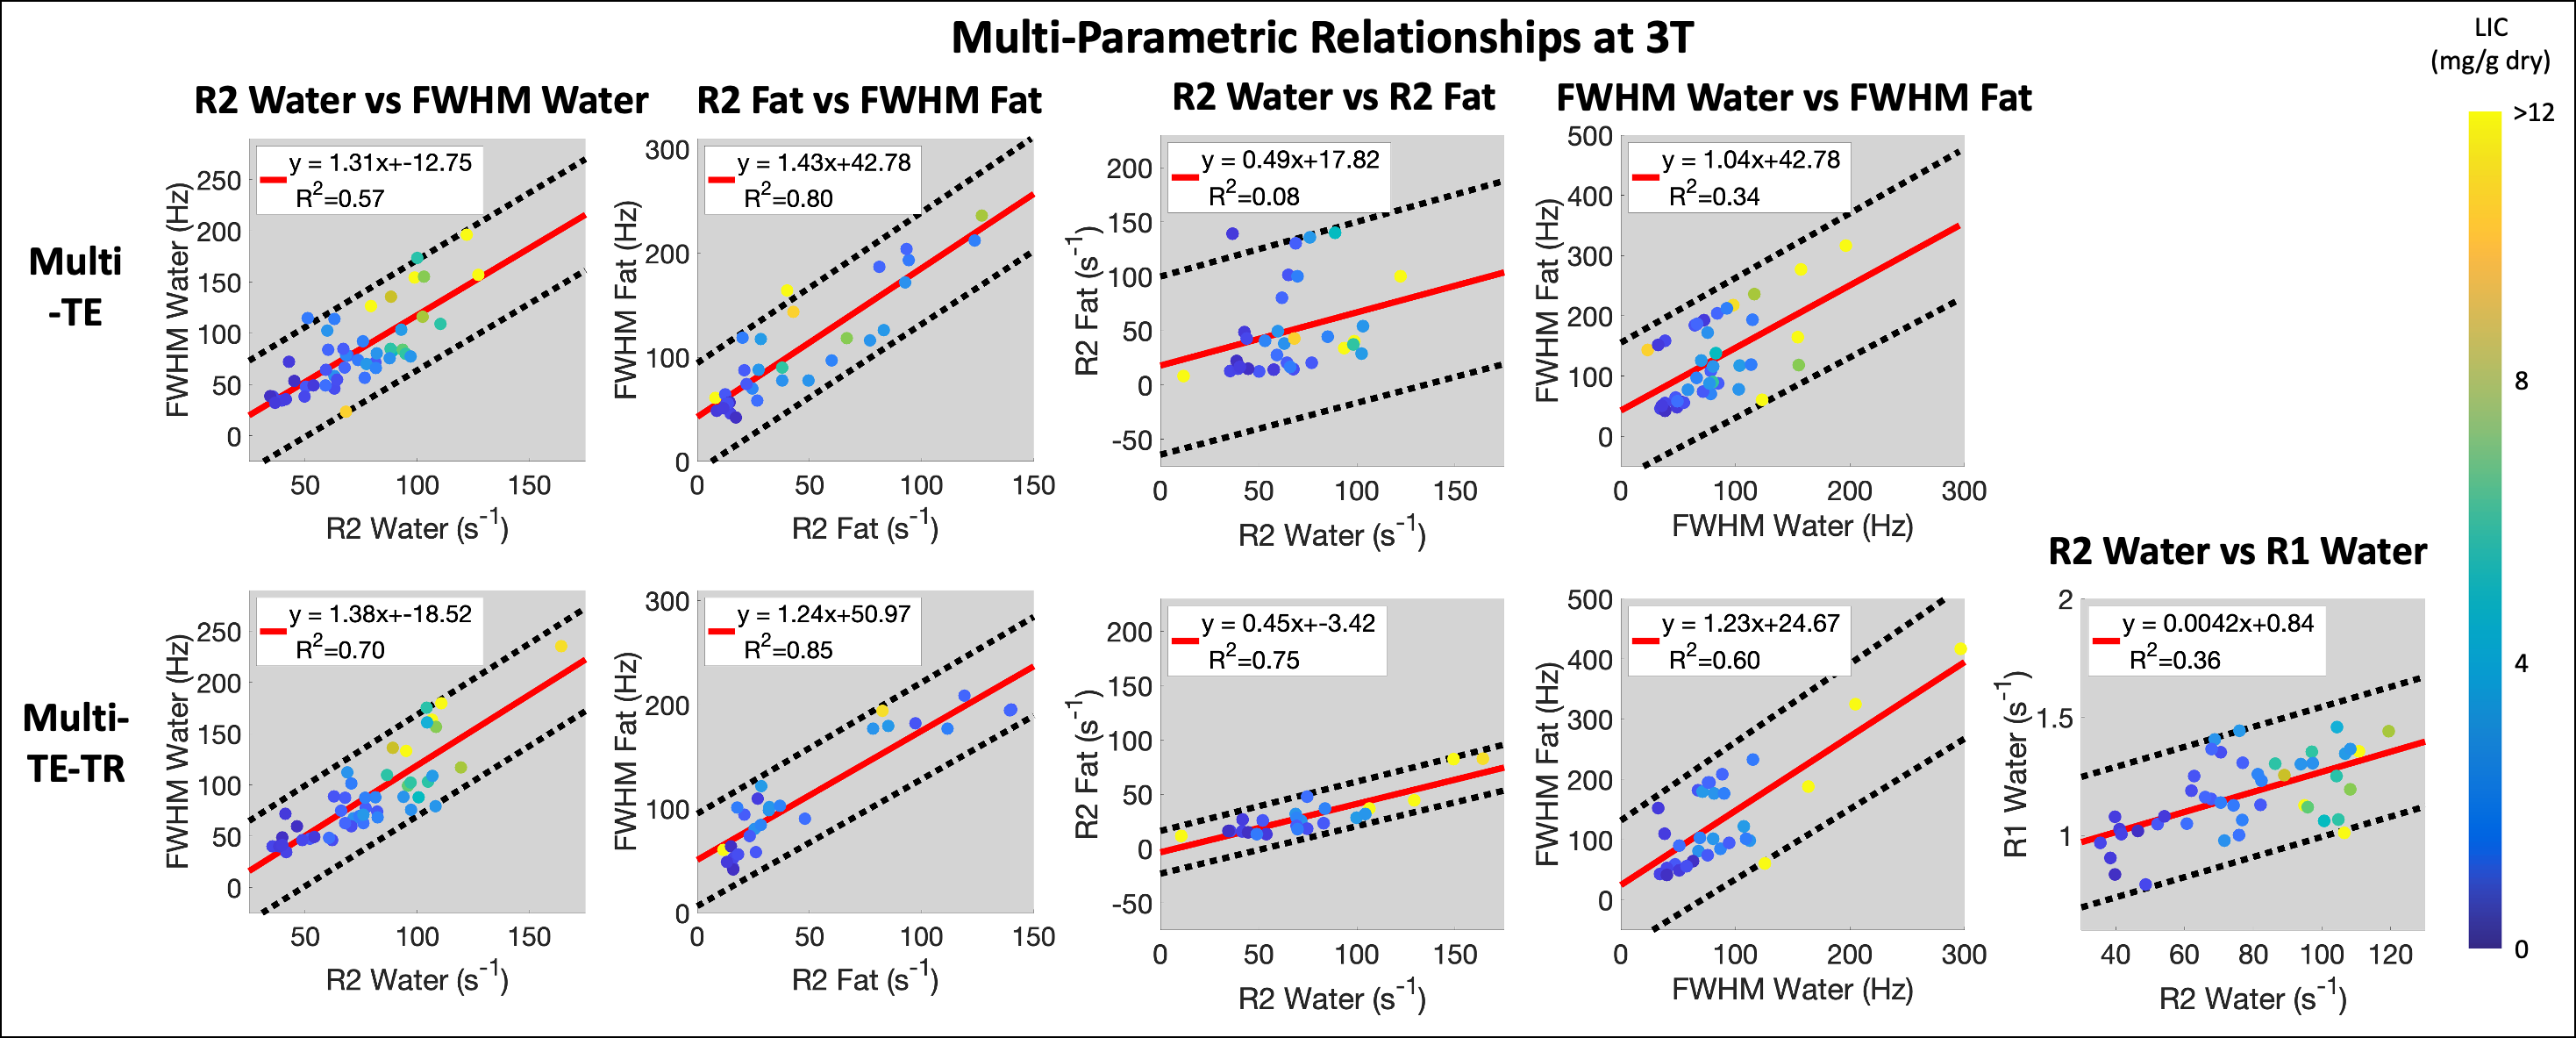
Subjects: Fifty-seven (n=57) subjects (38 male, 19 female) with median age 50.5 years (range 10-73) were recruited and imaged at both 1.5T and 3T.Multi-parametric relationships: Table 1 provides the linear fits (slopes, intercepts, and R2) describing the relationships between parameters for each sequence at both 1.5T and 3T. The associated R2 correlation matrices are also presented (Figure 1). High correlations (R2>0.75) were observed between R2water and FWHMwater and between R2fat and FWHMfat for both sequences at both field strengths (Figures 2-3), except for R2water and FWHMwater at 3T. It was also observed that R1water exhibited a weaker dependence on LIC than R2 and FWHM.
Relatively similar slopes were observed across the two sequences for all relationships presented in Figures 2 and 3. However, similar slopes were not observed across the two sequences between PDFF (range of ~0-30% across subjects) and the other parameters, and low correlations (R2<0.33) were observed (Figure 1).
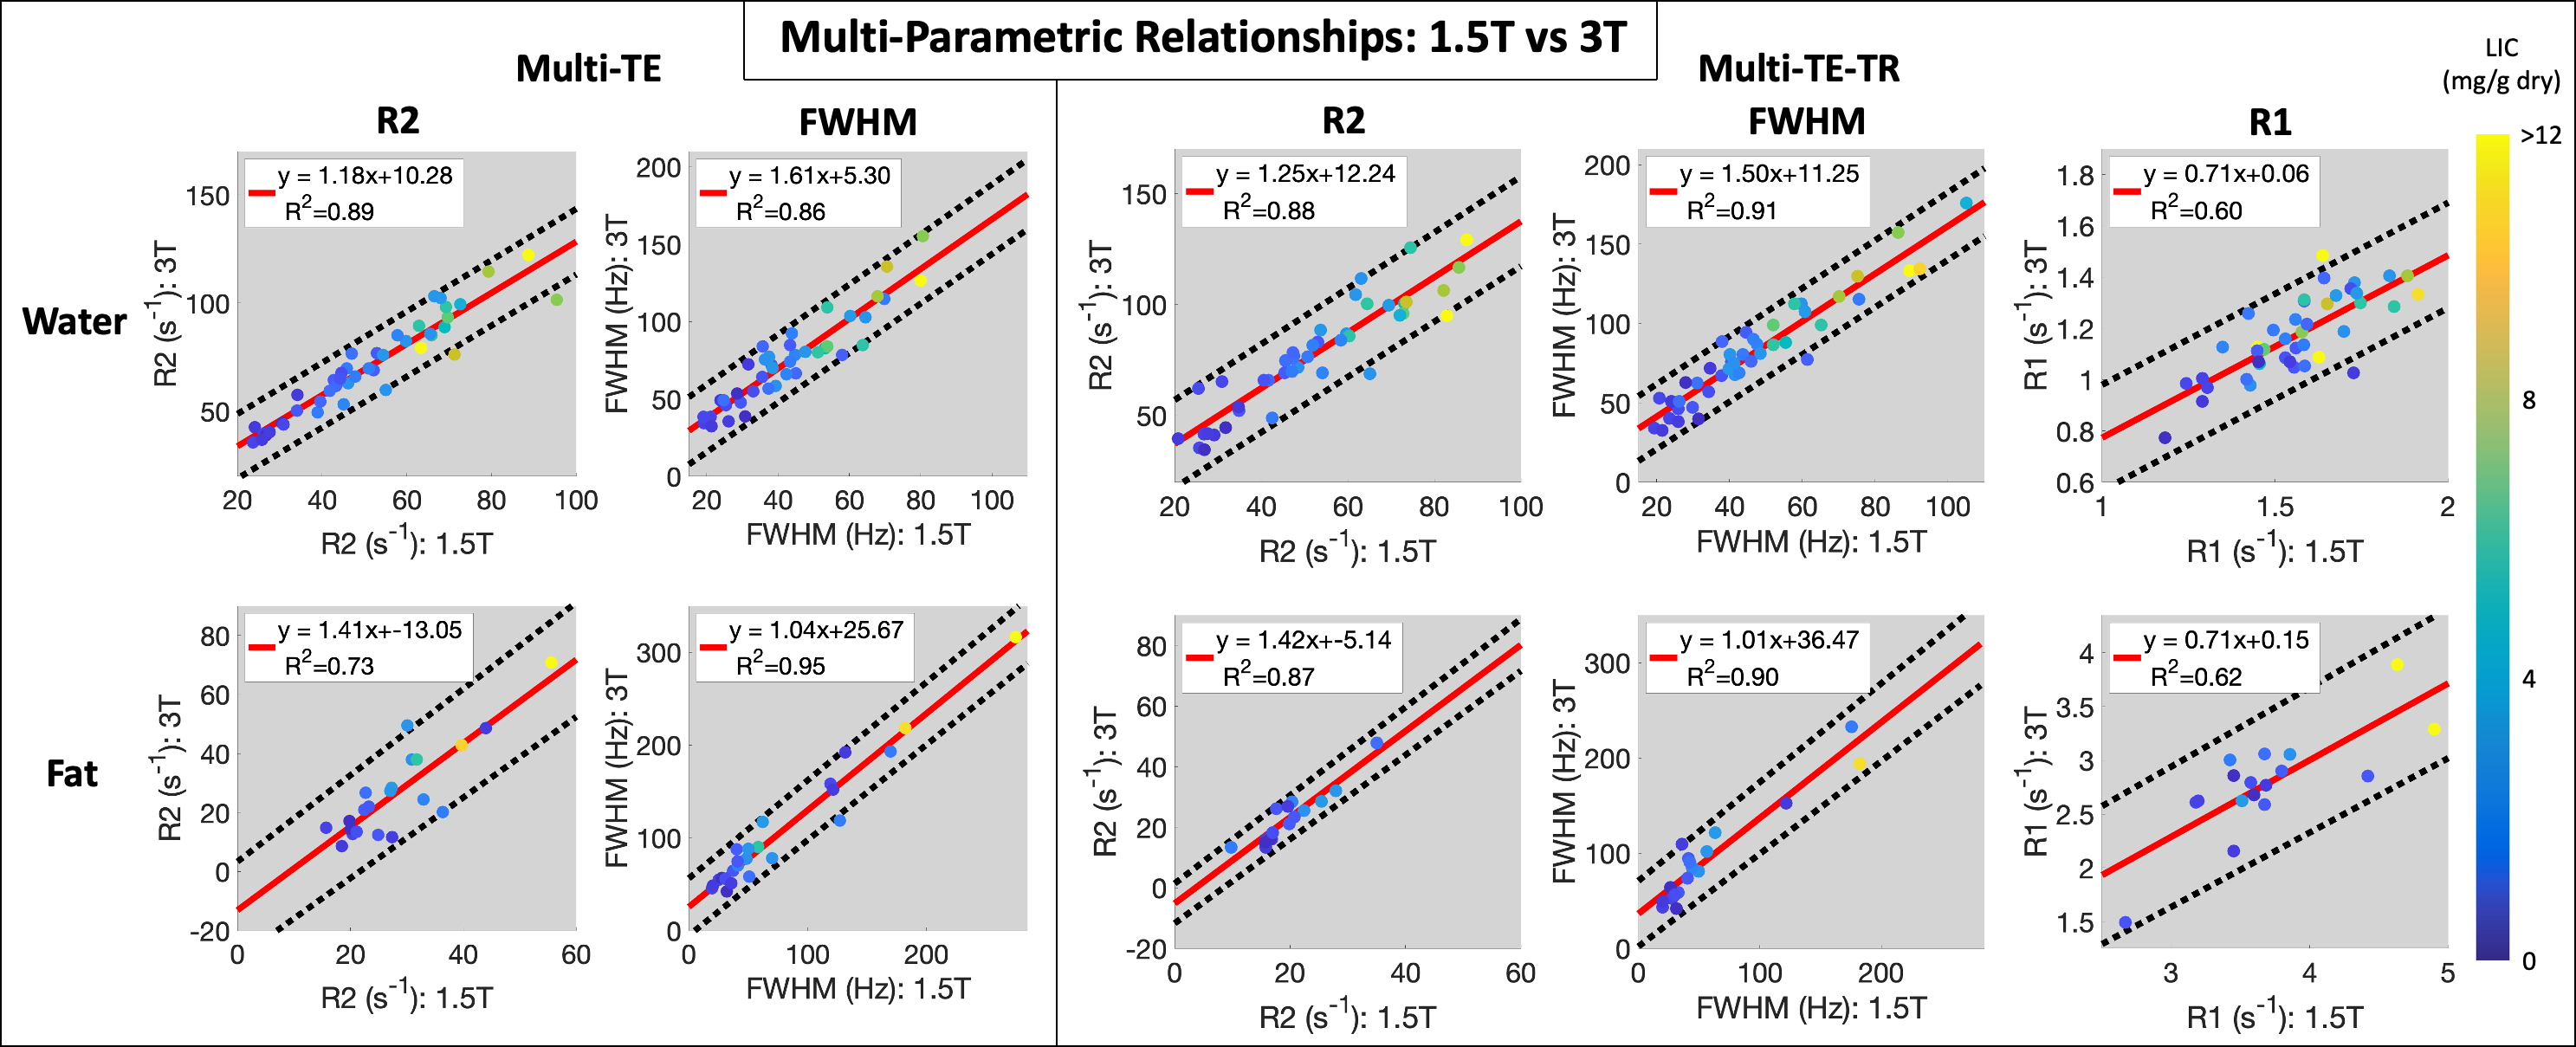
High correlations (R2>0.75) were observed for R2 and FWHM of both water and fat when comparing the estimates at 1.5T to those at 3T (Figure 4). Moderate correlations were observed for R1 (R2=0.60 and 0.62 for water and fat, respectively).
Discussion and Conclusion
Several studies using imaging methods have reported correlations between R1, R2, and R2* with LIC.12-15 However, the relationships between these biomarkers are not well understood and are needed to establish confounder-corrected biomarkers of diffuse liver disease (e.g., iron-corrected T116,17). In this work, moderate to high linear correlations between biomarkers and across field strengths were observed in subjects with liver iron overload. The multi-TE-TR STEAM-MRS sequence, which acquired more spectra at lower spectral resolution, tended to produce higher correlations than the multi-TE sequence, which acquired fewer spectra at high spectral resolution.Some studies have reported a correlation between R2* and PDFF.18-20 However, in this work, low correlation and inconsistent slopes across the two sequences were observed for all relationships with PDFF. Relationships with PDFF may exist, but they may have been obscured by the presence of iron dominating relaxation effects and/or obscured by shim effects from the large voxel size.
When examining the relationships between estimates at 1.5T and 3T, the observed slopes for R1 and R2water agree relatively well with previously published results in the liver.21-23 A non-linear relationship is known to exist between R2 and R2* in the liver13; however, high linear correlations were observed between R2 and FWHM in this work and no obvious deviations from linear behavior were observed, even when examining the data before outlier removal.
Limitations of this work include a lack of extreme cases of iron overload and a lack of biopsy correlation for the measured MR biomarkers.
In conclusion, by evaluating the relationships between multiple biomarkers, this work may advance the comprehensive MRS-based assessment of diffuse liver disease.
Acknowledgements
The authors wish to acknowledge support from the NIH (R01 DK117354, R01 DK100651, R01 DK088925) and to acknowledge GE Healthcare who provide research support to the University of Wisconsin. Dr. Reeder is a Romnes Faculty Fellow and has received an award provided by the University of Wisconsin-Madison Office of the Vice Chancellor for Research and Graduate Education with funding from the Wisconsin Alumni Research Foundation.References
1. Jaubert, O., et al., Multi‐parametric liver tissue characterization using MR fingerprinting: Simultaneous T1, T2, and fat fraction mapping. Magnetic Resonance in Medicine, 2020.
2. Thomaides-Brears, H.B., et al., Multiparametric MR mapping in clinical decision-making for diffuse liver disease. Abdominal Radiology, 2020: p. 1-16.
3. McDonald, N., et al., Multiparametric magnetic resonance imaging for quantitation of liver disease: a two-centre cross-sectional observational study. Scientific reports, 2018. 8(1): p. 1-10.
4. Olson, M.C., S.B. Reeder, and S.K. Venkatesh, Quantitative MRI Biomarkers of Diffuse Liver Disease. Advances in Clinical Radiology, 2019. 1: p. 55-69.
5. Bannas, P., et al., Emerging quantitative MRI biomarkers of diffuse liver disease. Clinical liver disease, 2014. 4(6): p. 129.
6. Taouli, B. and F.C. Alves, Imaging biomarkers of diffuse liver disease: current status. Abdominal Radiology, 2020. 45(11): p. 3381-3385.
7. Mortele, K.J. and P.R. Ros, Imaging of diffuse liver disease. In Seminars in Liver Disease, 2001. 21(02): p. 195-212.
8. Hamilton, G., et al., Effect of PRESS and STEAM sequences on magnetic resonance spectroscopic liver fat quantification. Journal of Magnetic Resonance Imaging: An Official Journal of the International Society for Magnetic Resonance in Medicine, 2009. 30(1): p. 145-152.
9. Hamilton, G., et al., In vivo breath‐hold 1H MRS simultaneous estimation of liver proton density fat fraction, and T1 and T2 of water and fat, with a multi‐TR, multi‐TE sequence. Journal of Magnetic Resonance Imaging, 2015. 42(6): p. 1538-1543.
10. Pierre, T.G.S., et al., Noninvasive measurement and imaging of liver iron concentrations using proton magnetic resonance. Blood, 2005. 105(2): p. 855-861.
11. Hernando, D., et al., Fully automated processing of multi-echo spectroscopy data for liver fat quantification. In Proceedings of the 22nd Annual Meeting of ISMRM, Milan, Italy, 2014. Abstract 2884.
12. Henninger, B., et al., Evaluation of MR imaging with T1 and T2* mapping for the determination of hepatic iron overload. European radiology, 2012. 22(11): p. 2478-2486.
13. Wood, J.C., et al., MRI R2 and R2* mapping accurately estimates hepatic iron concentration in transfusion-dependent thalassemia and sickle cell disease patients. Blood, 2005. 106(4): p. 1460-1465.
14. Matsuo-Tezuka, Y., et al., T2 Relaxation Time Obtained from Magnetic Resonance Imaging of the Liver Is a Useful Parameter for Use in the Construction of a Murine Model of Iron Overload. Contrast media & molecular imaging, 2019. 2019.
15. Hernando, D., et al., Quantification of liver iron with MRI: state of the art and remaining challenges. Journal of Magnetic Resonance Imaging, 2014. 40(5): p. 1003-1021.
16. Dillman, J.R., et al., Comparison of liver T1 relaxation times without and with iron correction in pediatric autoimmune liver disease. Pediatric radiology, 2020.
17. Mojtahed, A., et al., Reference range of liver corrected T1 values in a population at low risk for fatty liver disease—a UK Biobank sub-study, with an appendix of interesting cases. Abdominal Radiology, 2019. 44(1): p. 72-84.
18. Bashir, M.R., et al., Hepatic R2* is more strongly associated with proton density fat fraction than histologic liver iron scores in patients with nonalcoholic fatty liver disease. Journal of Magnetic Resonance Imaging, 2019. 49(5): p. 1456-1466.
19. Karlsson, M., et al., Liver R2* is affected by both iron and fat: A dual biopsy‐validated study of chronic liver disease. Journal of Magnetic Resonance Imaging, 2019. 50(1): p. 325-333.
20. Mamidipalli, A., et al., Cross‐sectional correlation between hepatic R2* and proton density fat fraction (PDFF) in children with hepatic steatosis. Journal of Magnetic Resonance Imaging, 2018. 47(2): p. 418-424.
21. Kritsaneepaiboon, S., et al., The relationship between myocardial and hepatic T2 and T2* at 1.5 T and 3T MRI in normal and iron-overloaded patients. Acta Radiologica, 2018. 59(3): p. 355-362.
22. Stanisz, G.J., et al., T1, T2 relaxation and magnetization transfer in tissue at 3T. Magnetic Resonance in Medicine: An Official Journal of the International Society for Magnetic Resonance in Medicine, 2005. 54(3): p. 507-512.
23. Ghugre, N.R., et al., Relaxivity‐iron calibration in hepatic iron overload: Predictions of a Monte Carlo model. Magnetic resonance in medicine, 2015. 74(3): p. 879-883.
Figures