1870
Optimization of Flip Angle Modulated Motion Robust 2D Chemical Shift Encoded MRI of the Liver1Radiology, University of Wisconsin-Madison, Madison, WI, United States, 2Medical Physics, University of Wisconsin-Madison, Madison, WI, United States, 3Biomedical Engineering, University of Wisconsin-Madison, Madison, WI, United States, 4Medicine, University of Wisconsin-Madison, Madison, WI, United States, 5Emergency Medicine, University of Wisconsin-Madison, Madison, WI, United States
Synopsis
Free breathing 2D flip angle modulated (FAM) CSE techniques along three separate orientations (axial/coronal/sagittal) were developed and validated for motion-robust free-breathing liver PDFF and R2* quantification. Six healthy volunteers were recruited and scanned at 3T. Promising results suggest that the proposed optimized 2D FAM CSE techniques along coronal and sagittal directions were able to avoid tissue slice gaps in the liver during free breathing acquisitions. Accurate quantification of PDFF and R2* were also observed with the proposed optimized techniques, as well as improved SNR performance compared to previously proposed low-flip angle 2D CSE.
Introduction
Chemical shift encoded (CSE)-MRI methods enable liver fat and R2* quantification1–5. Conventional 3D CSE MRI1,3,6 requires the patient to sustain a ~20 second breath-hold. Many patients, including those with severe illness, and children, are often unable to sustain such breath-holds. Accurate quantification of PDFF can be compromised by subtle ghosting of adipose tissue signal into the liver due to motion.Recently, 2D sequential methods2 with a very short temporal footprint (~1sec/slice) have been developed to enable free-breathing CSE MRI. However, these methods conventionally use a low flip-angle to avoid T1 bias, which leads to low SNR.
In order to address this challenge, a 2D flip angle modulated (FAM) CSE sequence7 has been proposed where the flip angle is modulated throughout the phase encoding lines in an SNR-optimized, non-steady state acquisition. However, axial free-breathing acquisition may lead to incomplete sampling of liver tissue in the presence of through-plane respiratory motion. For this reason, there is a need to optimize and evaluate 2D FAM CSE along coronal and sagittal orientations where through-plane motion is expected to be smaller.
Therefore, the purpose of this study was to optimize 2D FAM CSE acquired along coronal/sagittal orientations and validate its ability to cover the whole liver without missing tissue while maintaining accurate quantification of PDFF and R2*.
Methods
Subjects:With IRB approval and informed written consent, 6 healthy volunteers (3M / 3F, age range: 25-40 years) were imaged at 3T (Signa Premier, GE Healthcare) with a 48-channel phased-array torso coil.
Data acquisition:
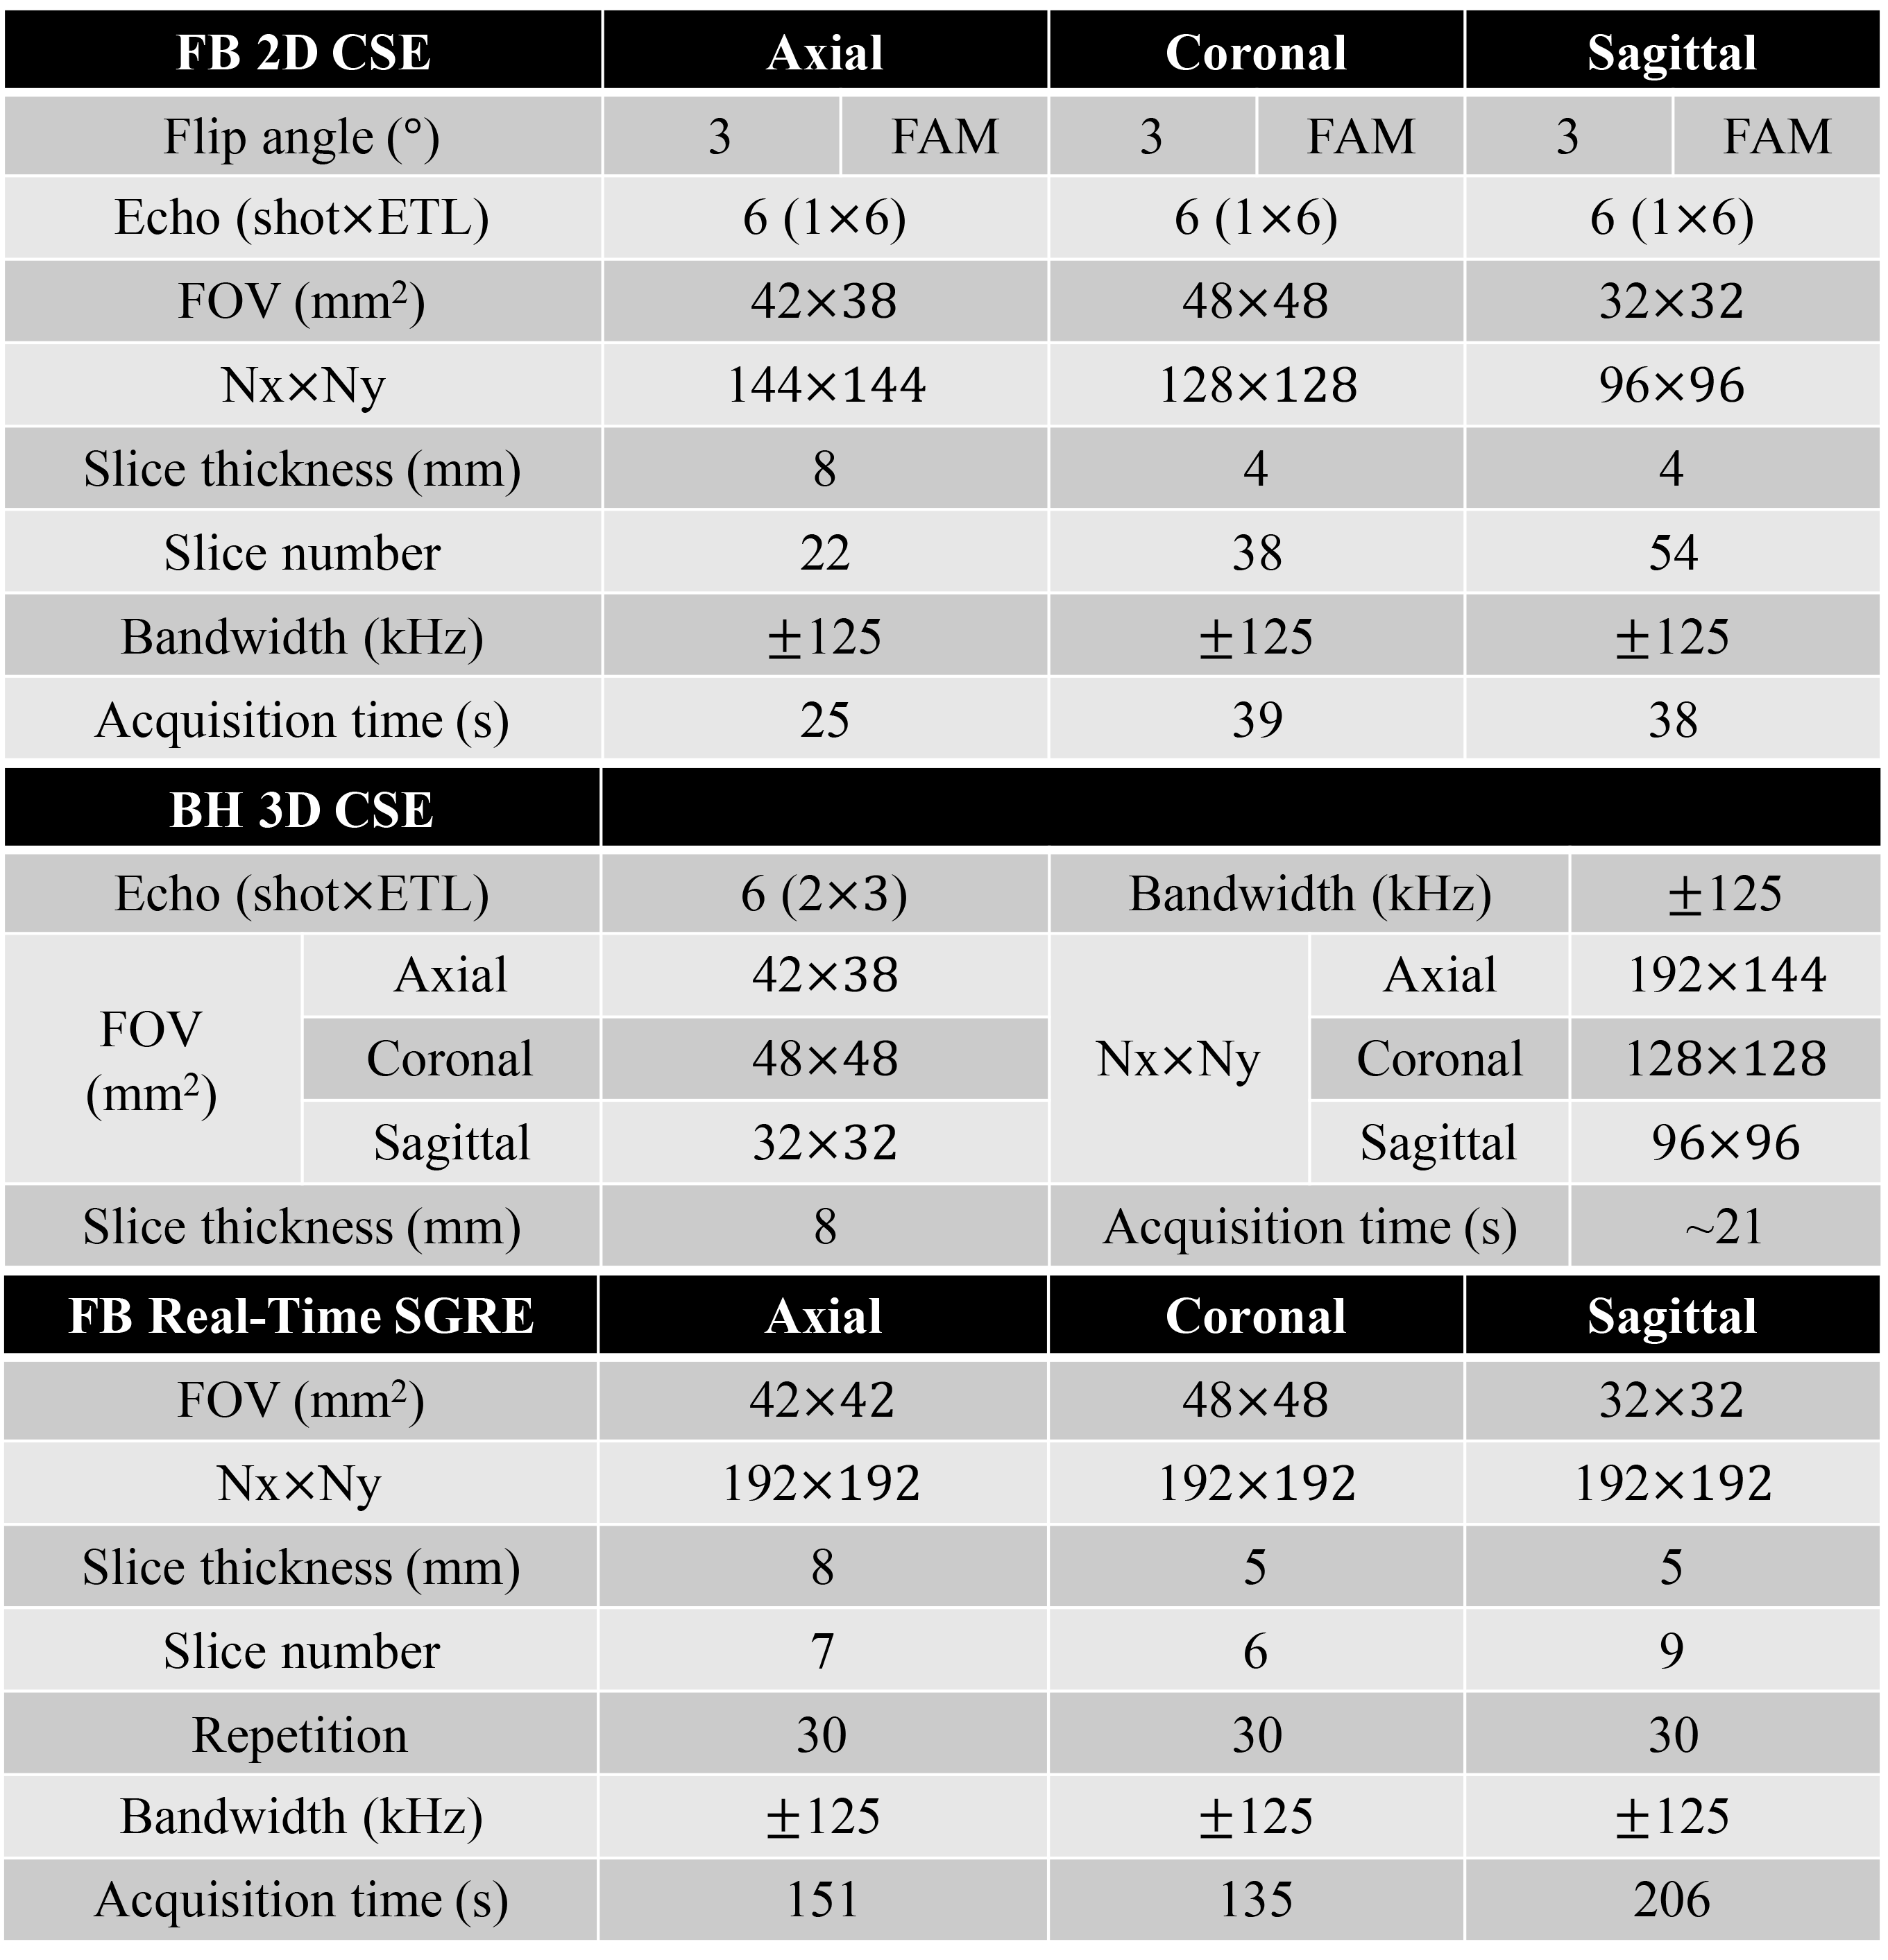
2D FAM CSE was optimized for coronal and sagittal orientations covering the whole liver using near isotropic resolution. Note that optimization of the flip angle schedule was performed separately for axial, coronal, and sagittal FAM CSE acquisitions, due to the different number of phase encoding lines for each orientation. Free breathing 2D CSE using a constant low flip angle (3°) was also acquired to compare the SNR performance. Conventional breath-hold 3D CSE was acquired as the reference for PDFF/R2*. ‘Real-time’ spoiled gradient echo (SGRE) images were acquired along each orientation with free breathing, in order to evaluate liver motion. Relevant acquisition parameters are listed in Table 1.
Data analysis:
- Real-time image analysis: An experienced abdominal radiologist delineated the liver in the SGRE images (all timepoints) within three slices spanning the liver for each orientation. The difference between minimum and maximum liver areas across timepoints was used as a surrogate measure of through-plane liver motion along each orientation.
- PDFF and R2* quantification: Each CSE acquisition was processed using a confounder-corrected PDFF and R2* quantification algorithm8. Circular ROIs were drawn in the liver lobe to measure PDFF and R2* values using Horos. 3D CSE measurements were used as the reference in this study.
Results
Real-time image analysis:The liver area difference measured across timepoints from axial real-time acquisition (S/I motion) is 29.7± 7.2mm2, from coronal acquisition (A/P motion) is 12.8±3.0mm2, and from sagittal acquisition (L/R motion) is 7.1±1.8mm2.
PDFF and R2* quantification:
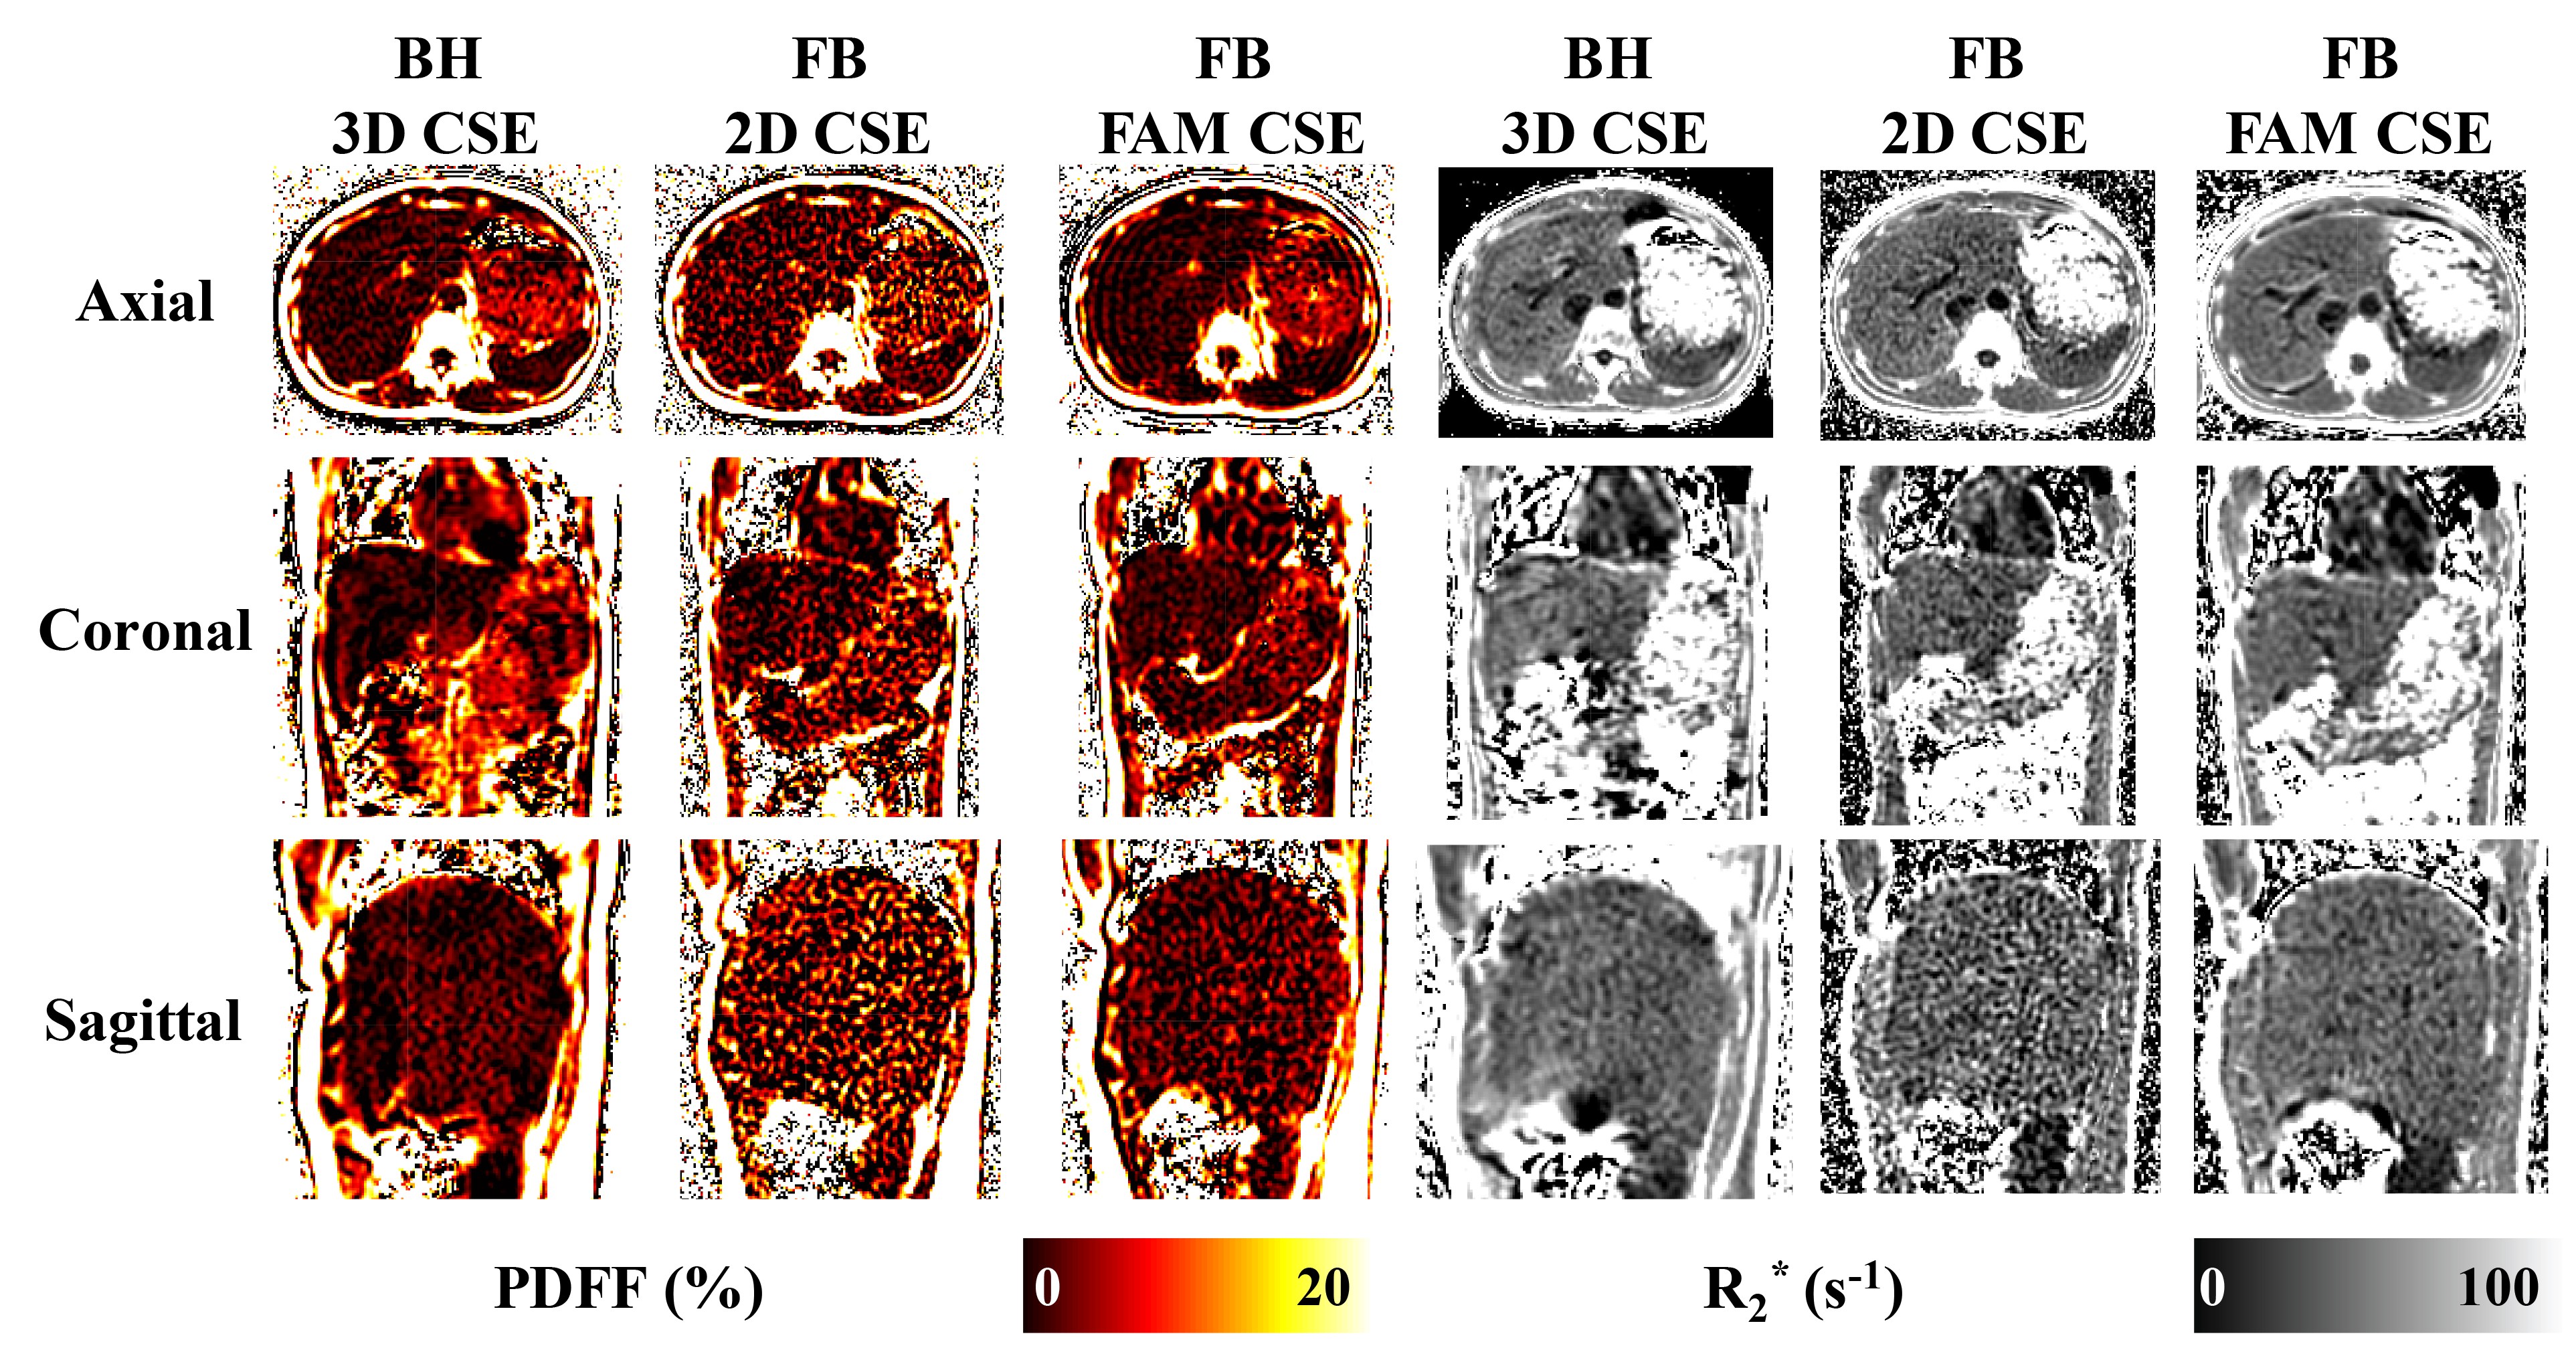
Figure 1 depicts axial, coronal, and sagittal PDFF and R2* maps from the optimized 2D FAM CSE. The red arrow in the real-time SGRE image movie indicates the potential for unsampled liver tissue during a 2D free-breathing axial acquisition. However, in both coronal and sagittal acquisitions, respiratory motion is largely in-plane, which minimizes the potential for missed tissue.
Figure 2 demonstrates high image quality in PDFF and R2* maps for 3D CSE, 2D CSE, and FAM CSE techniques across different orientations. Importantly, 2D FAM CSE has substantially higher SNR compared to low flip angle 2D CSE, and comparable SNR to 3D CSE.
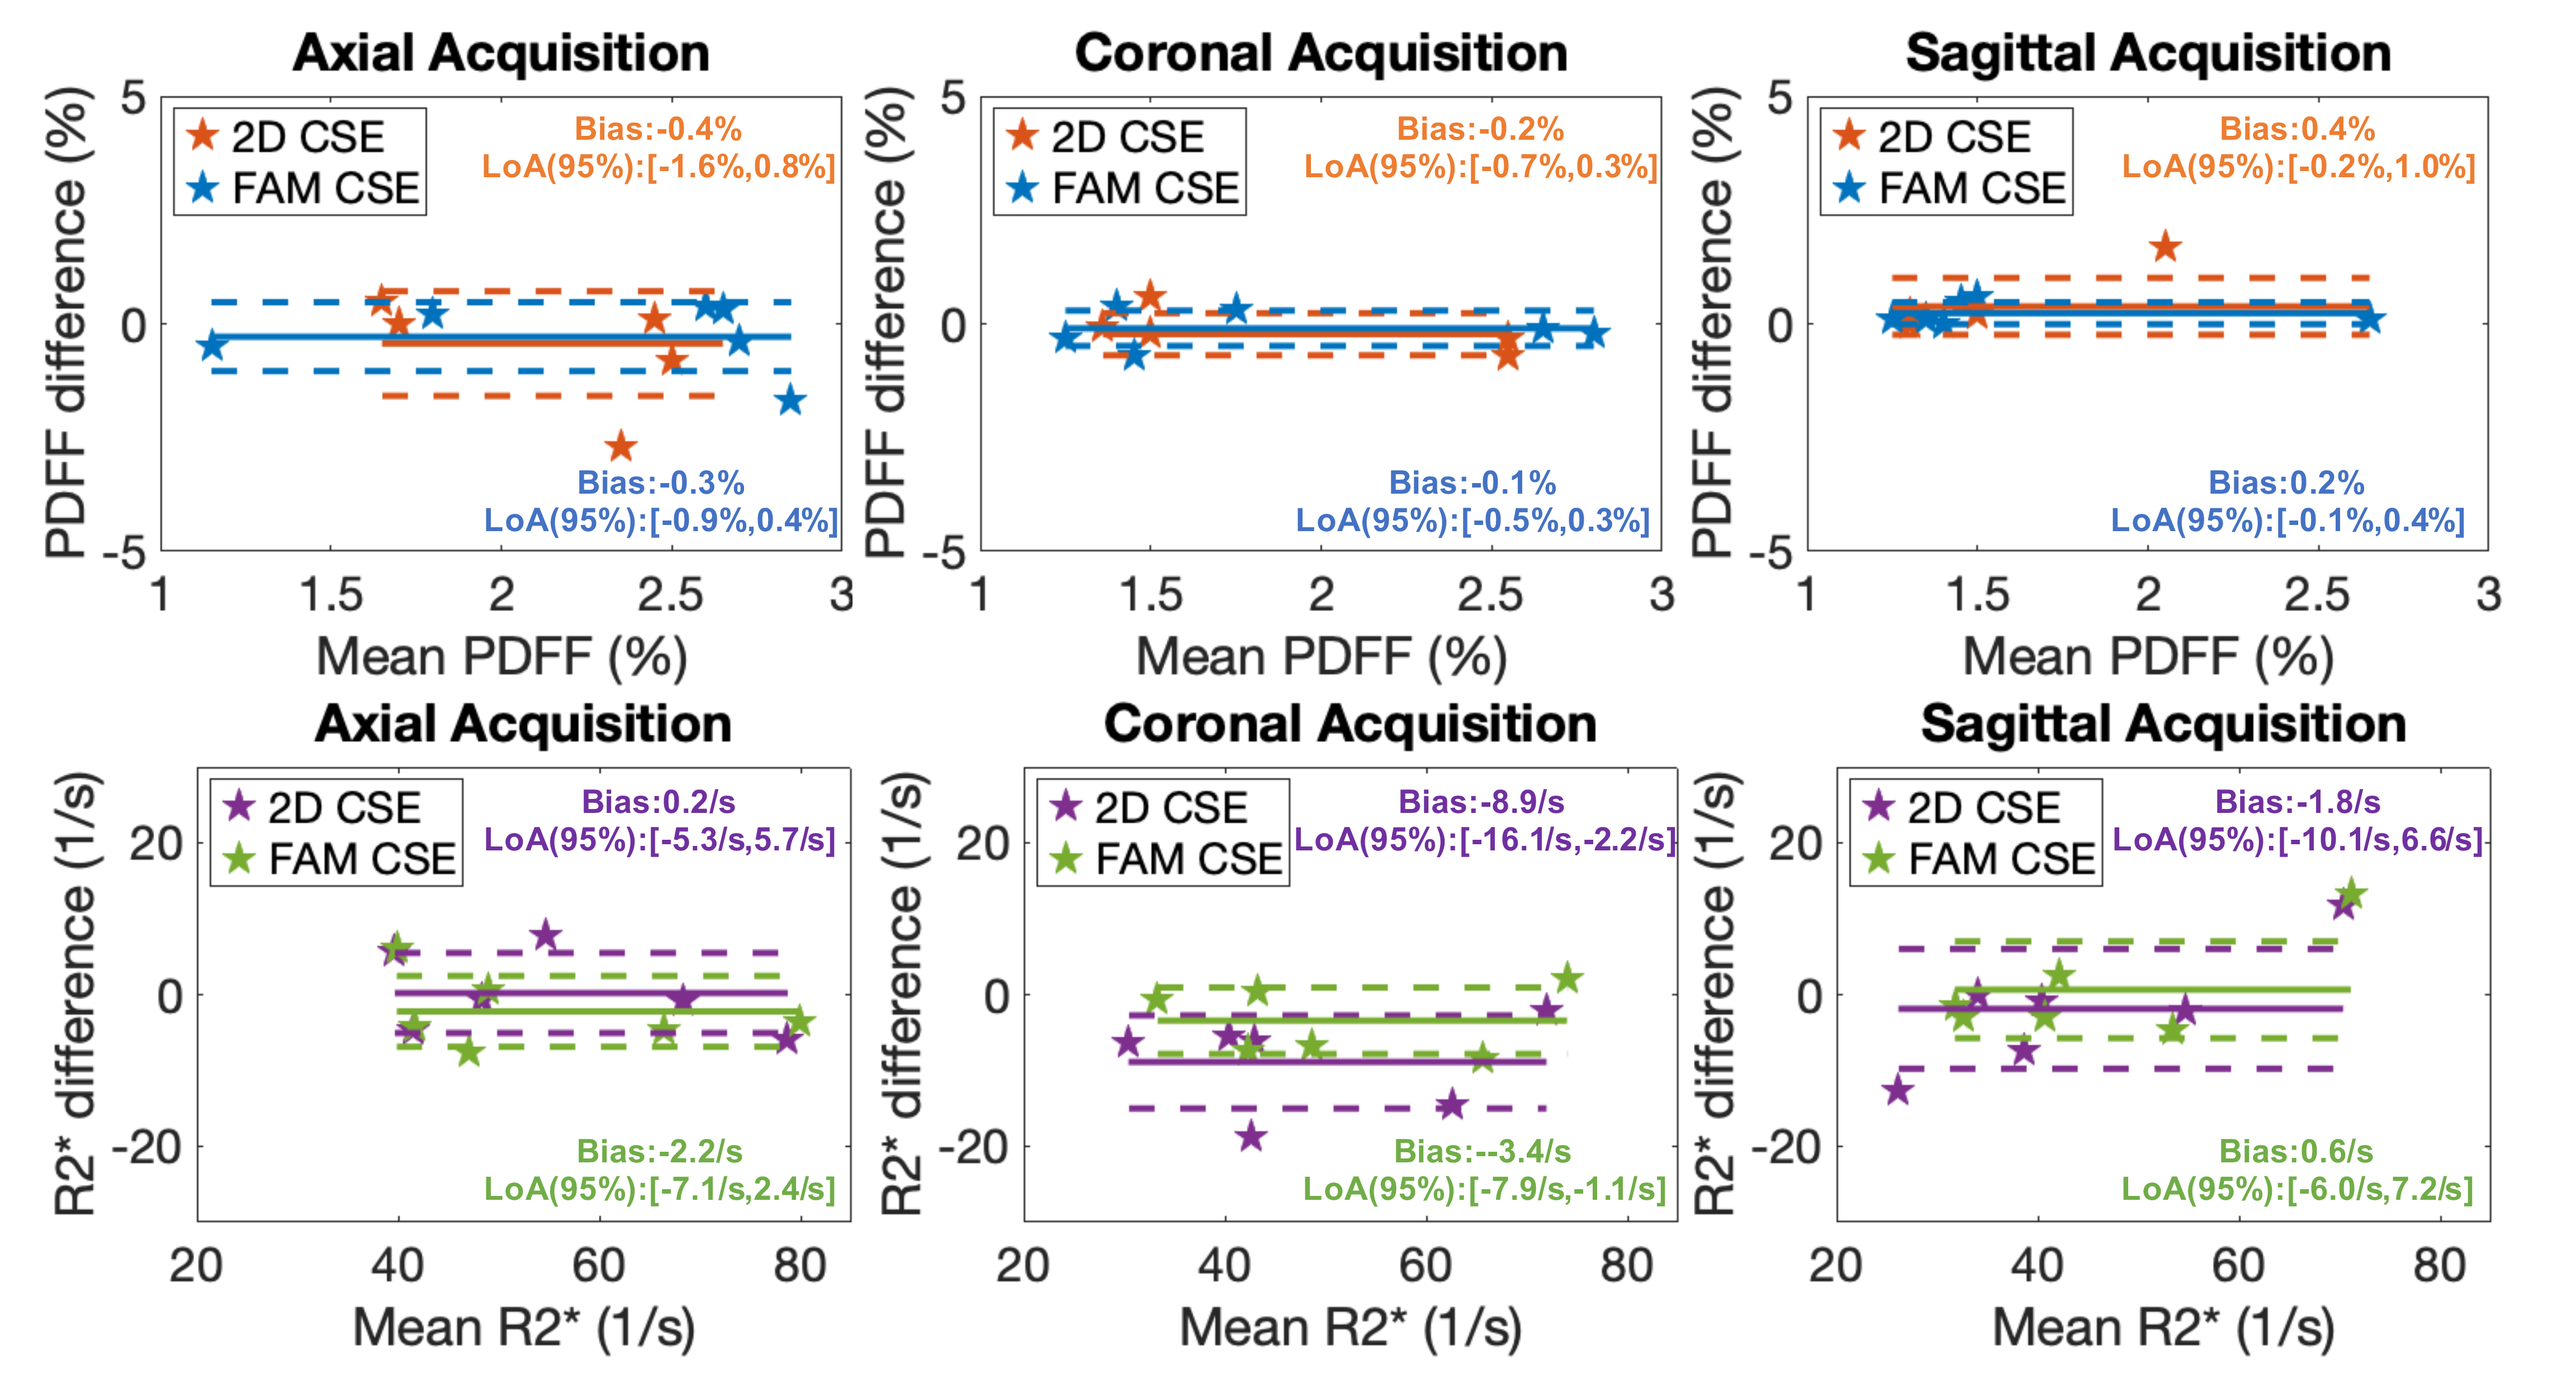
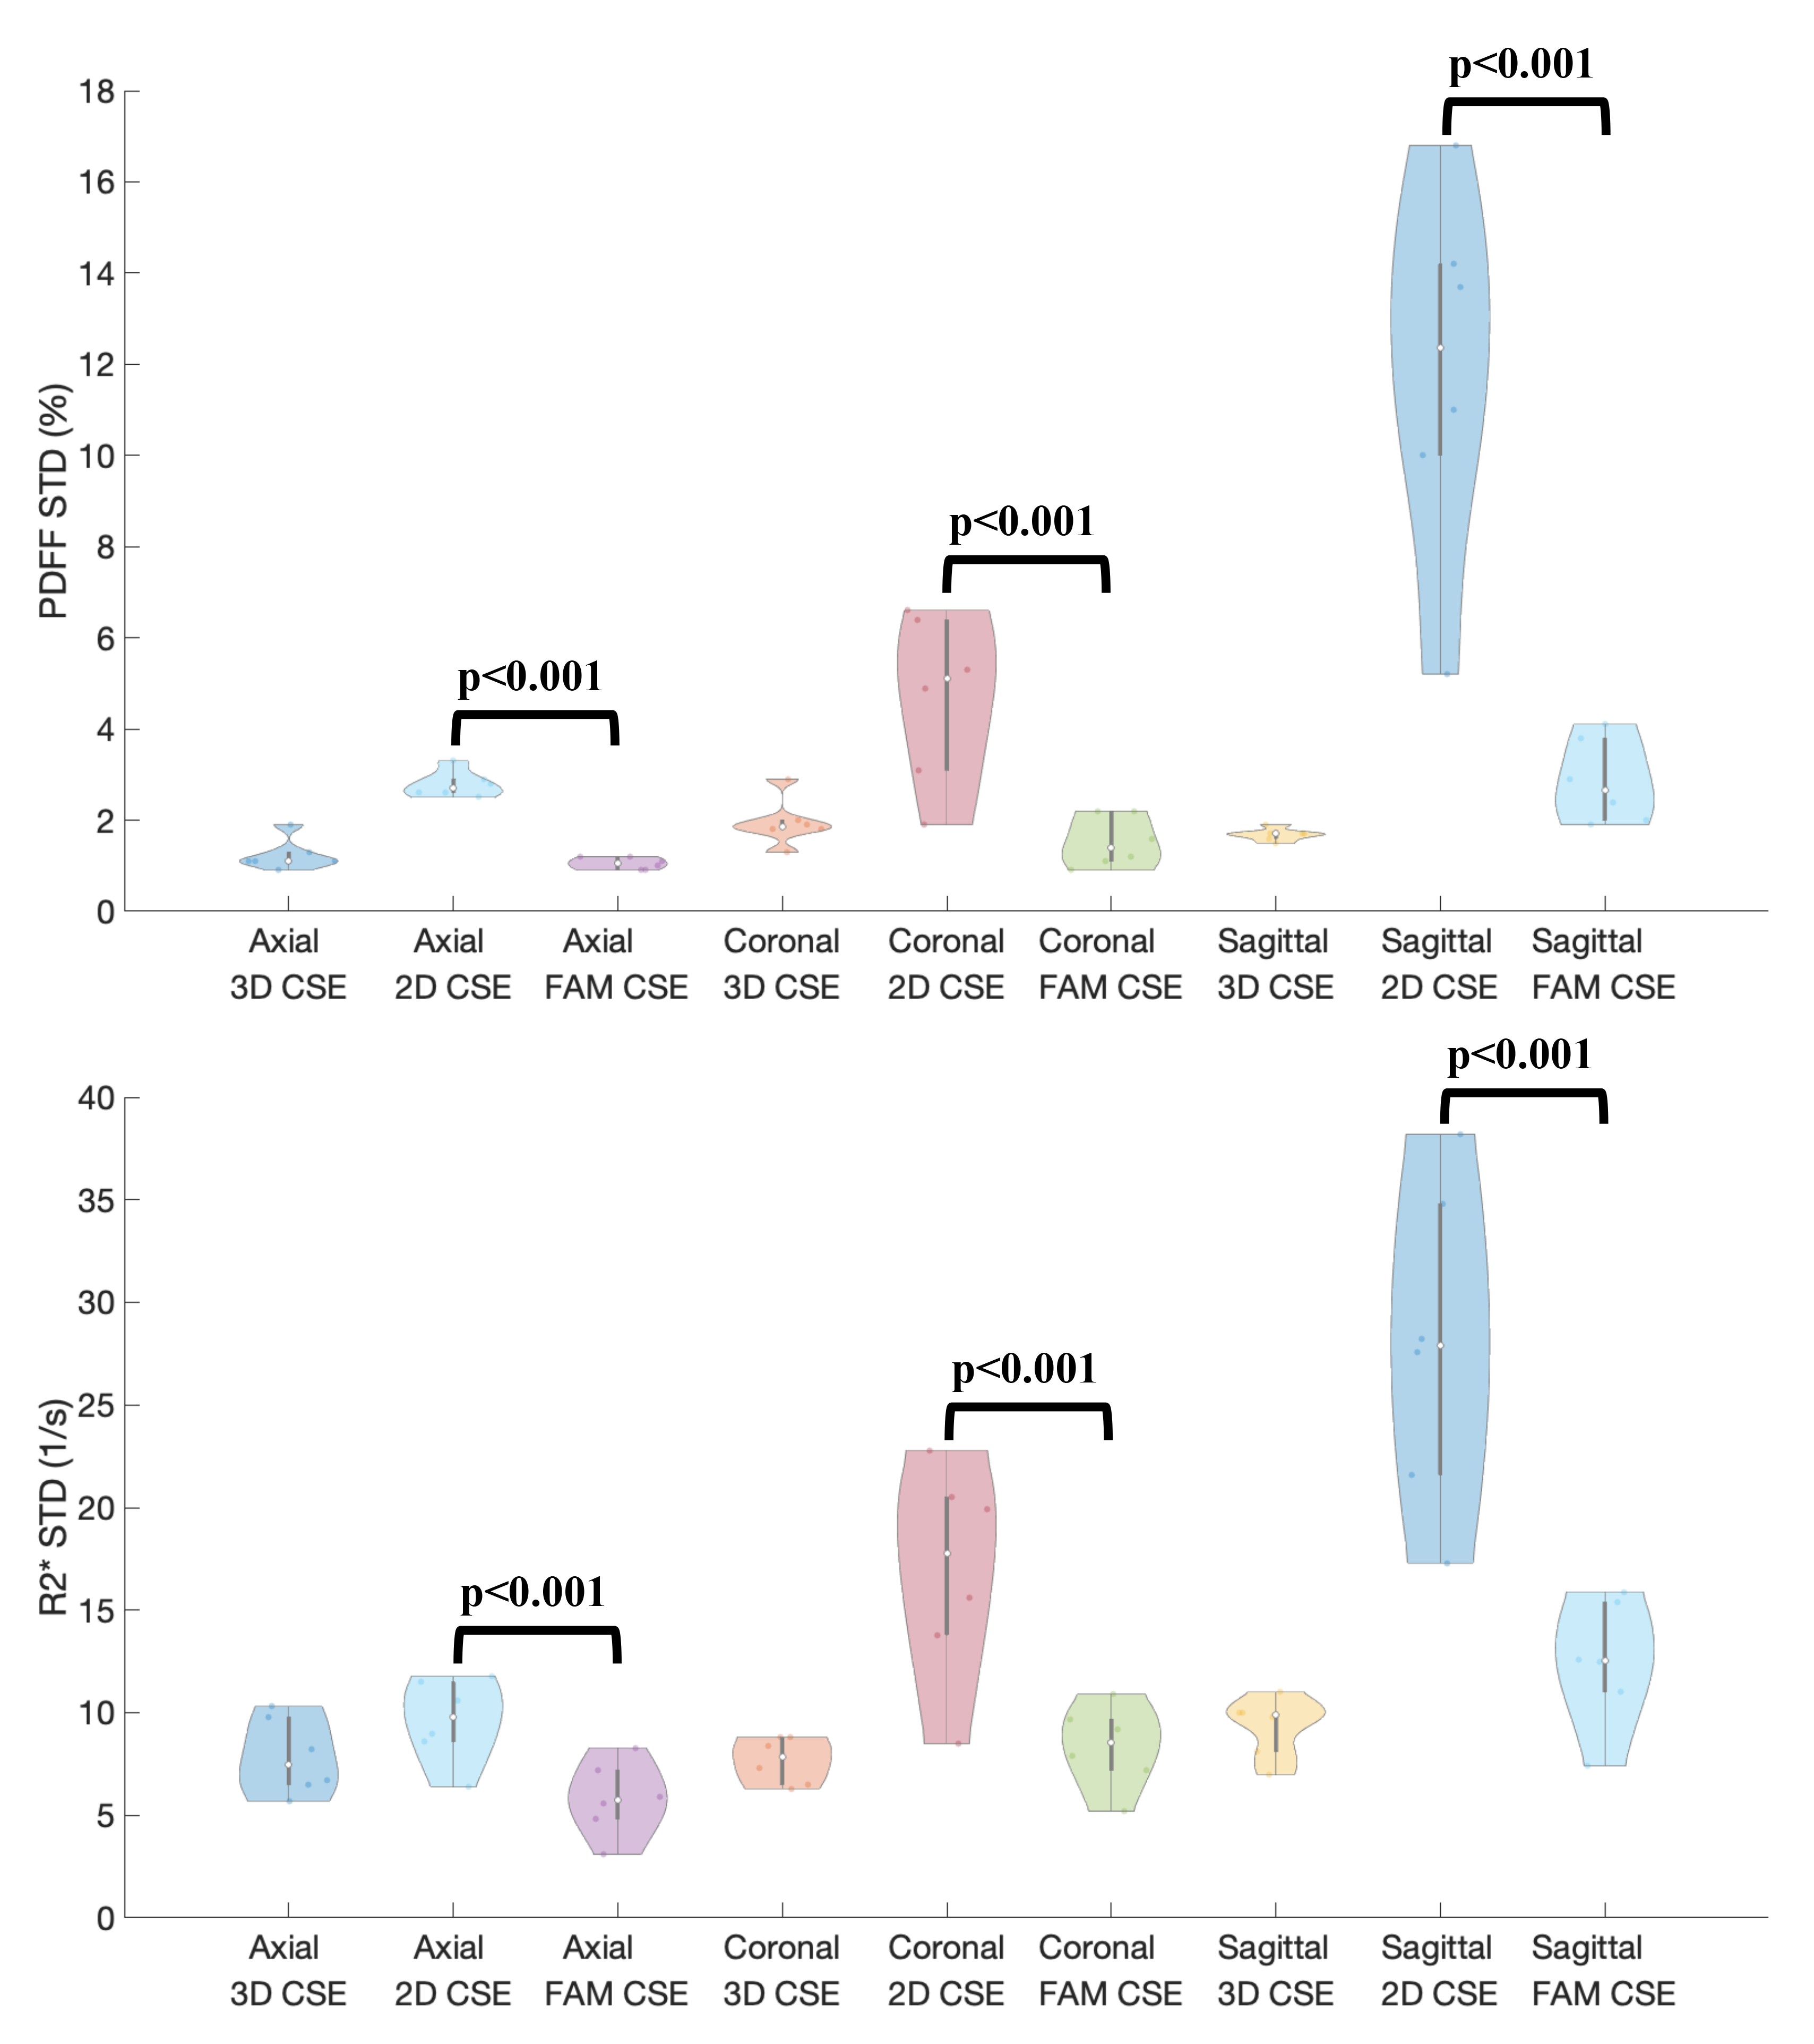
Figure 3 shows Bland-Altman analysis between measured PDFF/R2* from 2D techniques (2D CSE and FAM CSE) and reference PDFF/R2* (3D CSE) in all three orientations. Low bias in PDFF/R2* was observed for both 2D CSE and FAM CSE techniques. Significantly lower standard deviation in PDFF/R2* maps was observed in FAM CSE compared to 2D CSE in all orientations (Figure 4). Using low standard deviation as a surrogate measure of high SNR, FAM CSE shows higher SNR performance than 2D CSE for both PDFF and R2* in all orientations.
Discussion
We have optimized the 2D FAM CSE acquisition and estimated liver motion for axial, coronal, and sagittal orientations. Motion estimation results show that during free-breathing, the liver moved primarily in the S/I direction, as reported in multiple previous studies9–11. Importantly, the optimized 2D FAM CSE methods along coronal/sagittal orientations may enable robust free-breathing liver PDFF and R2* mapping without respiratory gating or triggering, and while minimizing missed liver tissue.This study has several limitations. A small number of healthy volunteers were studied, with relatively low PDFF and low R2* in the liver. Also, these healthy volunteers were able to sustain a breath-hold for the 3D CSE acquisition. Thus, further studies involving patients with liver diseases (i.e., steatosis or iron overload) are needed. Furthermore, detailed statistical analysis to evaluate the difference between coronal and sagittal acquisitions is also needed.
In summary, we optimized a recent 2D FAM CSE technique for coronal and sagittal orientations to enable accurate and reliable whole-liver PDFF and R2* quantification during free-breathing.
Acknowledgements
The authors wish to acknowledge support from the NIH (R01‐DK117354, R01‐DK100651, and R01‐DK088925). In addition, GE Healthcare and Bracco Diagnostics provide research support to the University of Wisconsin-Madison.References
1. Hines CDG, Frydrychowicz A, Hamilton G, et al. T1 Independent, T2∗ Corrected Chemical Shift Based Fat–Water Separation With Multi-peak Fat Spectral Modeling Is an Accurate and Precise Measure of Hepatic Steatosis. J Magn Reson Imaging JMRI. 2011;33(4):873-881. doi:10.1002/jmri.225142.
2. Pooler BD, Hernando D, Ruby JA, Ishii H, Shimakawa A, Reeder SB. Validation of a motion-robust 2D sequential technique for quantification of hepatic proton density fat fraction during free breathing. J Magn Reson Imaging. 2018;48(6):1578-1585. doi:10.1002/jmri.260563.
3. Motosugi U, Hernando D, Bannas P, et al. Quantification of Liver Fat With Respiratory-Gated Quantitative Chemical Shift Encoded MRI. J Magn Reson Imaging JMRI. 2015;42(5):1241-1248. doi:10.1002/jmri.248964.
4. Reeder SB, Sirlin C. Quantification of Liver Fat with Magnetic Resonance Imaging. Magn Reson Imaging Clin N Am. 2010;18(3):337-357. doi:10.1016/j.mric.2010.08.0135.
5. Reeder SB, Hu HH, Sirlin CB. Proton Density Fat-Fraction: A Standardized MR-Based Biomarker of Tissue Fat Concentration. J Magn Reson Imaging JMRI. 2012;36(5):1011-1014. doi:10.1002/jmri.237416.
6. Yokoo T, Bydder M, Hamilton G, et al. Nonalcoholic Fatty Liver Disease: Diagnostic and Fat-Grading Accuracy of Low-Flip-Angle Multiecho Gradient-Recalled-Echo MR Imaging at 1.5 T. Radiology. 2009;251(1):67-76. doi:10.1148/radiol.25110806667.
7. Zhao R, Zhang Y, Wang X, et al. Motion-robust, high-SNR liver fat quantification using a 2D sequential acquisition with a variable flip angle approach. Magn Reson Med. n/a(n/a). doi:10.1002/mrm.282638.
8. Hernando D, Kellman P, Haldar JP, Liang Z-P. Robust Water/Fat Separation in the Presence of Large Field Inhomogeneities Using a Graph Cut Algorithm. Magn Reson Med Off J Soc Magn Reson Med Soc Magn Reson Med. 2010;63(1):79-90. doi:10.1002/mrm.221779.
9. Bussels B, Goethals L, Feron M, et al. Respiration-induced movement of the upper abdominal organs: a pitfall for the three-dimensional conformal radiation treatment of pancreatic cancer. Radiother Oncol. 2003;68(1):69-74. doi:10.1016/S0167-8140(03)00133-610.
10. Brandner ED, Wu A, Chen H, et al. Abdominal organ motion measured using 4D CT. Int J Radiat Oncol. 2006;65(2):554-560. doi:10.1016/j.ijrobp.2005.12.04211.
11. Hallman JL, Mori S, Sharp GC, Lu H-M, Hong TS, Chen GTY. A Four-Dimensional Computed Tomography Analysis of Multiorgan Abdominal Motion. Int J Radiat Oncol. 2012;83(1):435-441. doi:10.1016/j.ijrobp.2011.06.1970
Figures