1868
Pancreatic fatty infiltration and iron in thalassemia major1MRI Unit, Fondazione G. Monasterio CNR-Regione Toscana, Pisa, Italy, 2Policlinico "Paolo Giaccone", Palermo, Italy, 3Ospedale "Sant'Eugenio", Roma, Italy, 4Azienda Ospedaliera "S. Maria Misericordia" di Perugia, Perugia, Italy, 5Ospedale “G. Da Saliceto”, Piacenza, Italy, 6Ospedale “Di Venere”, Bari, Italy
Synopsis
Pancreatic fatty replacement is present in more than three-quarters of patients with thalassemia major and it is associated with ageing. Pancreatic fatty replacement is associated to pancreatic iron overload, with a pancreatic T2* value <18 predicting its presence with a sensitivity of 75.6% and a specificity of 85.4%.
Introduction
Fatty infiltration in the pancreatic tissue is a common finding in the general population and patients with iron overload (IO).1,2 The aim of this study was to assess the extent of pancreatic fat infiltration detected by Magnetic Resonance Imaging (MRI) and its correlation with demographics and IO in patients with thalassemia major (TM).Methods
We considered 246 TM patients (37.07±11.51 years; 145 females) consecutively enrolled in the Extension-Myocardial Iron Overload in Thalassemia (E-MIOT) Network. IO was quantified by the T2* multiecho technique.2,3 Pancreatic fat fraction (FF) was measured in the same sequence used for pancreatic T2* assessment by using an appropriate signal fitting model, largely validated in the liver, able to separate the fat signal from the water contribution.4,5 Pancreatic T2* and FF were calculated over head, body and tail, and global value was the mean.Results
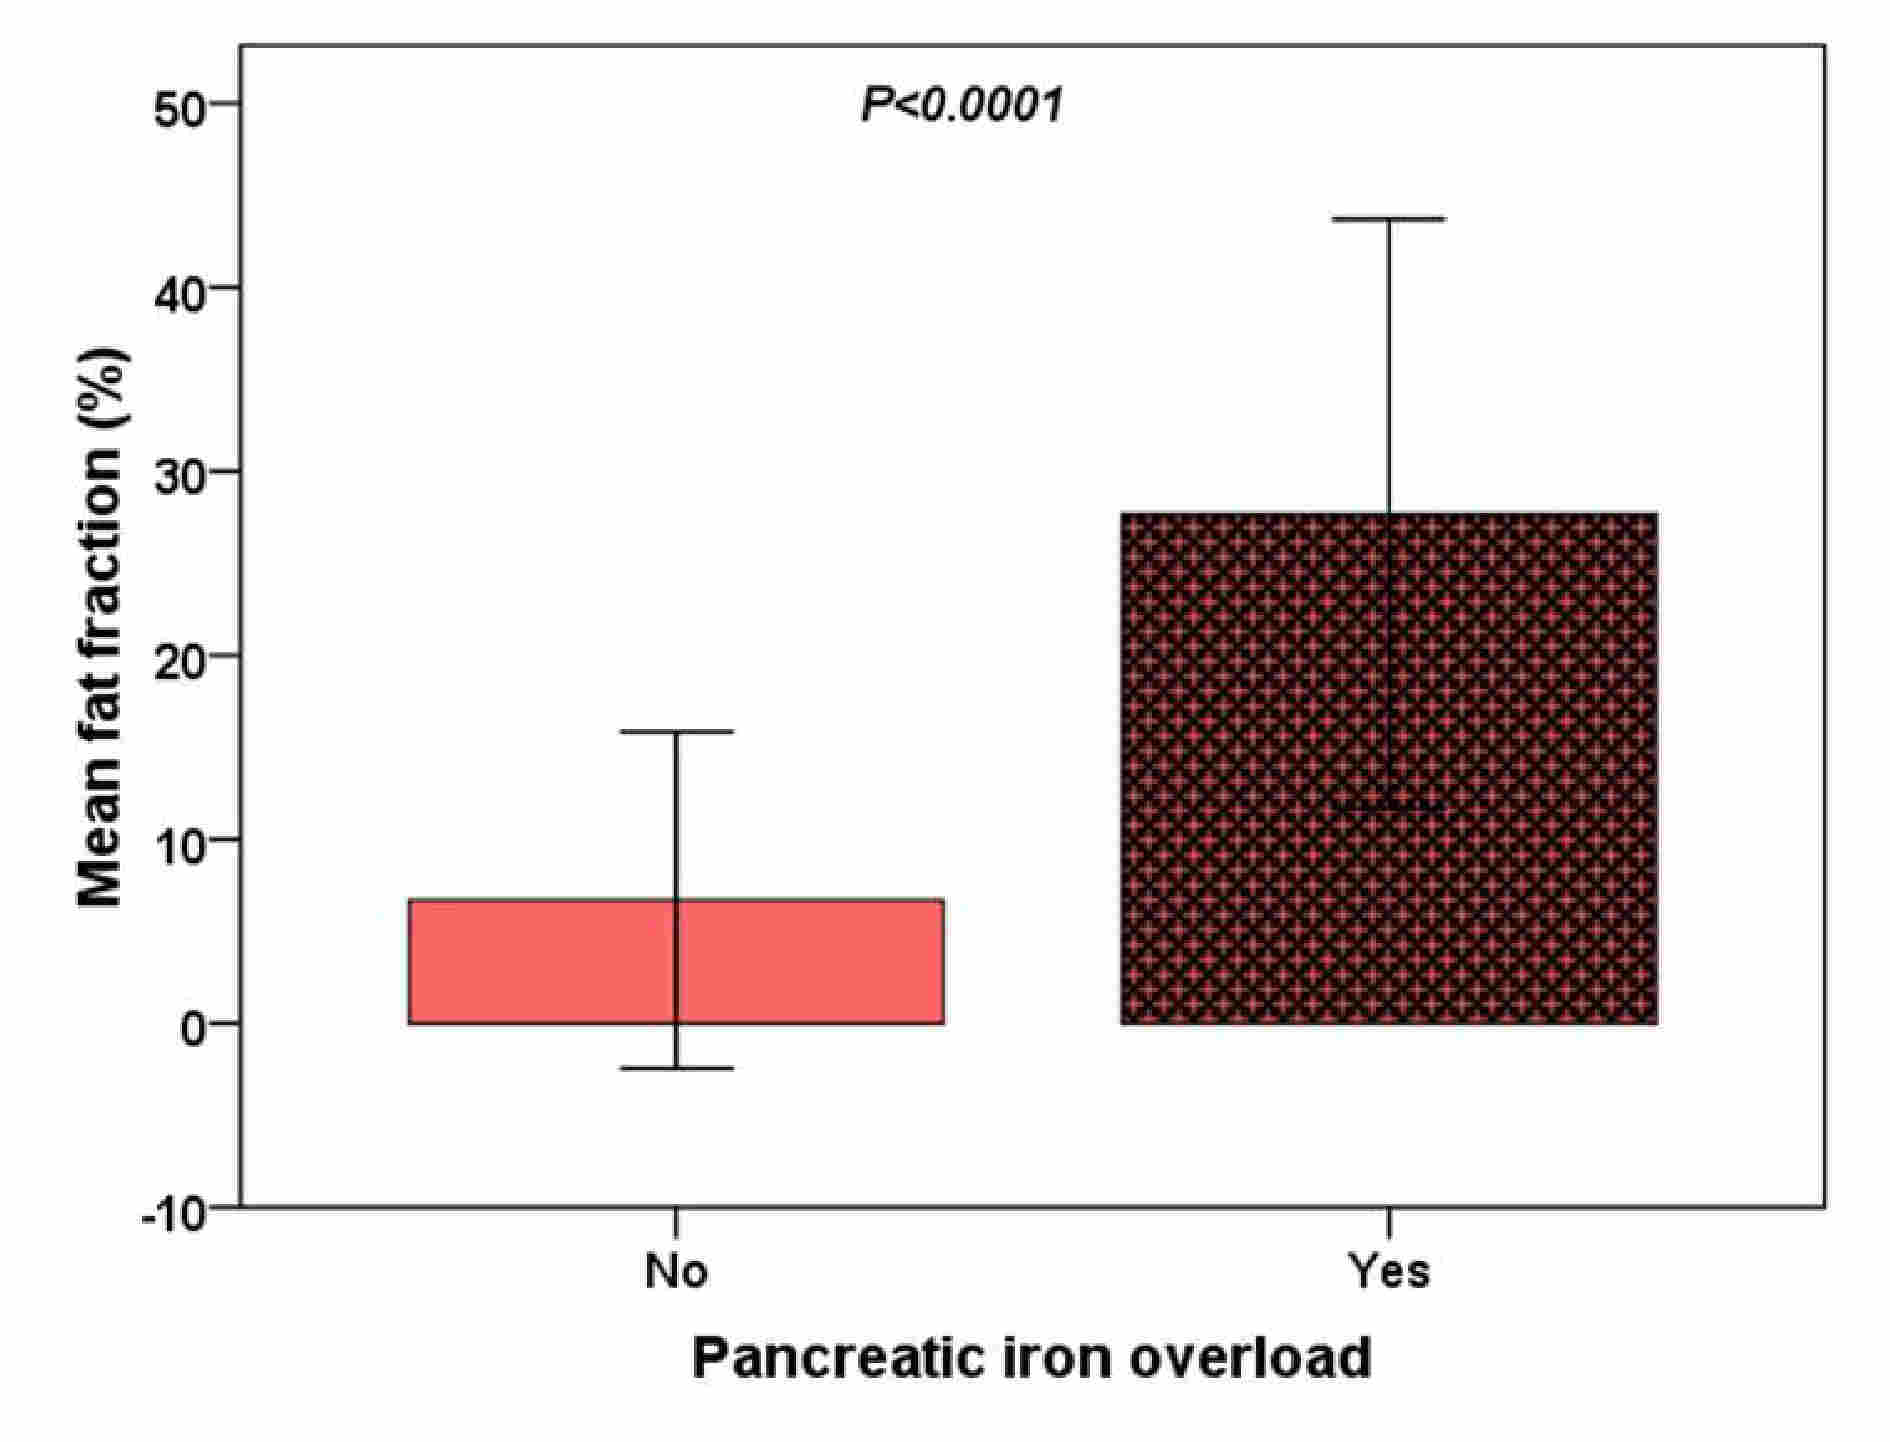
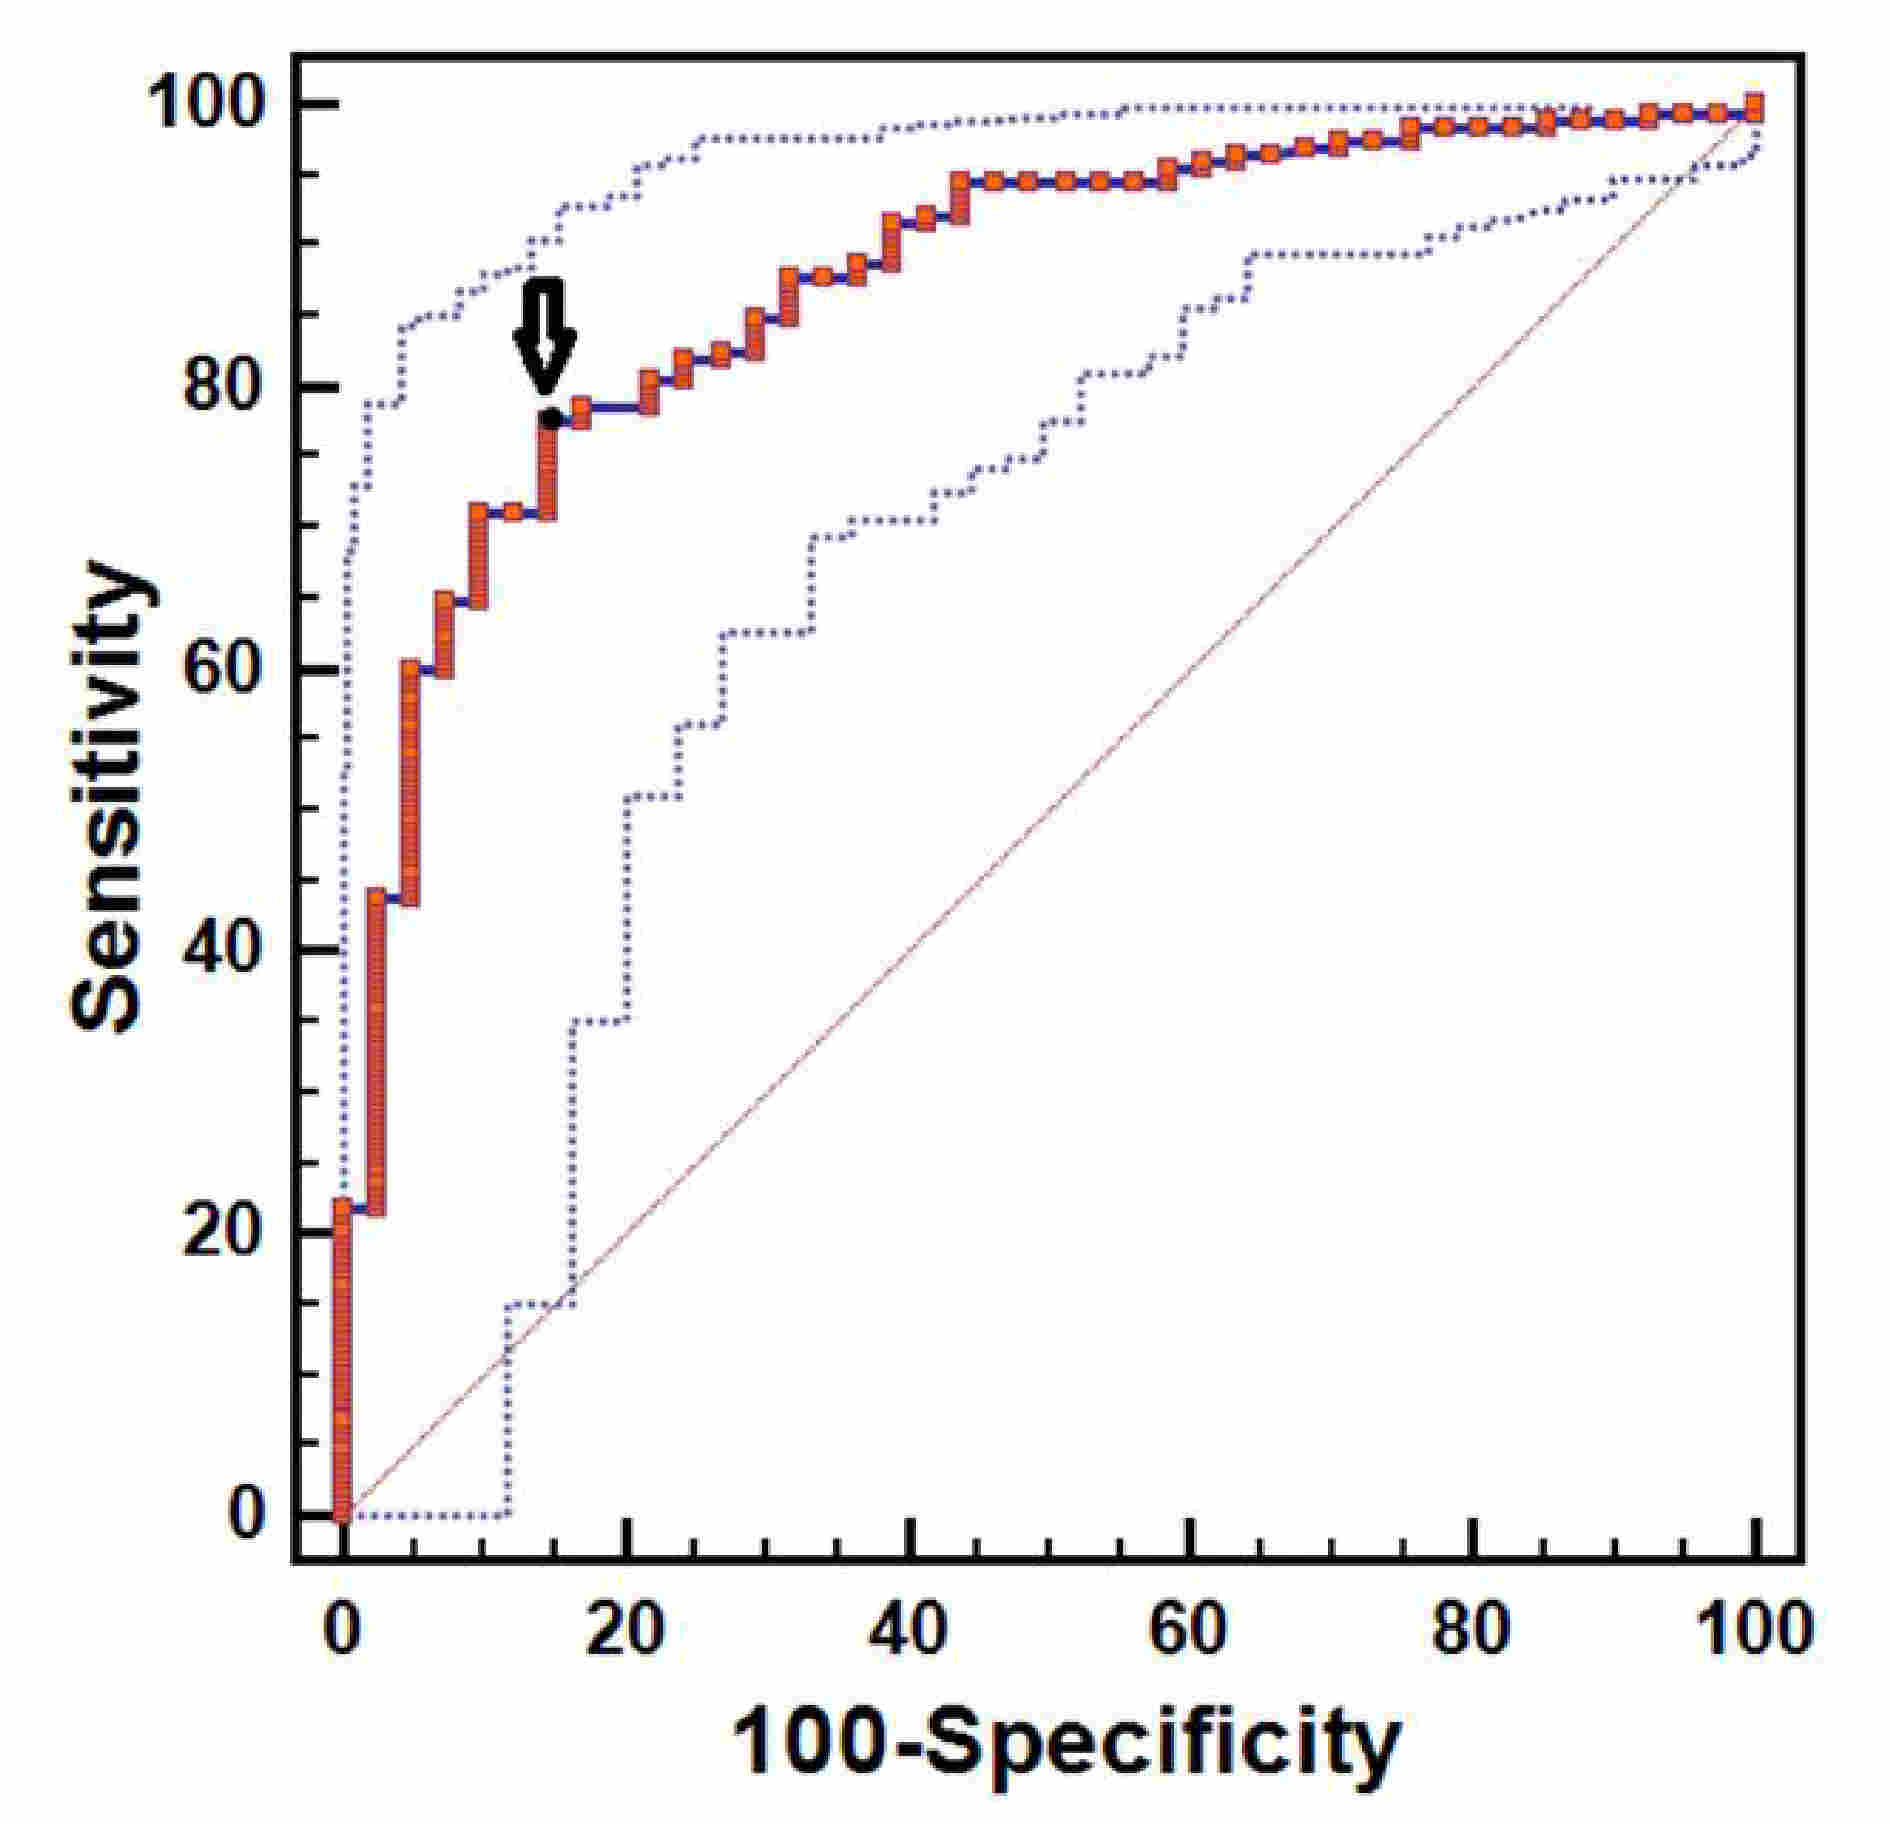
Mean pancreatic FF was 24.69±16.91% (range: 0-67.45%). Two-hundred and five patients (83.3%) had fatty replacement, indicated by a FF>6.2% (normal pancreatic fat cut-off point by a meta-analysis). No difference was detected among FF values over head, body and tail. Pancreatic FF was comparable between males and females (23.40±16.47% vs 25.59±17.21%; P=0.263) but it showed a weak positive correlation with age (R=0.324, P<0.0001) and body mass index (R=0.166 P=0.010).The FF was not correlated to serum ferritin levels. A significant inverse correlation was detected between pancreatic FF and T2* values (R=-0.622; P<0.0001). Two-hundred and eleven patients (85.8%) had a global pancreas T2*<26 ms and they showed a significant higher FF (Figure 1). The 94.1% of patients with fatty replacement had pancreatic iron overload. At receiver operator characteristic (ROC) analysis a global pancreas T2*<18.02 predicted the presence of fatty replacement with a sensitivity of 75.6% and a specificity of 85.4% (P<0.0001). The area under the curve was 0.87 (95% Confidence intervals: 0.83-0.91) (Figure 2).
The FF was significantly higher in patients with hepatic IO (MRI liver iron concentration>3 mg/g dw; 45.9%) than in patients without hepatic IO (27.46±17.17% vs 22.34±16.39%; P=0.020). The 9.0% of patients had myocardial IO (global heart T2*<20 ms) and they showed a significantly higher FF (41.10±17.13% vs 22.89±15.82%; P<0.0001).
Conclusions
In TM pancreatic fatty replacement is a frequent clinical entity, present in more than three-quarters of patients, associated with aging. Pancreatic fatty replacement can be predicted by a pancreatic T2* value <18 ms and it is correlated also to hepatic and cardiac IO.Acknowledgements
We would like to thank all the colleagues involved in the E-MIOT project (https://emiot.ftgm.it/). We thank Claudia Santarlasci for her skillful secretarial work and all patients for their cooperation.References
1. Singh RG, Yoon HD, Wu LM, Lu J, Plank LD, Petrov MS. Ectopic fat accumulation in the pancreas and its clinical relevance: A systematic review, meta-analysis, and meta-regression. Metabolism 2017;69:1-13.
2. Meloni A, De Marchi D, Positano V, et al. Accurate estimate of pancreatic T2* values: how to deal with fat infiltration. Abdom Imaging 2015;40(8):3129-3136.
3. Restaino G, Meloni A, Positano V, et al. Regional and global pancreatic T*(2) MRI for iron overload assessment in a large cohort of healthy subjects: Normal values and correlation with age and gender. Magn Reson Med 2011;65(3):764-769.
4. Hernando D, Kramer JH, Reeder SB. Multipeak fat-corrected complex R2* relaxometry: theory, optimization, and clinical validation. Magn Reson Med 2013;70(5):1319-1331.
5. Hernando D, Kuhn JP, Mensel B, et al. R2* estimation using "in-phase" echoes in the presence of fat: the effects of complex spectrum of fat. J Magn Reson Imaging 2013;37(3):717-726.
Figures