1866
Pancreatic fat fraction is a marker of altered glucidic metabolism in thalassemia major1MRI Unit, Fondazione G. Monasterio CNR-Regione Toscana, Pisa, Italy, 2Policlinico "Paolo Giaccone", Palermo, Italy, 3Ospedale “G. Da Saliceto”, Piacenza, Italy, 4Policlinico "G. Martino", Messina, Italy, 5P.O. Misericordia Grosseto, Grosseto, Italy, 6A.S.L. di Bari, Bari, Italy
Synopsis
Pancreatic fat fraction should be included in the routine MRI examination of thalassemia major patients and employed as an index of increased risk for development of impaired glucose tolerance and overt diabetes mellitus.
Introduction
Fatty replacement of the pancreas is common in thalassemia major (TM) patients and it may represent the end and severe stage of pancreatic disease.1In the present multicenter study we explored systematically the link between pancreatic fat fraction (FF) quantified by Magnetic Resonance Imaging (MRI) and glucidic metabolism in a cohort of well-treated TM patients.
Methods
We considered 184 TM patients (36.19±11.32 years; 106 females) consecutively enrolled in the Extension-Myocardial Iron Overload in Thalassemia (E-MIOT) Network.Gradient-echo multi-echo T2* images covering the whole pancreas were analyzed using an appropriate fitting model that, within each defined region of interest (head, body, and tail), separated the fat signal from the water contribution.2 The global FF was obtained by averaging the FF values in the 3 regions. The pattern of disturbances of glucose metabolism was assessed by means of the oral glucose tolerance test (OGTT).3
Results
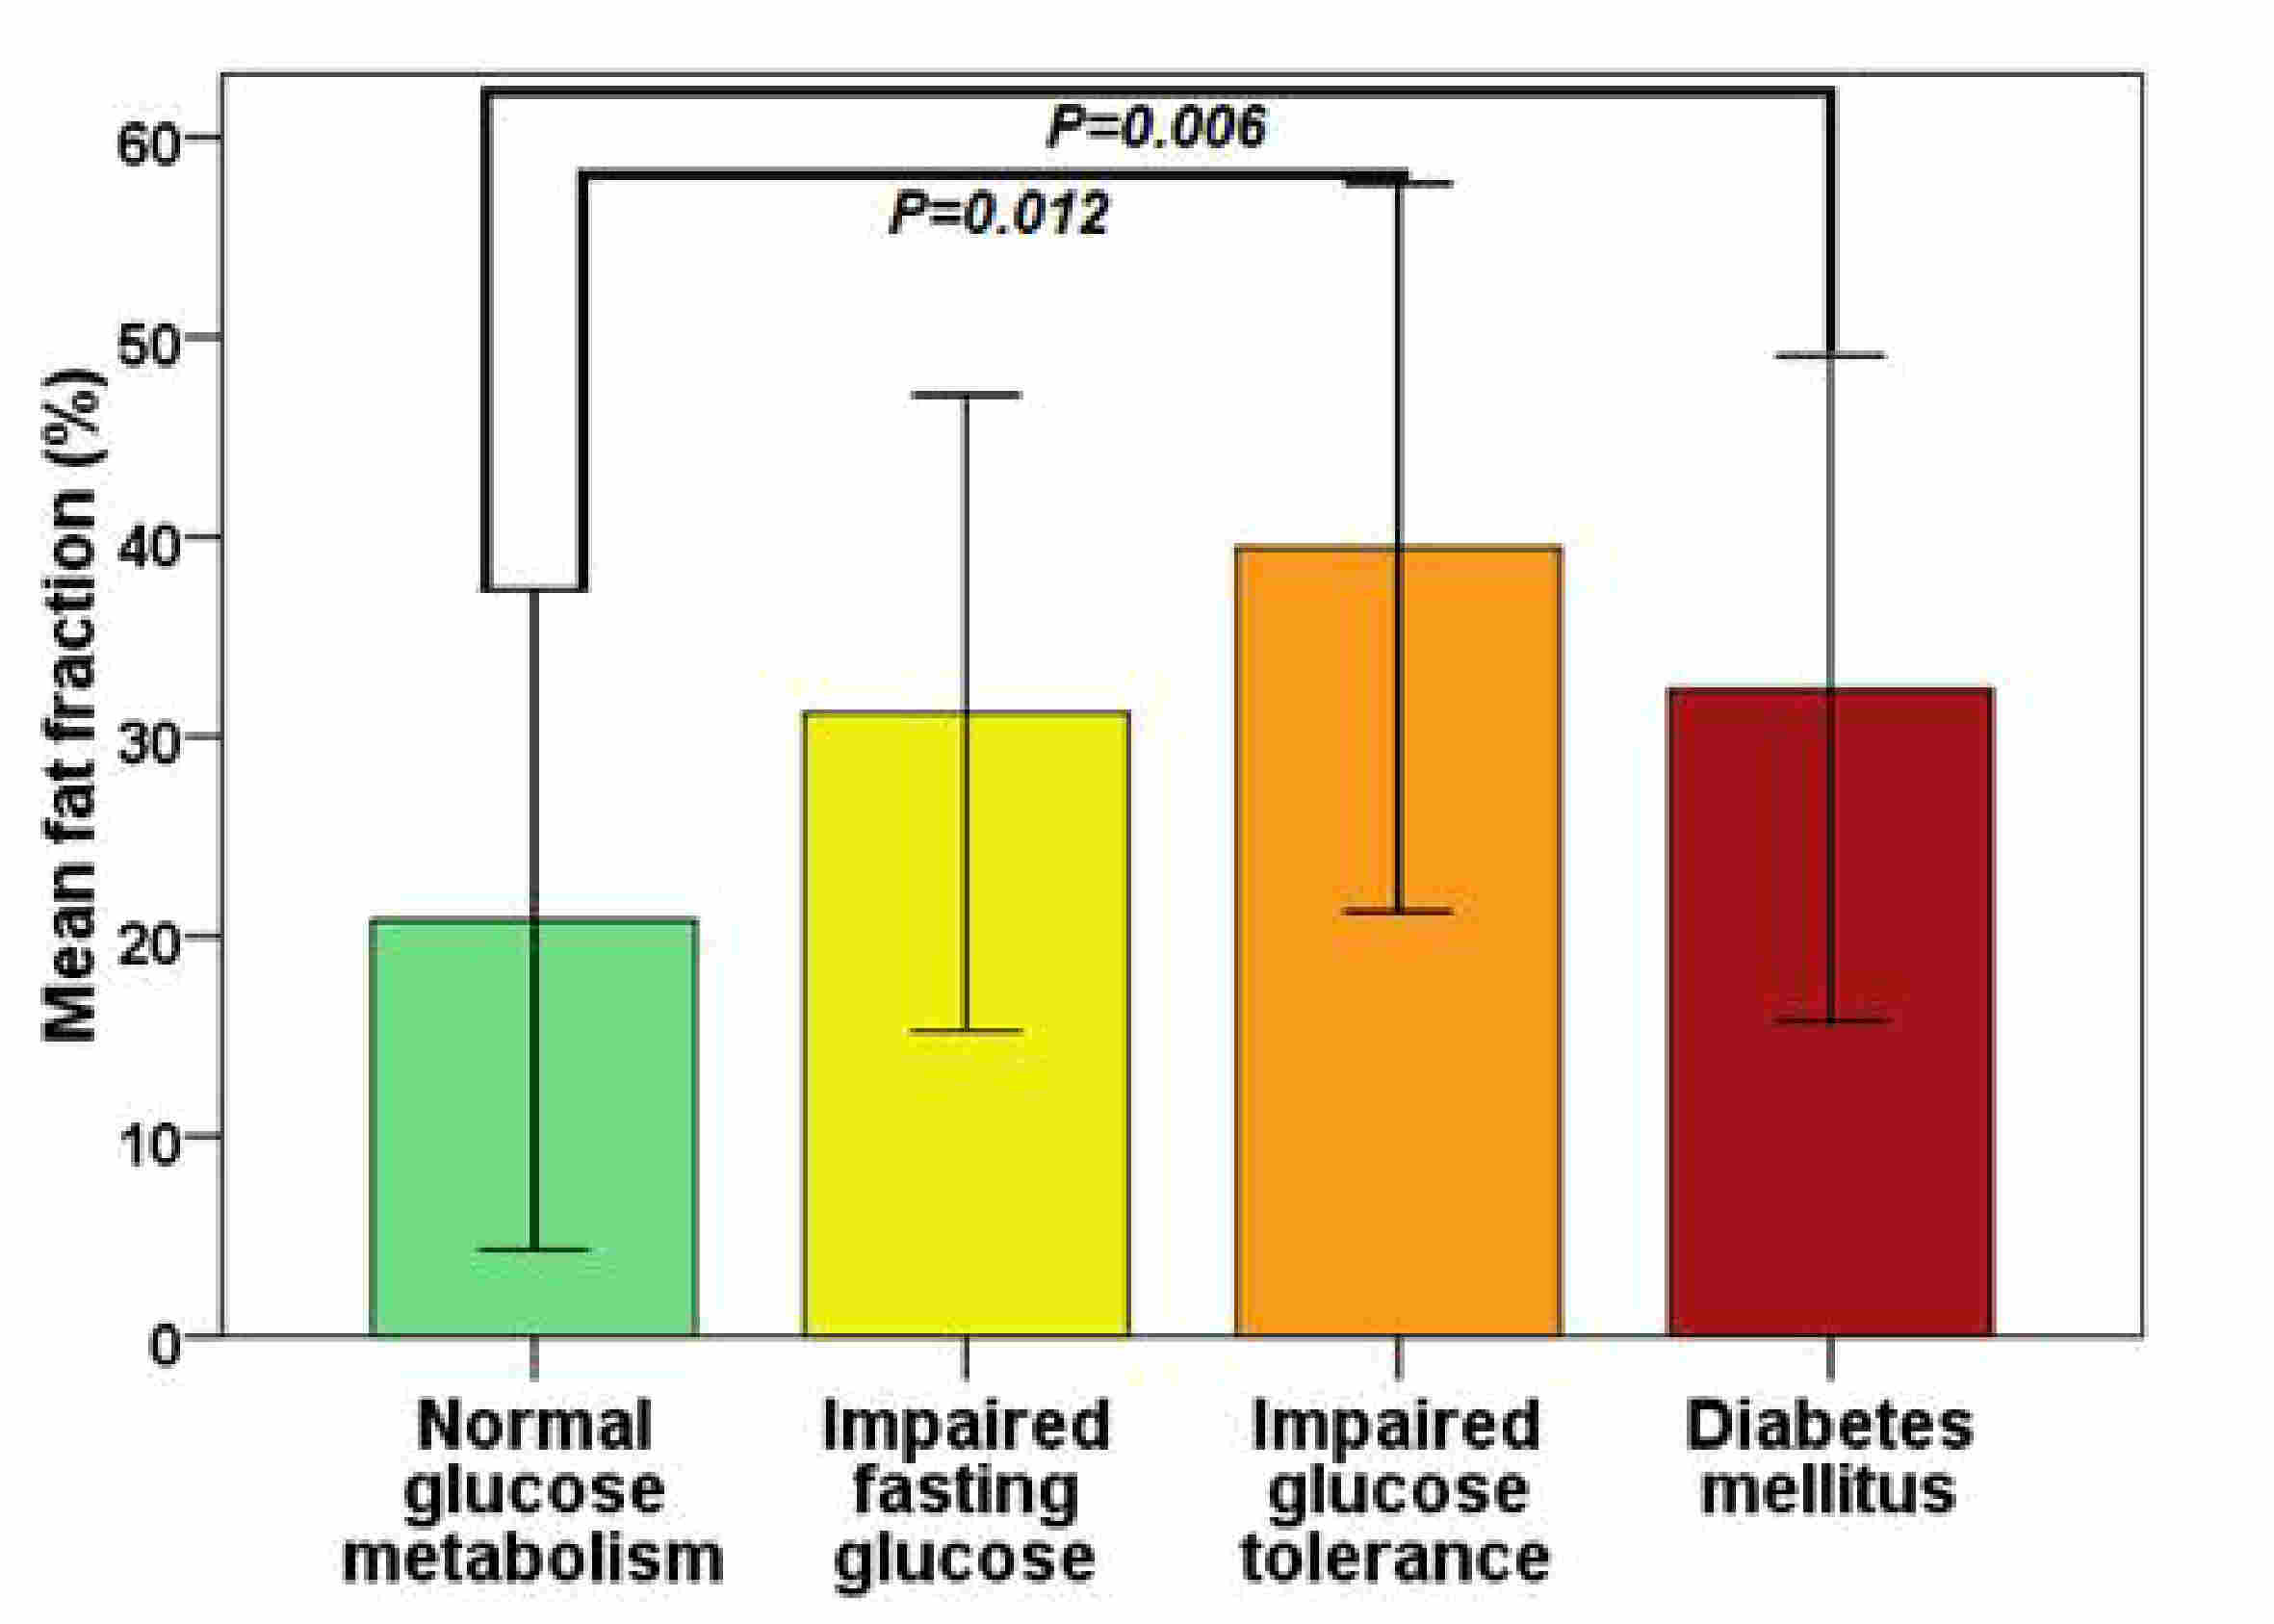
Global pancreatic FF was 24.65±17.56% (range: 0-67.45%). The global pancreatic FF showed a weak significant correlation with fasting glucose levels (R=0.301; P<0.0001), 1-hour plasma glucose levels (R=0.329; P=0.002), and 2-hour plasma glucose levels (R=0.412; P<0.0001). According to OGTT results, 129 patients (70.1%) had normal glucose tolerance (NGT), 15 (8.2%) had isolated impaired fasting glucose (IFG), 12 (6.5%) had impaired glucose tolerance (IGT), and 28 (15.2%) had diabetes mellitus (DM). Patients with NGT had a significantly lower global FF than patients with IGT (20.84±16.53% vs 39.45±18.22%; P=0.012) and patients with DM (20.84±16.53% vs 32.40±16.63%; P=0.006) (Figure 1).Receiver operator characteristic (ROC) analysis showed that a global pancreatic FF>21.15% was the optimal cutoff for predicting an abnormal OGTT (P<0.0001), with an area under the curve (AUC) of 0.71 (95% confidence intervals: 0.63-0.77). The sensitivity and the specificity were, respectively, 80.0% and 55.8%.
Conclusions
Since pancreatic FF can be easily obtained by the same T2* sequence employed for iron overload assessment, it should be included in the routine MRI examination and employed as an index of increased risk for development of IGT and overt DM in TM patients.Acknowledgements
We would like to thank all the colleagues involved in the E-MIOT project (https://emiot.ftgm.it/). We thank Claudia Santarlasci for her skillful secretarial work and all patients for their cooperation.References
1. Meloni A, De Marchi D, Positano V, et al. Accurate estimate of pancreatic T2* values: how to deal with fat infiltration. Abdom Imaging 2015;40(8):3129-3136.
2. Hernando D, Kuhn JP, Mensel B, et al. R2* estimation using "in-phase" echoes in the presence of fat: the effects of complex spectrum of fat. J Magn Reson Imaging 2013;37(3):717-726.
3. De Sanctis V, Soliman AT, Elsedfy H, et al. The ICET-A Recommendations for the Diagnosis and Management of Disturbances of Glucose Homeostasis in Thalassemia Major Patients. Mediterr J Hematol Infect Dis 2016;8(1):e2016058.
Figures