1864
The correlation between type 2 diabetes and fat fraction in liver and pancreas: a study using MR Dixon technique1Radiology department, Fujian Provincial Hospital, fuzhou, China, 2Department of Biomedical Engineering, Southern Medical University, Guangzhou, China, 3Diagnostic Imaging, SIEMENS Healthcare, Shanghai, China
Synopsis
The increased obesity leads to ectopic fat deposits in liver and pancreas. Ectopic fat deposits affect insulin resistance and blood sugar content with Type 2 Diabetes. In order to assess the relationship between obesity and ectopic fat deposits and diabetes, this study used MR Dixon technique for the quantification of liver and pancreas fat fraction (FF) in T2DM patients and healthy controls.
Introduction
Obesity increases the amount of free fatty acids in the body. When normal adipose tissue cannot withstand excess fatty acids, fat accumulates into non-adipose tissue, such as in liver and pancreas, resulting in ectopic fat deposits [1]. Previous studies [1-3] demonstrated that such ectopic fatty infiltration in the liver produces lipotoxic substances, and the high fat concentration in liver among diabetic patients affects insulin resistance, blood sugar content and metabolic control; fat deposit can also cause anatomical changes and abnormal secretion functions of the pancreas, leading to insulin resistance and blood sugar increase in the body. There is a close relationship between obesity and lipid metabolism disorders and diabetes, and thus, tissue fat quantification technique is highly required in clinical practice.The purpose of this study is to quantify FF in liver and pancreas using MR Dixon, and to further explore the differences of fat content between type 2 diabetes mellitus (T2DM) patients and healthy volunteers and the differences of fat content between obese T2DM patients and non-obese T2DM patients.Methods and Materials
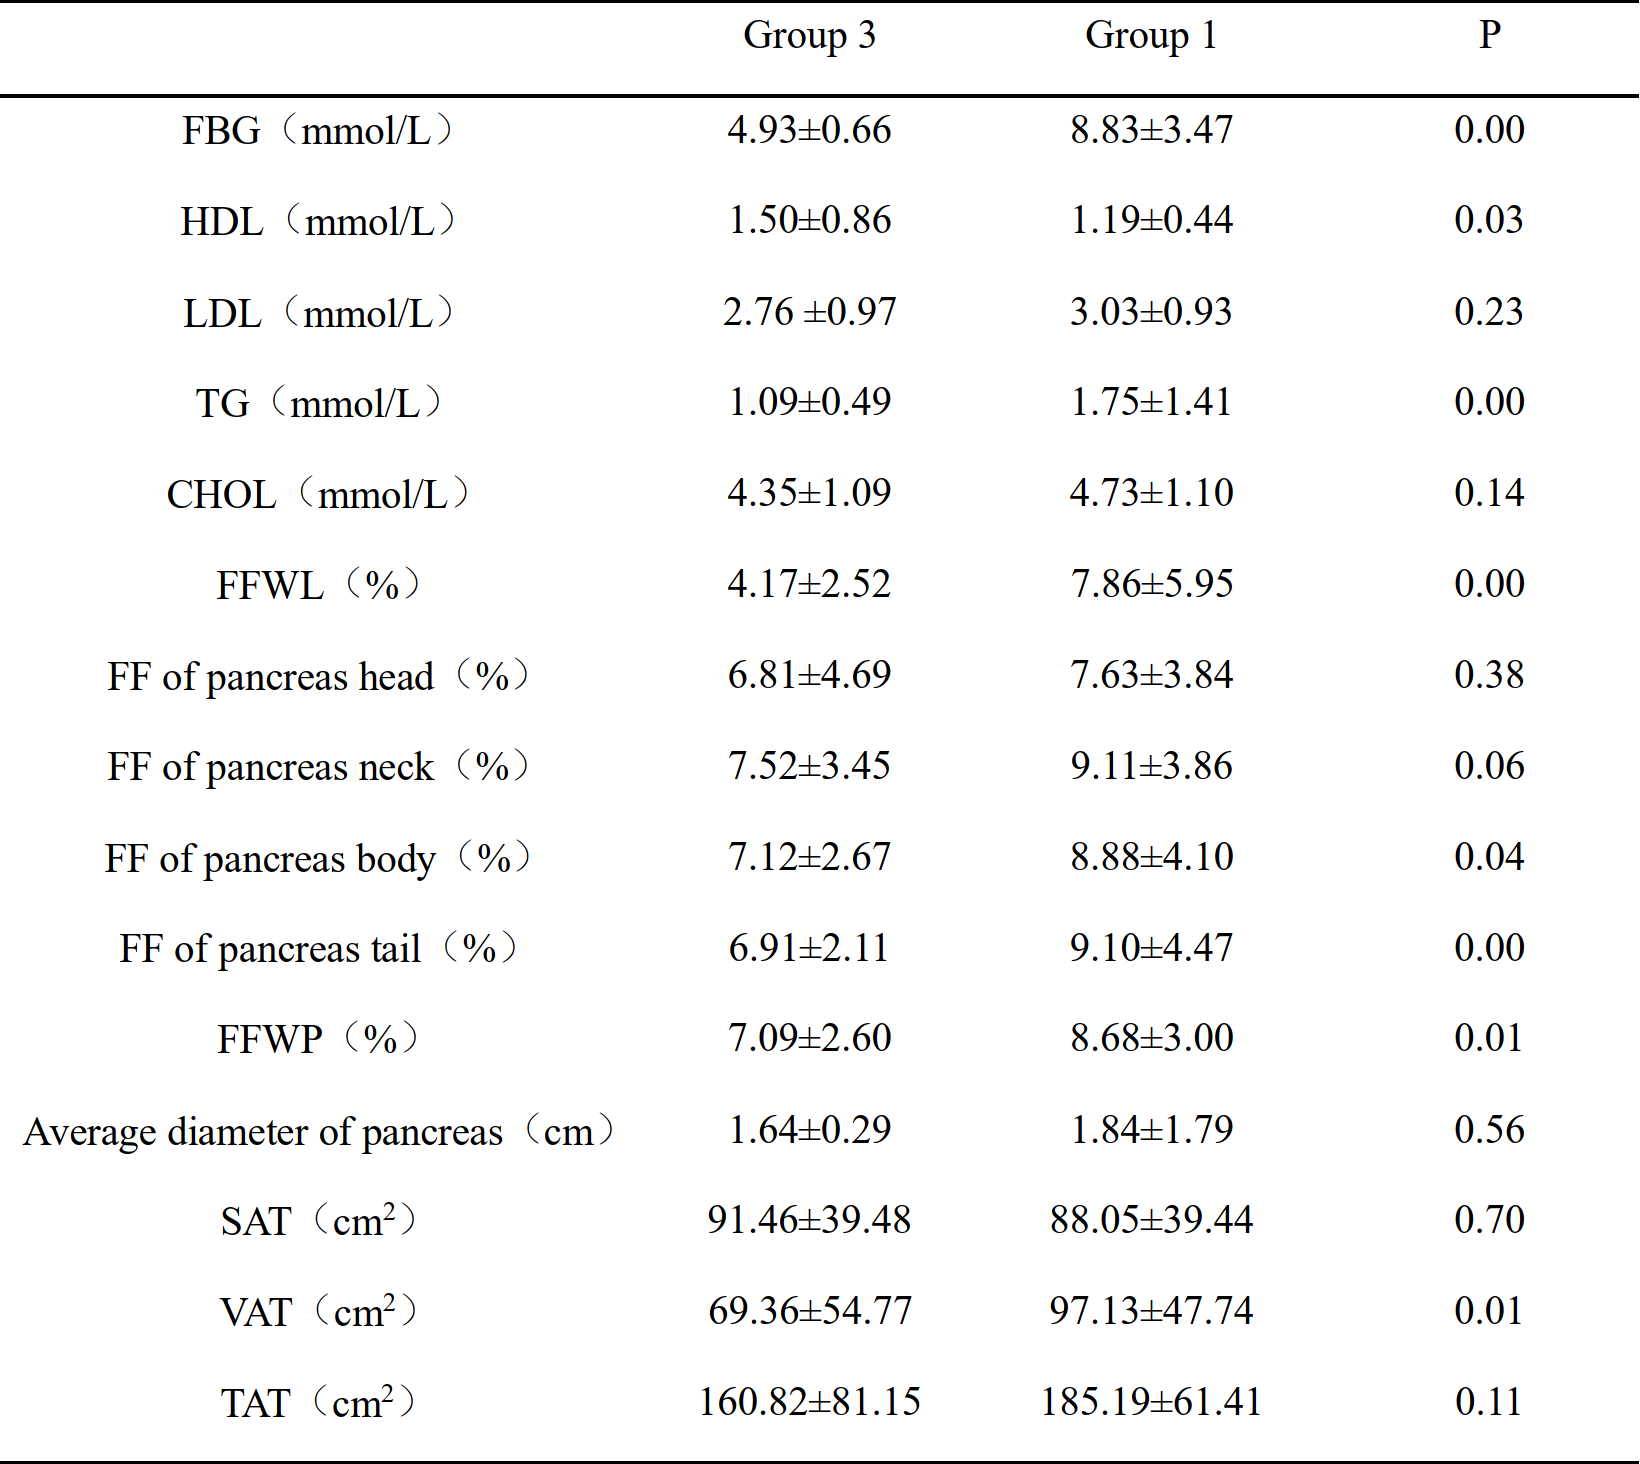
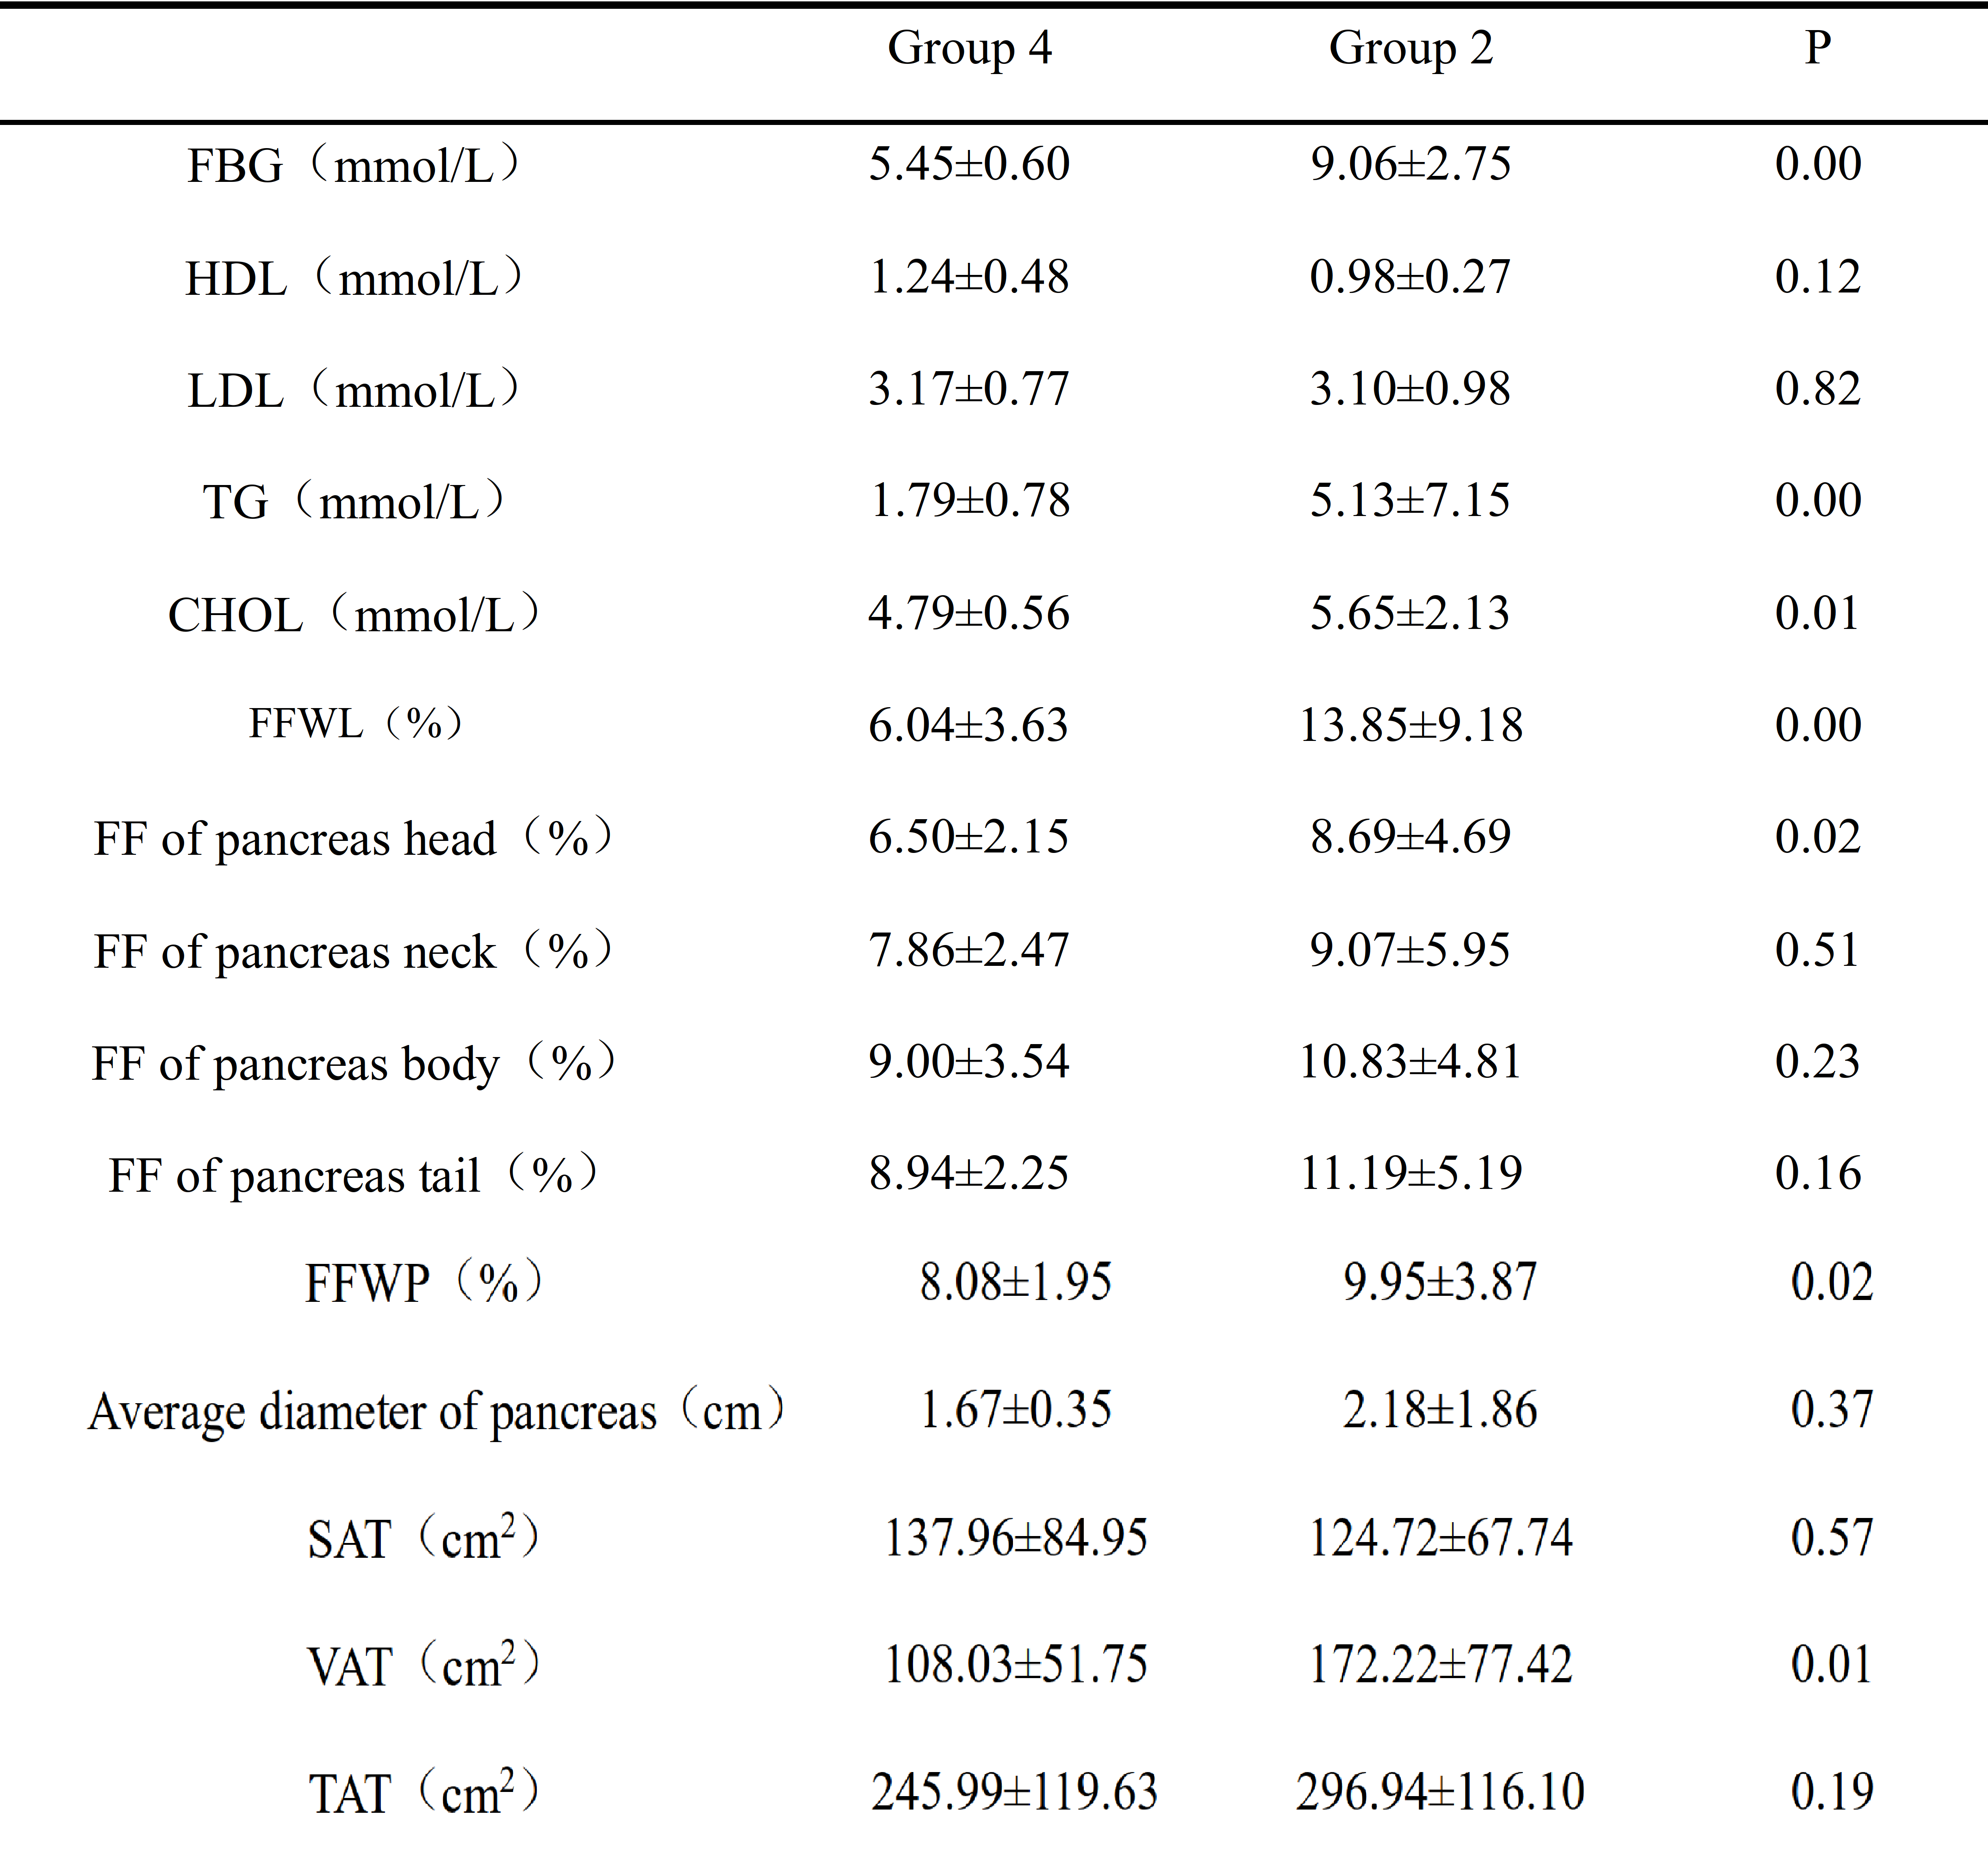
1. 128 T2DM patients(72 males and 46 females,Age:18-85 years old, average age 57.07, standard deviation 13.41)received treatment in Fujian Provincial Hospital (confirmed according to criteria for diagnosing diabetes WTO 1999) and 39 healthy volunteers(10 males and 29females,Age:30-76 years old, average age 52.33, standard deviation 12.03)were enrolled in this study. BMI, fasting blood glucose, High-density lipoprotein(HDL), Low-density lipoprotein(LDL), Triglyceride(TG)and Cholesterol(CHOL) were acquired for all the patients and volunteers.2. According to the criterion of the Chinese Diabetes Society, a BMI value higher than 25 was defined as obesity. All the subjects were divided into 4 groups, which are Group 1: T2DM with BMI<25 (37 males and 24 females, average age 59.28),Group 2: T2DM with BMI≥25(35 males and 19 females, average age 54.44), Group 3: control group with BMI<25(6 males and 22 females, average age 51.86) and Group 4: control group with BMI≥25(4 males and 7 females, average age 53.55).
3. All the MR exams were conducted on a 1.5T system (MAGNETOM Aera, SIEMENS Healthcare, Erlangen, Germany). Dual echo 3D VIBE sequence was performed for fat quantification purpose, the detailed parameters were: TR 6.46ms, TE1/TE2 2.39/4.77ms, FOV 380×380mm, in-plane resolution 1.3×1.3mm, slice thickness 3mm, acquisition time 15s. In order to reduce the motion artifacts, all patients were informed to hold breath during the data acquisition of the dual echo VIBE sequence.
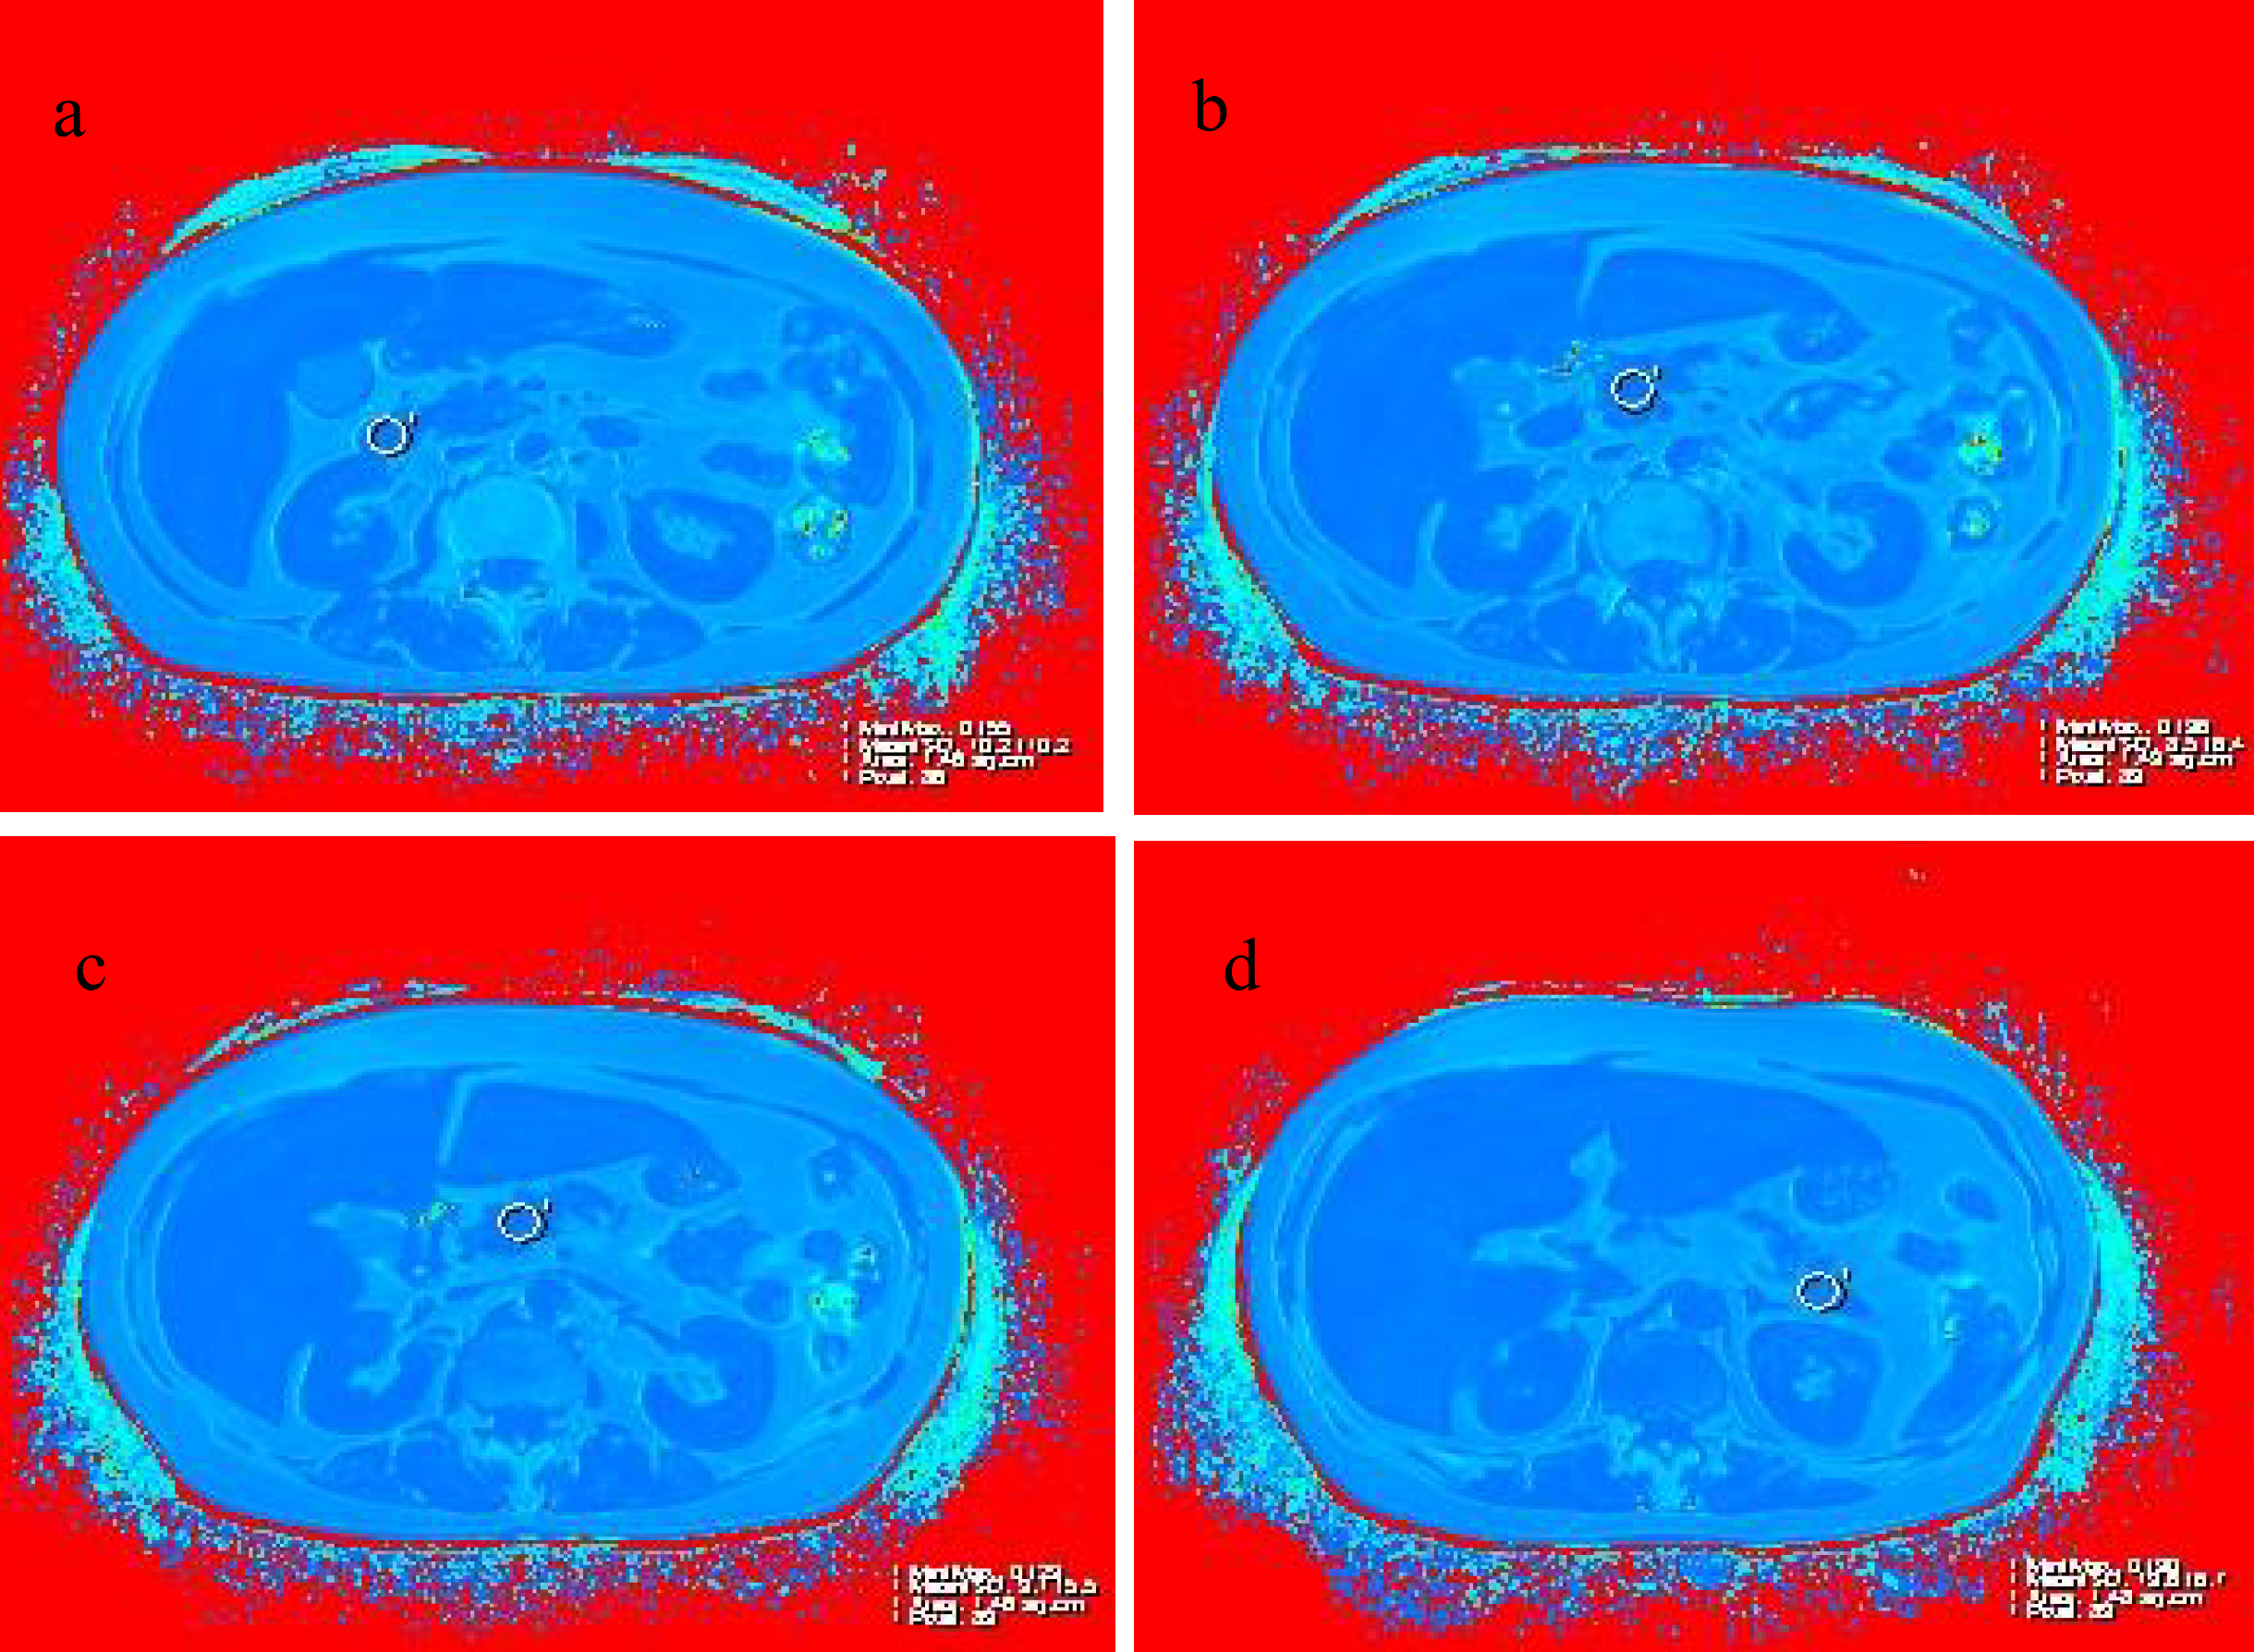
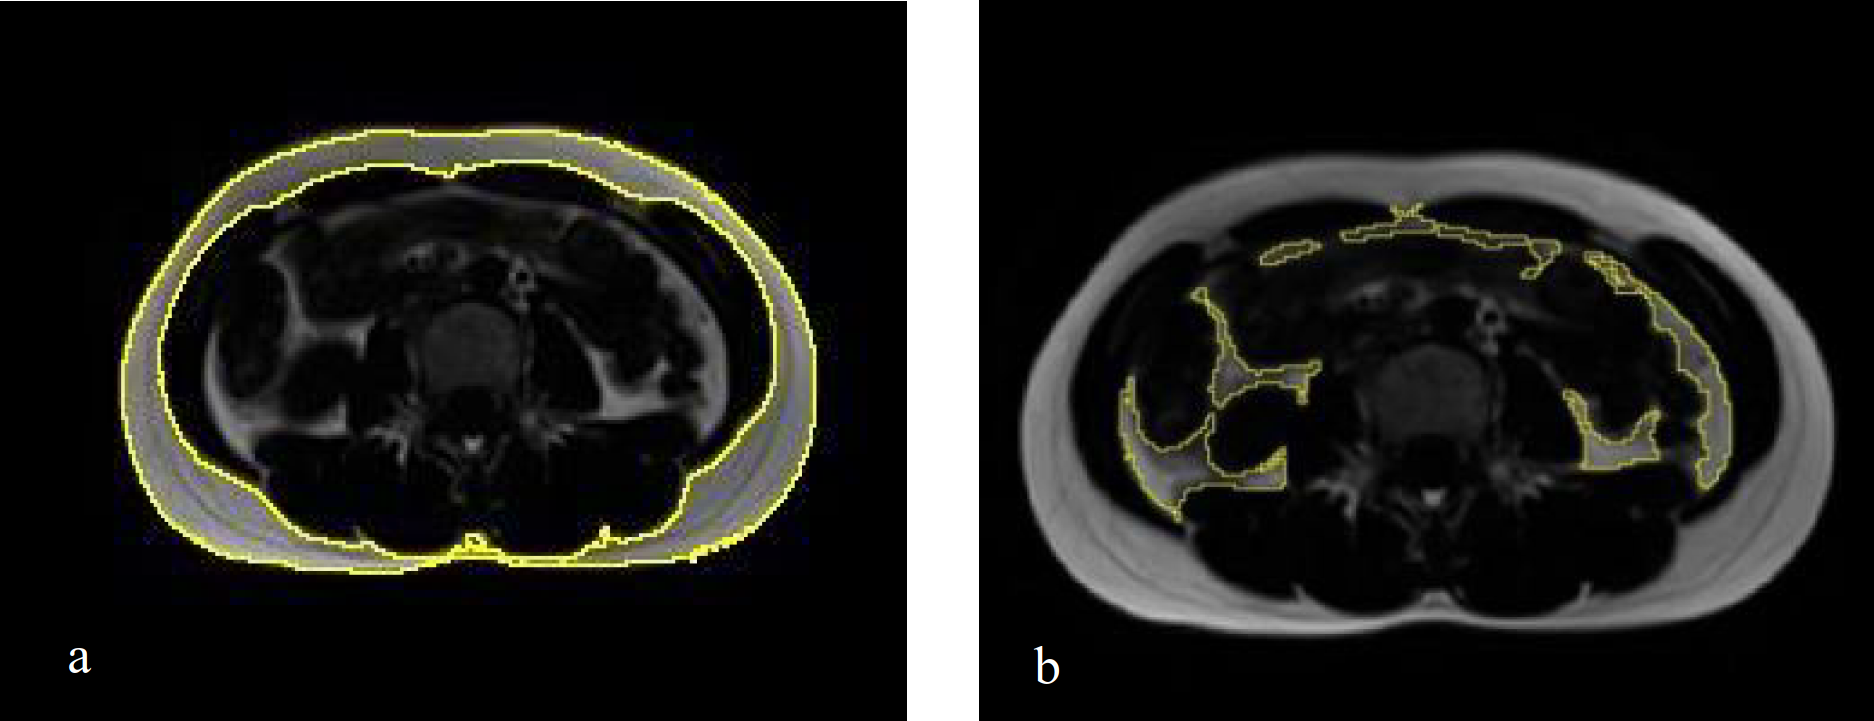
4. The FF of liver and pancreas, the maximum diameters of the pancreas, SAT (subcutaneous adipose area), VAT (visceral adipose tissue area) and TAT (total abdominal adipose tissue area)were measured for 167 subjects using the MR Dixon data(The measurement method is shown in Figure 1,2,3).Four group were established on the basis of BMI value. For statistics, intra- and inter-group comparison was done by employing Independent Sample t Test.
Results
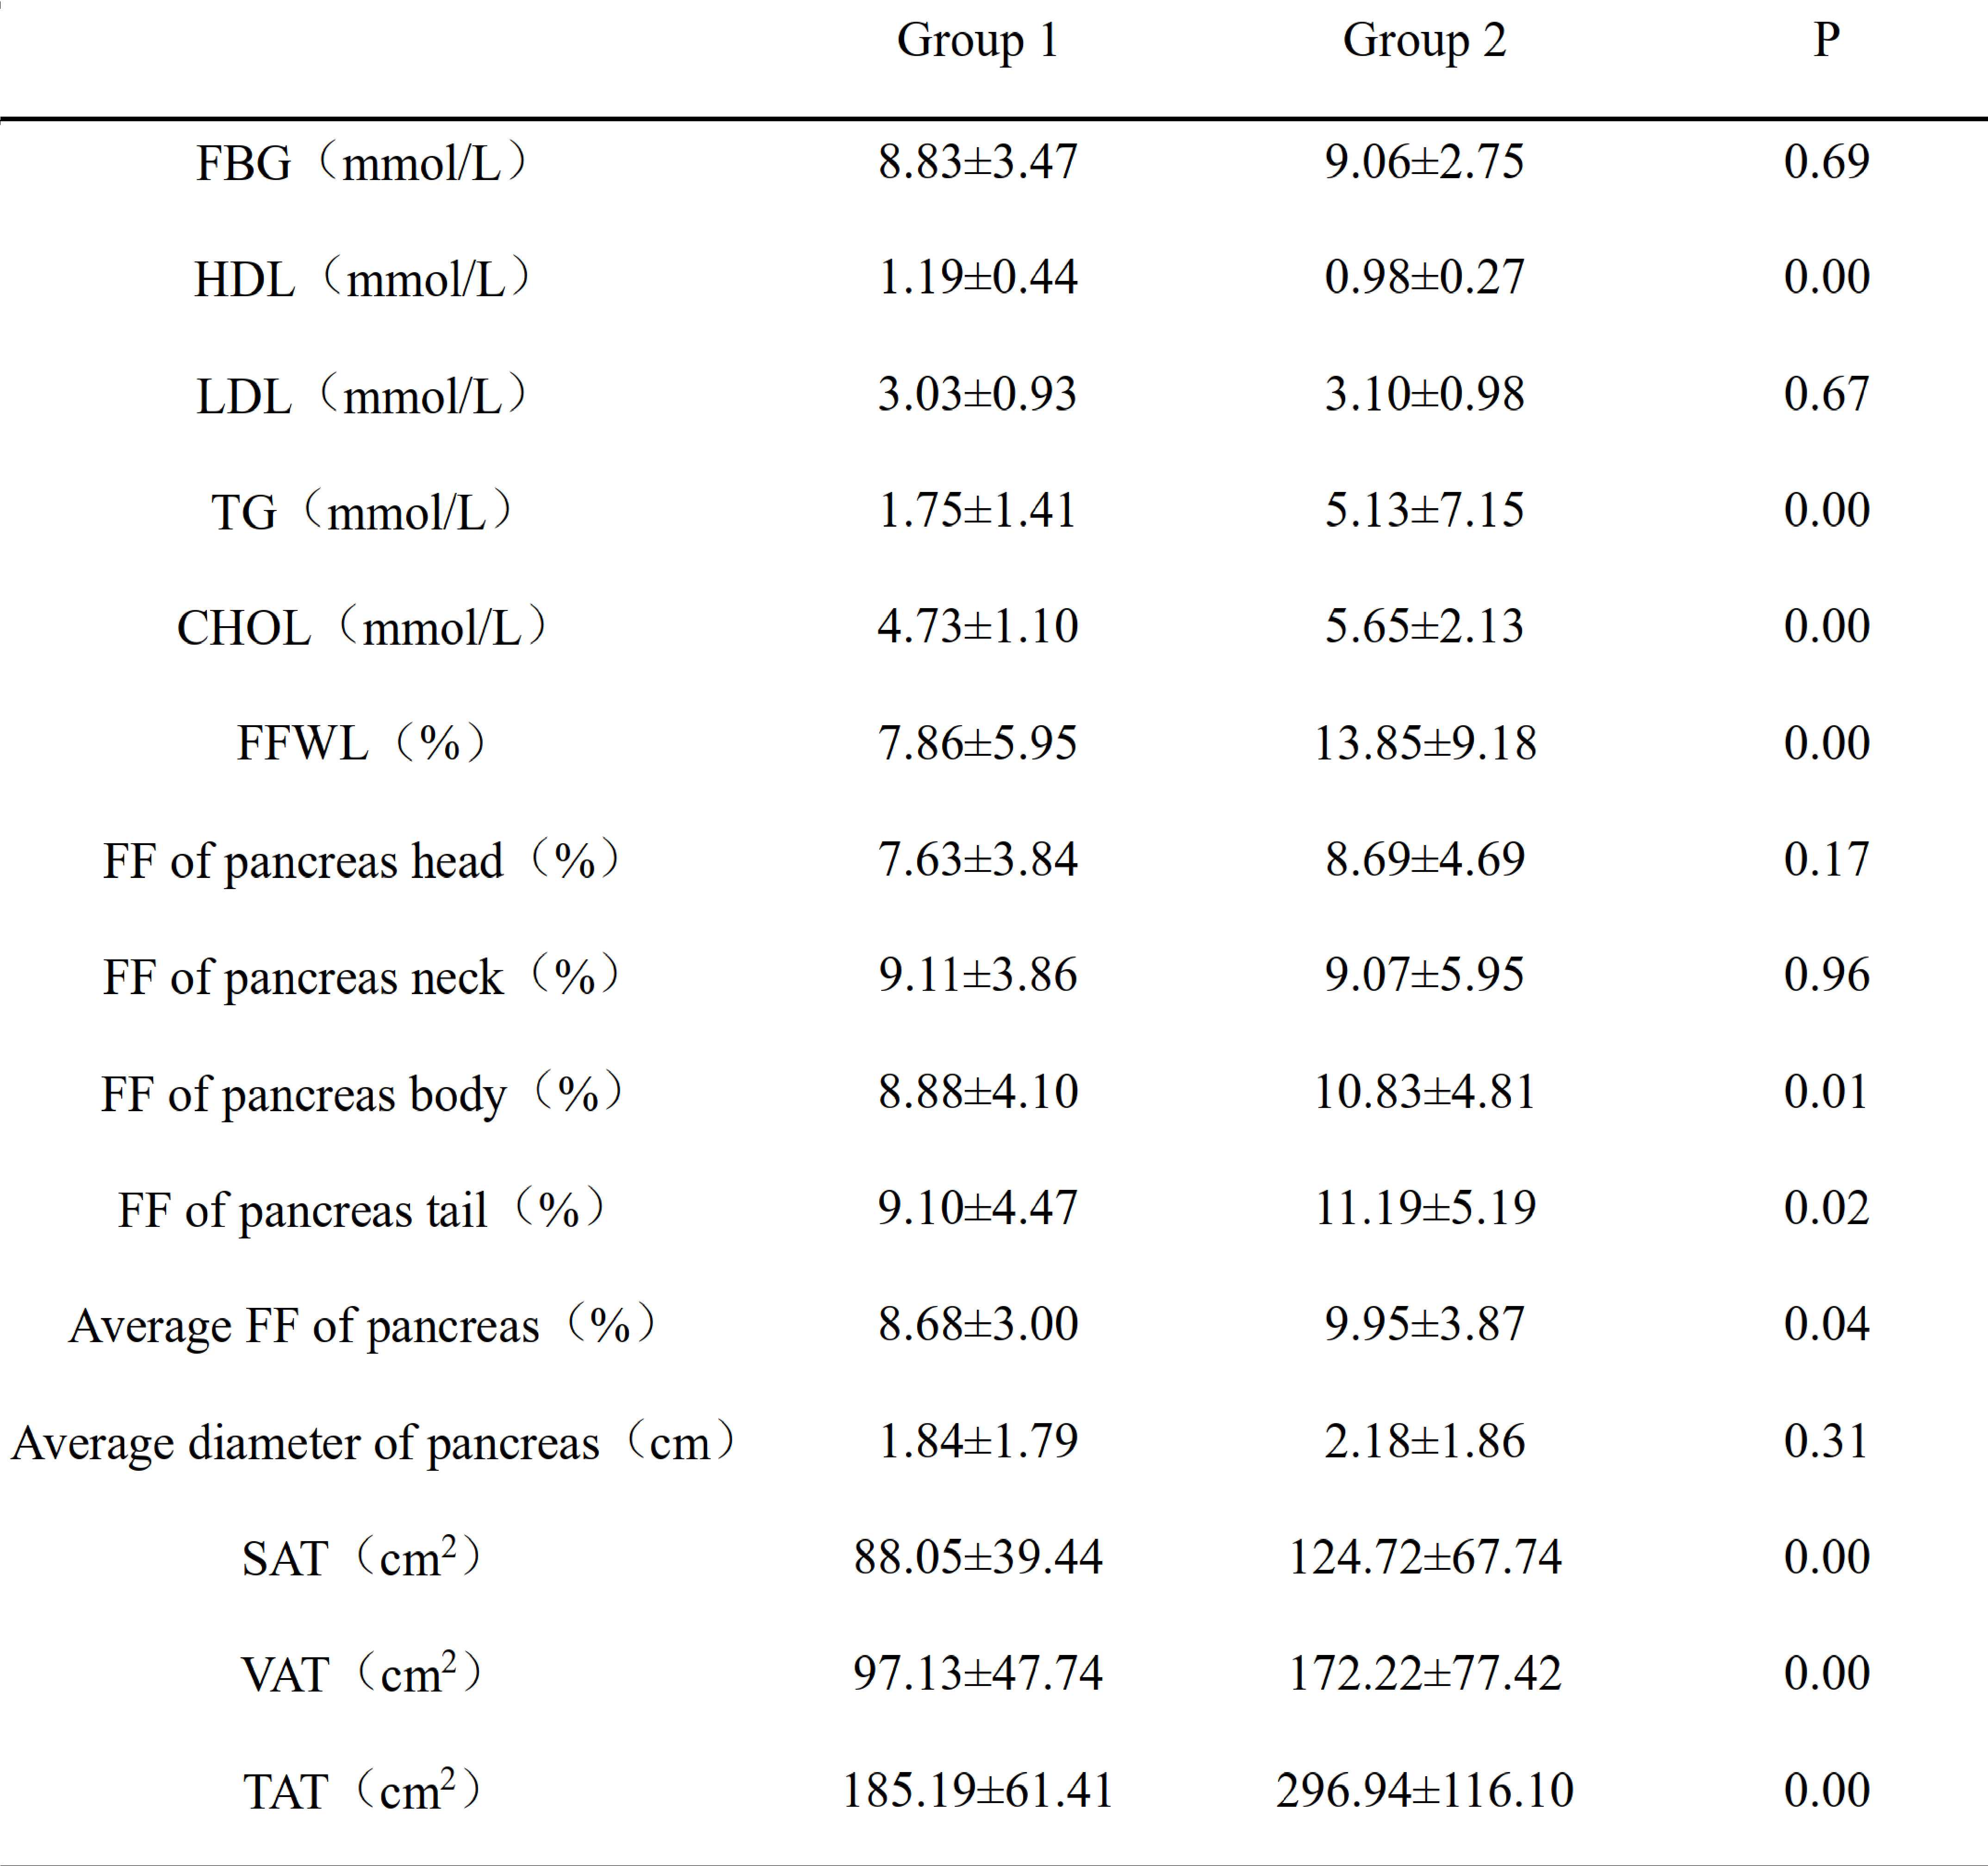
① The average fat content in liver and pancreas, the fat content in pancreas body and tail, and VAT in Group 1 are higher than those in Group 3 (P<0.05)(table1). ② The average fat content in liver and pancreas, the adipose fraction of the pancreas head, and VAT in the Group 2 are higher than those in Group 4 (P<0.05)(table2). ③ The average fat content of liver and pancreas, the adipose content of the body and the tail of the pancreas, the abdominal subcutaneous adipose area (SAT), the visceral adipose tissue area (VAT), and the total abdominal adipose tissue area (TAT) in Group 2 are higher than those in the Group 1 (P<0.05)(table3). ④ The FF of pancreas tail, SAT and TAT in Group 4 are higher than those in Group 3 (P<0.05).Discussion and Conclusions
This study indicates that T1-mapping technique is preferred in quantitative diagnosis. T1-mapping is superior to T2*-mapping and T2-mapping in the diagnosis of subchondral bone marrow edema of the SpA sacroiliac joint. It can provide quantitative monitoring of inflammatory changes during treatment, which is beneficial to clinical individualized treatment and timely adjustment of the treatment plan.Acknowledgements
Acknowledgements: The authors of this manuscript declare no relationships with any companies, whose products or services may be related to the subject matter has not received any funding. No complex statistical methods were necessary for this paper. Institutional Review Board approval was not required because this was a retrospective study. No study subjects or cohorts have been previously reported.References
[1]Zhang Y N, Fowler K J, Hamilton G, Cui J Y, Sy E Z, Balanay M et al. Liver fat imaging-a clinical overview of ultrasound, CT, and MR imaging. The British journal of radiology 2018; 91: 20170959.doi: https://doi.org/10.1259/bjr.20170959
[2]Esterson Y B, Grimaldi G M. Radiologic imaging in nonalcoholic fatty liver disease and nonalcoholic steatohepatitis. Clinics in liver disease 2018; 22: 93-108. doi:https://doi.org/10.1016/j.cld.2017.08.005
[3]Middleton M S, Haufe W, Hooker J, Borga M, Leinhard O D, Romu T et al. Quantifying Abdominal Adipose Tissue and Thigh Muscle Volume and Hepatic Proton Density Fat Fraction: Repeatability and Accuracy of an MR Imaging-based, Semiautomated Analysis Method. Radiology 2017; 283: 438-49. doi: https://doi.org/10.1148/radiol.2017160606
[4]Samuel V T, Shulman G I. Nonalcoholic fatty liver disease as a nexus of metabolic and hepatic diseases. Cell metabolism 2018; 27: 22-41.
Figures