1862
Evidence for a sustained cerebrovascular response following motor practice
Eleonora Patitucci1, Michael Germuska1, James Kolasinski1, Valentina Tomassini1,2,3, and Richard G Wise1,2
1CUBRIC, Cardiff University, Cardiff, United Kingdom, 2Institute for Advanced Biomedical Technologies (ITAB), Department of Neurosciences, Imaging and Clinical Sciences, University of Chieti-Pescara, Chieti, Italy, 3MS Centre, Neurology Unit, SS. Annunziata University Hospital, Chieti, Italy
1CUBRIC, Cardiff University, Cardiff, United Kingdom, 2Institute for Advanced Biomedical Technologies (ITAB), Department of Neurosciences, Imaging and Clinical Sciences, University of Chieti-Pescara, Chieti, Italy, 3MS Centre, Neurology Unit, SS. Annunziata University Hospital, Chieti, Italy
Synopsis
Functional MRI can detect modifications in the brain’s resting state with learning-related behavioural improvements. However, the impact of learning on local cerebral blood flow after task execution remains unclear. Here we investigate changes in CBF after the execution of a motor task and demonstrate a sustained increase in resting CBF that is localised in regions relevant for the learning of the task. Our results show that learning induces sustained changes of local cerebral blood flow (over a timescale of minutes).
Introduction
Motor tasks during fMRI have been extensively used to probe neuroplasticity1,2. Changes in BOLD resting state signal fluctuations following motor training have been observed3, suggesting a sustained pattern of altered neuronal activity and/or microvascular function for a period of time following the cessation of a motor task. Although studies have employed arterial spin labelling (ASL) techniques to study fluctuations in resting state CBF4-9, evidence for sustained changes in brain perfusion following the learning of a motor task remains incomplete. Here, we investigate voxel-wise changes in CBF following 10 minutes of motor learning task in order to test the hypothesis that sustained changes in CBF occur to support changes in energy demand, under the assumption of a stable neurovascular coupling10; these changes in CBF would subserve task-related neural plasticity or represent microvascular plasticity.Methods
Healthy volunteers underwent two 3T MRI (Siemens Prisma) sessions (“task” and “control”) a week apart (Fig. 1). Participants were randomised to start with the “task” or with the “control” session; half of the participant did the task session first, while the other half did the control session first. At each session, structural (T1-weighted scan, 1mm isotropic, 200 slices, TR/TE = 2100/3.24ms) and perfusion (a dual-excitation pseudo-continuous arterial spin labelling acquisition; TE1: 10ms, TR1: 3600ms, TE2: 30ms, TR2: 800ms, labelling duration: 1.5s, post-labelling delay: 1.5s, slice thickness: 7mm, and GRAPPA acceleration factor 3) images were acquired. During the “task” session, participants were asked to perform a motor learning task; during the “control” session, they were asked to lay still in the scanner. FEAT (https://fsl.fmrib.ox.ac.uk/) was used to fit a linear model to the voxel-wise data in order to produce maps of significant task related CBF activation. CBF maps of resting periods (before and after the task periods in both sessions) were created from the TE=10ms data and converted to units of ml/100g/min using BASIL toolbox11. For each subject, the CBF map of post-task resting period was subtracted from the CBF map of the pre-task resting period to estimate differences in CBF following the task. Permutation testing (FSL-RANDOMISE) was used to investigate differences between conditions (“task” vs. “control”) in the resting post-task (rest 2) vs. pre-task (rest 1) CBF maps at a voxel-wise level. During the “task” session, participants practised a motor task while perfusion data acquisition continued (Fig. 1). They used an MRI-compatible right hand 5DT Data Glove 16 MRI (https://5dt.com/5dt-data-glove-ultra/) with fibreoptic sensors to control the size of a green circle (participant controlled), which they had to match to the size of a white circle (target) by squeezing their hand into a fist. The white circle expanded and contracted in a fixed sequence. A temporal Pearson’s correlation between the diameter of the white circle (pre-fixed sequence) and the diameter of the green circle drawn by the participant’s fist (behavioural response) was calculated. A one-way ANOVA was performed with the correlation index as the dependent variable and each block of the experiment as the independent variable.Results
We recruited 20 participants, who were 27.5±3.8 years old; 11 were female. There was an increasing temporal correlation between the size of the target circle and the size of the participant controlled circle (F(1,9) = 10.89, p < 0.001) (Fig. 2), indicating improvement of performance with task practice. Most of the improvement occurred during the first 3 blocks of sequence repetition. Main areas of positive CBF responses to the task were found bilaterally in the postcentral gyrus, inferior occipital cortex, superior parietal lobule, cerebellum (lobules V-VI) and left precentral gyrus (Fig. 3). We observed an increase in resting CBF in the 8-minute period post “task” compared to the same period post “control” (Fig. 4) suggesting that the observed changes were due to the performance of the task rather than an effect of time. Areas with significantly increased resting CBF (on average 15.8%) following completion of the task included the cerebellum (bilaterally crus I, lobules VIII, right V-VI lobules), the inferior temporal gyri, the supramarginal gyri, the right angular gyrus, the precentral gyri, the right postcentral gyrus, visual cortex (V5) bilaterally (Fig. 4).Discussion/Conclusion
We demonstrated a sustained and localised increase in resting CBF after the completion of motor learning task. The increase was measured over a period of 8 minutes and localised in functional regions that were relevant for the task performance. This increase in CBF may reflect a task-related change in local neural activity as a result of increased energy supply and/or an initial stage of microvascular plasticity. It remains to be investigated how long the elevated post-task CBF lasts, the specificity of its association with motor learning and whether it subserves long term brain plasticity.Acknowledgements
The study was funded by the Wellcome Trust.References
- Mozolic, J. L., Hayasaka, S., & Laurienti, P. J. (2010). A cognitive training intervention increases resting cerebral blood flow in healthy older adults. Frontiers in Human Neuroscience, 4(March), 1–10. https://doi.org/10.3389/neuro.09.016.2010
- Thomas, A. G., Marrett, S., Saad, Z. S., Ruff, D. A., Martin, A., & Bandettini, P. A. (2009). Functional but not structural changes associated with learning: An exploration of longitudinal Voxel-Based Morphometry (VBM). NeuroImage, 48(1), 117–125. https://doi.org/10.1038/jid.2014.371
- Albert, N. B., Robertson, E. M., Miall, R. C., & Hall, G. (2009). The Resting Human Brain and Motor Learning. Current Biology, 19(12), 1023–1027. https://doi.org/10.1016/j.cub.2009.04.028
- Biswal, B. B., Kylen, J. Van, & Hyde, J. S. (1997). Simultaneous Assessment of Flow and BOLD Signals in Resting-State Functional Connectivity Maps. NMR in Biomedicine, 10, 165–170
- Chuang, K., Gelderen, P. Van, Merkle, H., Bodurka, J., Ikonomidou, V. N., Koretsky, A. P., … Talagala, S. L. (2008). Neuroimage, 40, 1595–1605. https://doi.org/10.1016/j.neuroimage.2008.01.006
- Fukunaga, M., Horovitz, S. G., Zwart, J. A. De, Gelderen, P. Van, Balkin, T. J., Braun, A. R., & Duyn, J. H. (2008). Metabolic origin of BOLD signal fluctuations in the absence of stimuli, JCBFM, 1377–1387. https://doi.org/10.1038/jcbfm.2008.25
- Liang, X., Zou, Q., He, Y., & Yang, Y. (2013). Coupling of functional connectivity and regional cerebral blood flow reveals a physiological basis for network hubs of the human brain, PNAS, 110(5), 1929–1934. https://doi.org/10.1073/pnas.1214900110
- Viviani, R., Messina, I., & Walter, M. (2011). Resting State Functional Connectivity in Perfusion Imaging : Correlation Maps with BOLD Connectivity and Resting State Perfusion. PLoS ONE, 6(11). https://doi.org/10.1371/journal.pone.0027050
- Zou, Q., Wu, C. W., Stein, E. A., Zang, Y., & Yang, Y. (2009). Static and Dynamic Characteristics of Cerebral Blood Flow during the Resting State. NeuroImage, 48(19), 515–524. https://doi.org/10.1016/j.neuroimage.2009.07.006.Static
- Iadecola, C. (2017). The Neurovascular Unit Coming of Age: A Journey through Neurovascular Coupling in Health and Disease. Neuron, 96(1), 17–42. https://doi.org/10.1016/J.NEURON.2017.07.030 11.
- Chappell, M. A., Groves, A. R., Whitcher, B., & Woolrich, M. W. (2009). Variational Bayesian Inference for a Nonlinear Forward Model. IEEE Transactions on Signal Processing, 57(1), 223–236
Figures
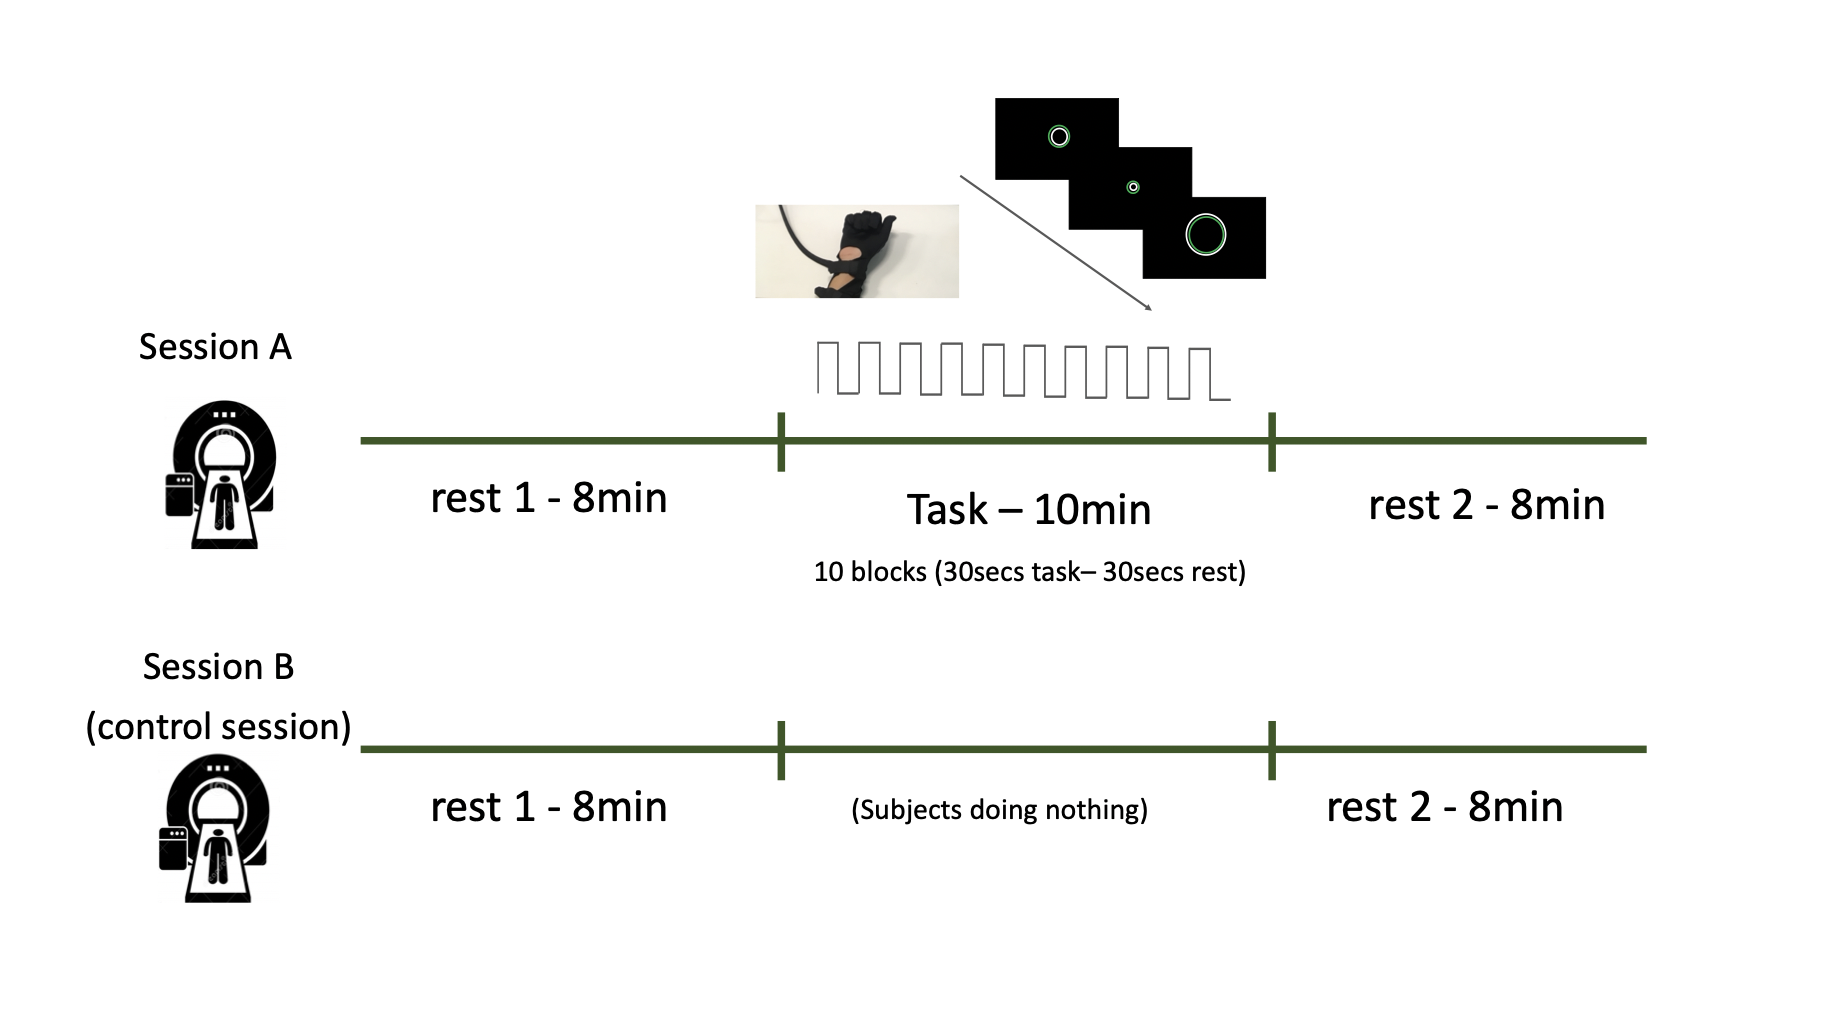
FIG. 1 - Participants were scanned twice. During the “task” session (A),
participants underwent 8 minutes of resting state (RS), 10 minutes of motor
task and 8 minutes of RS. During the “control” session (B), participants
underwent 8 minutes of RS, 10 minutes where they were asked to lay still in the
scanner and 8 minutes of RS again. During the rest scans, in the task session
and for the entire duration of the control session, a white fixation cross and
the word “REST” were presented on a black screen.
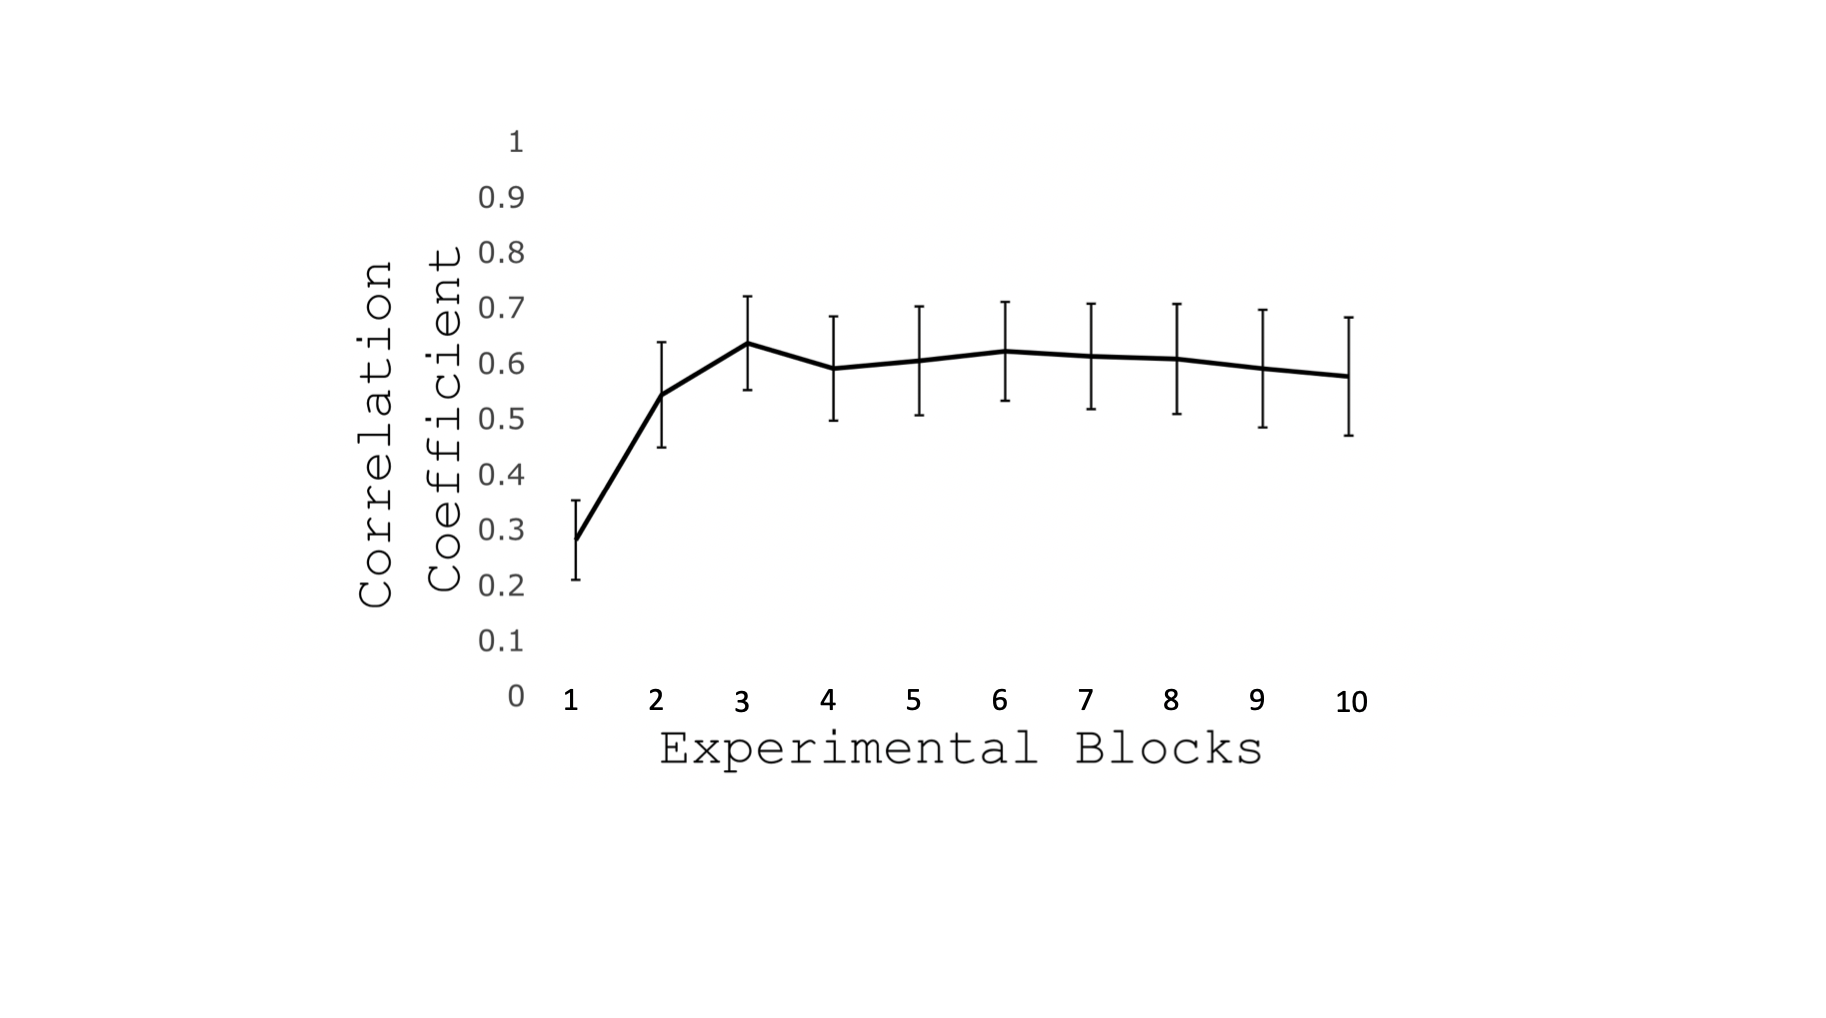
FIG. 2 - Increasing temporal
correlation between the size of two circles throughout task performance
(Mean±SEM across participants). This suggests an improvement in performance
especially over the first 3 blocks.
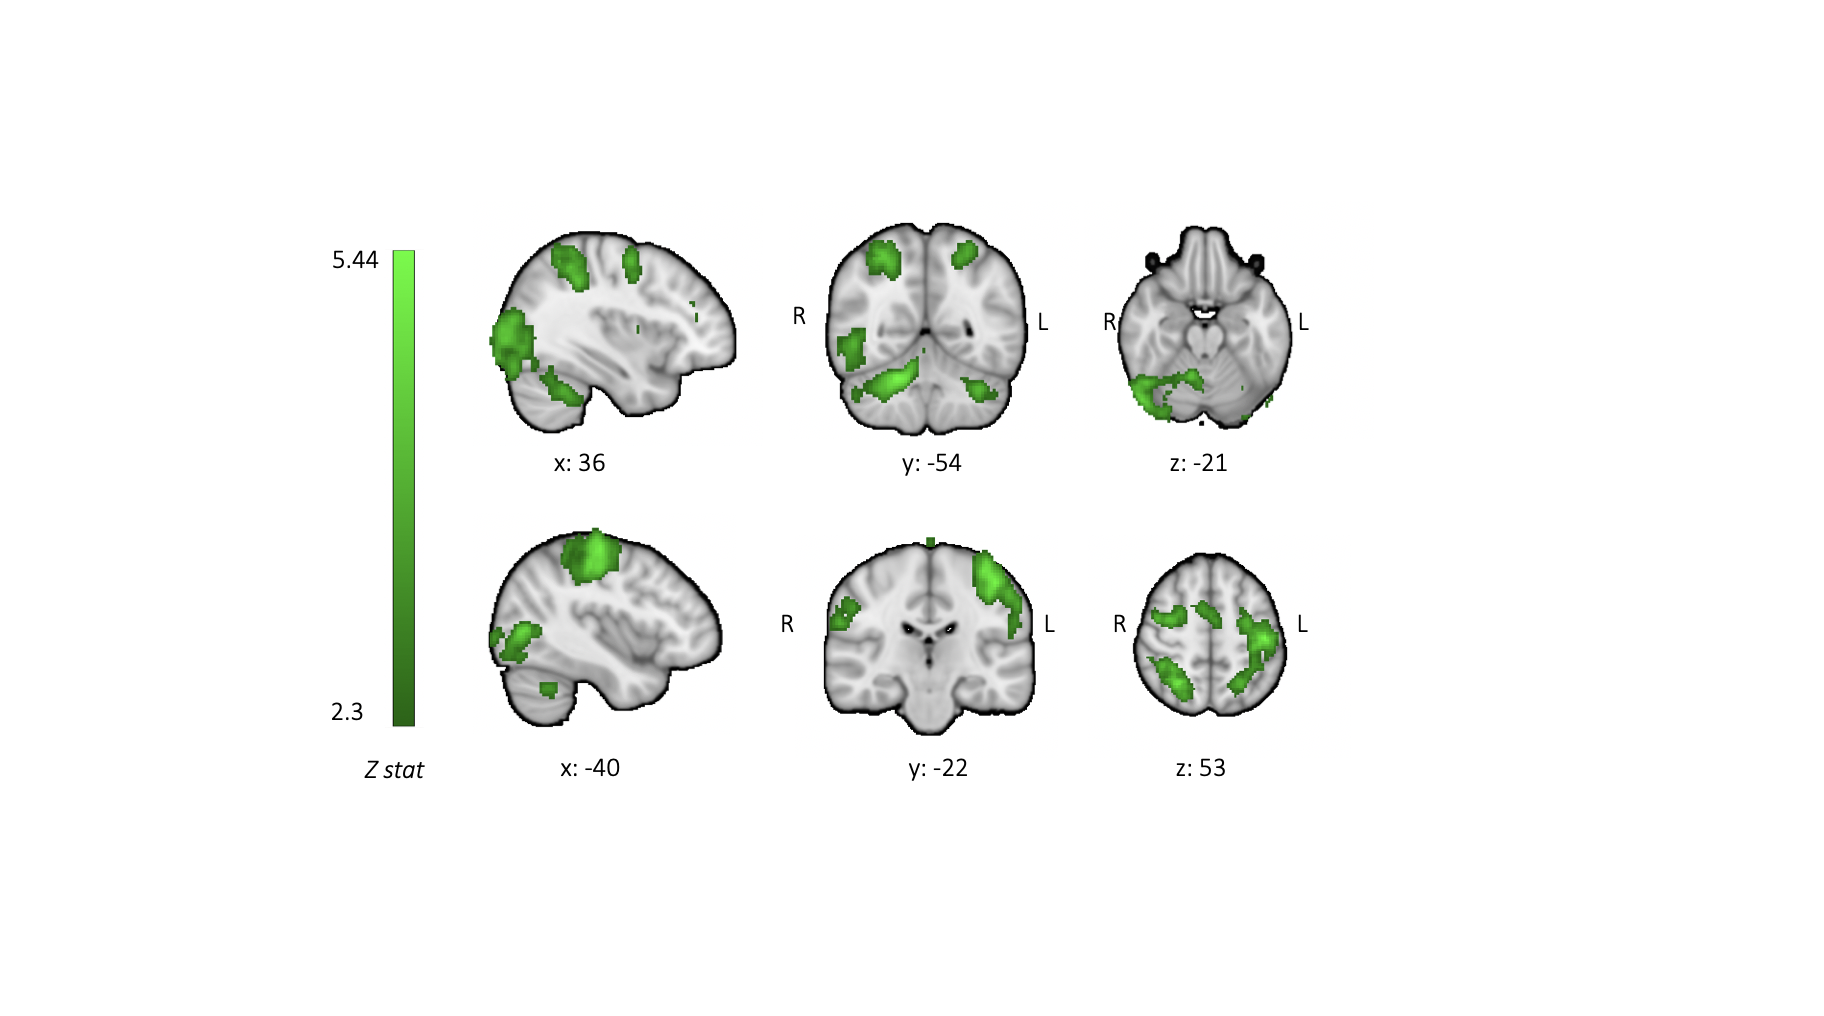
FIG. 3 - CBF group positive mean responses to task execution reported as z stats. Z statistic images
were thresholded at Z > 2.3 and a cluster significance threshold of p = 0.05
was set
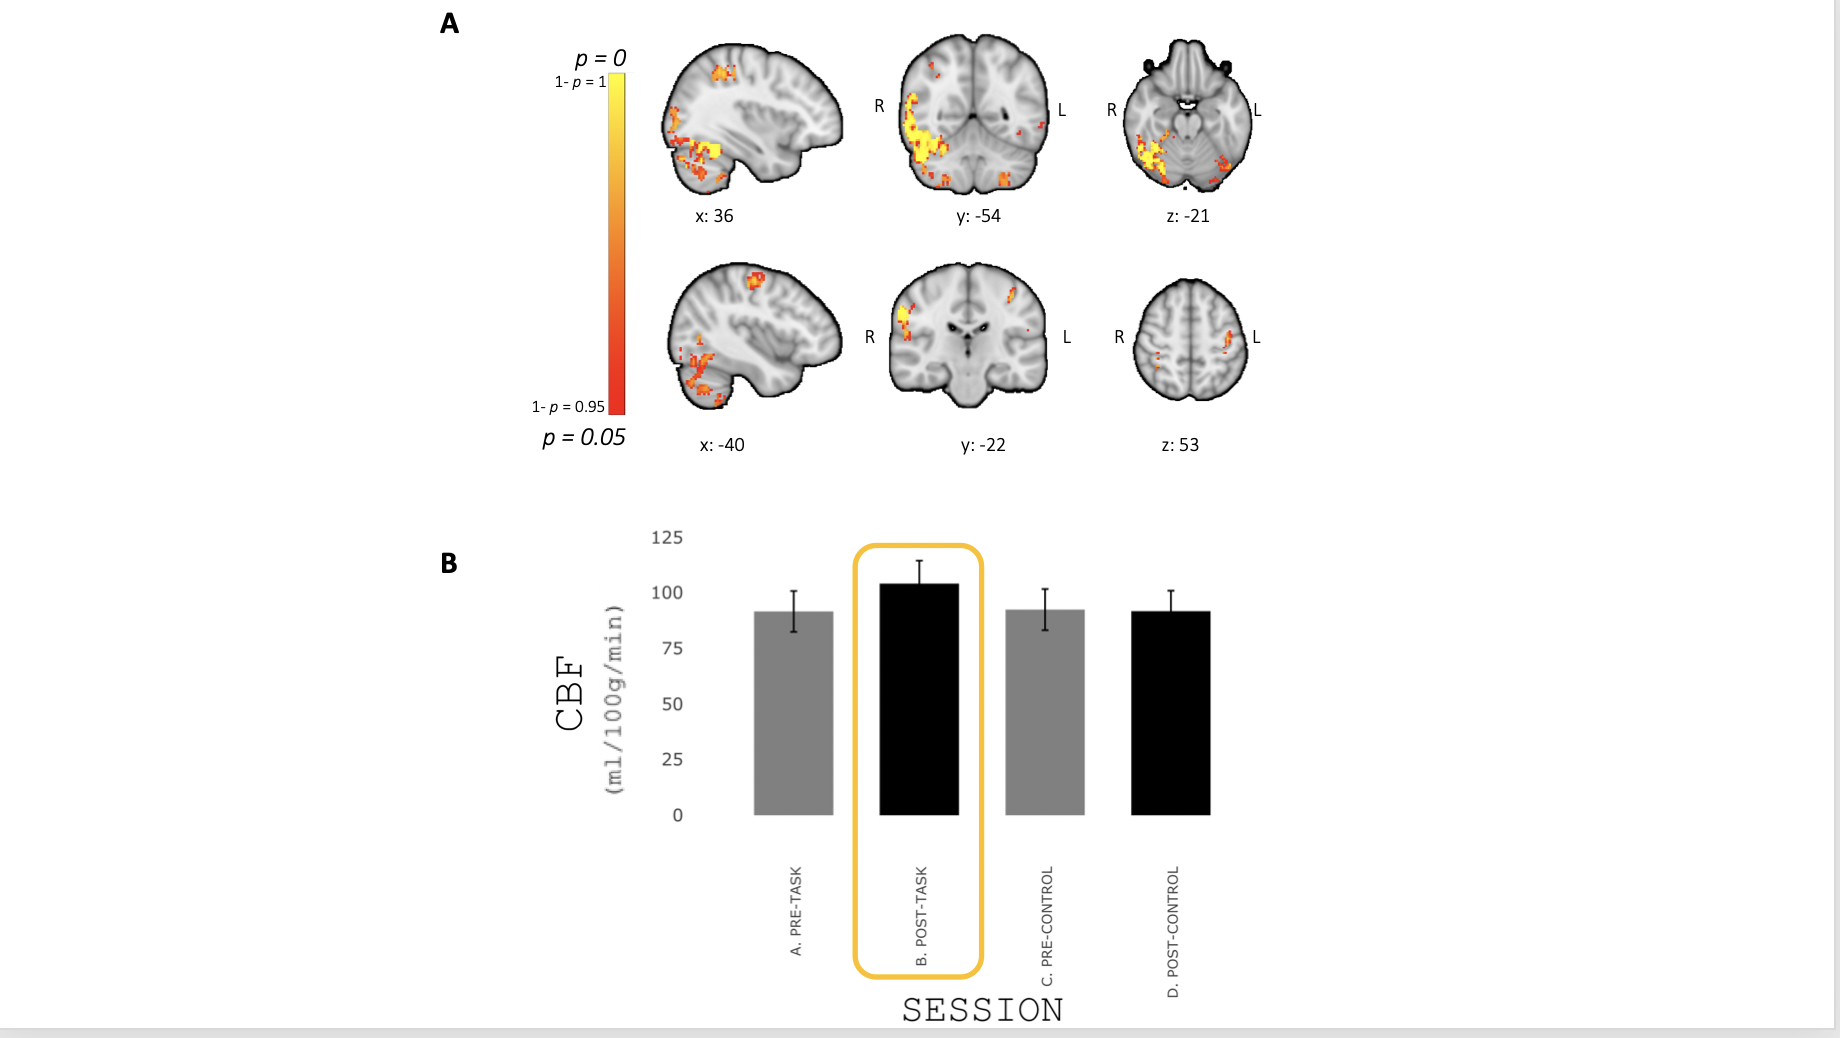
FIG. 4 - (A) Areas showing an increase in resting CBF with
learning reported as p-value. (B)
Mean±SEM resting CBF during the different resting periods (pre-/post-
task/control) in significant voxels. Resting CBF significantly increased
following completion of the task 15.8% on average compared to the pre-task.