1861
Perfusion mapping with sinusoidal CO2 respiratory challenge1Biomedical Engineering, University of Southern California, Los Angeles, CA, United States, 2Fetal and Neonatal Institute, Children's Hospital Los Angeles, Los Angeles, CA, United States, 3Neuroscience Graduate Program, University of Southern California, Los Angeles, CA, United States, 4Pediatrics and Radiology, Children's Hospital Los Angeles, Los Angeles, CA, United States
Synopsis
Dynamic susceptibility contrast MRI is a popular perfusion technique that requires the use of intravenous exogenous contrast. To avoid gadolinium injection, this study proposed a perfusion MRI method based on a CO2 respiratory challenge, which delivers a sinusoidally-modulated CO2 stimulus. We evaluated this technique at two different stimulus amplitudes and reported cerebral blood flow (CBF), cerebral blood volume (CBV) and transit time (TT) within the acceptable range of the previous literature.
Introduction
Perfusion MRI using dynamic susceptibility contrast (DSC) is an approach for characterizing cerebral blood flow (CBF) and cerebral blood volume (CBV) in patients with strokes and brain tumors. To avoid the potential risks of gadolinium exposure,1,2 we previously demonstrated the feasibility of using respiratory challenges using pure nitrogen gas to introduce boluses of deoxygenated hemoglobin as an endogenous tracer.3 We now extend this concept to non-bolus challenges by delivering sinusoidal variations in CO2 to raise and lower saturation through vasodilation and vasoconstriction. In addition to providing cerebrovascular reserve,4 we demonstrate the feasibility of estimating CBF, CBV and venous transit time (TT) because the sinusoid stimulus greatly simplifies calculations in the Fourier domain. We evaluated this technique at two different stimulus amplitudes and generated spatial perfusion maps on three volunteers.Methods
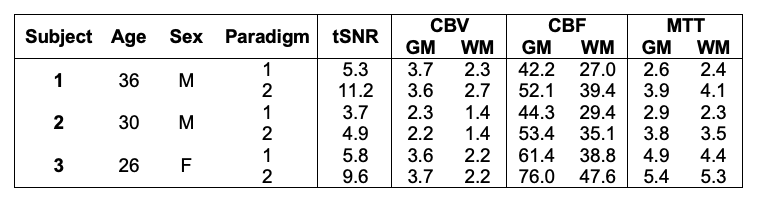
A total of three volunteers were studied (1F:2M, age=31±4; Table 1).MRI: BOLD MRI was acquired with 3T Philips Achieva: TE=30ms, TR=1400ms, resolution 2.5×2.5×2.5mm. Images were motion-corrected, segmented into grey (GM) and white matter (WM) and smoothed using 4mm Gaussian kernel. Signal from the superior sagittal sinus (SSS) was isolated as the venous output function (VOF).
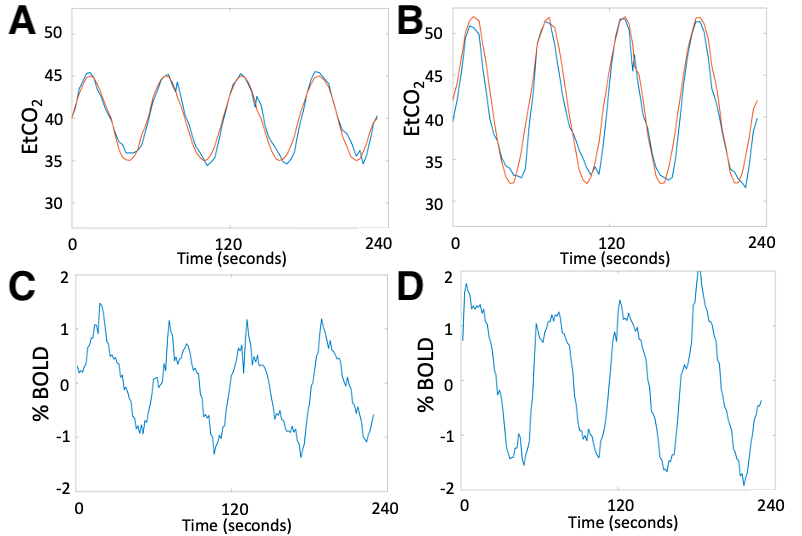
Respiratory protocol: The challenge was performed using a computer-controlled gas blender (RespirAct, Thornhill Research Inc, Toronto, Canada).5 A sinusoidal 4-cycle EtCO2 pattern of amplitude A=5mmHg (paradigm #1) and A=10mmHg (paradigm #2) was programmed: $$$EtCO_2(t)=EtCO_{2_{baseline}}+A\sin(\frac{2\pi t}{60})$$$.
Perfusion processing: Concentration time curve is calculated: $$$C(t)=-\frac{1}{TE}\ln\left(\frac{S(t)}{S_0}\right)$$$, with baseline signal S0. CBV was calculated as the ratio between area under curve of tissue signal and SSS signals. CBF was calculated as deconvolution from the tracer kinetics model: $$$C_{tissue}(t)=VOF(t)\otimes(CBF\times R(t))$$$, where R(t) is the residue function,6 modeled as $$$R(t)=e^{-t/TT}$$$. This model can be expressed in the Fourier domain: $$$|\mathcal{F}\left\{C_{tissue}\right\}|=\pi\times A_{SSS}\times\left(sinc\left(\left(f-f_c\right)T\right)+sinc\left(\left(f-f_c\right)T\right)\right)\times CBF\times\frac{1}{\sqrt{TT^2+\left(2\pi f\right)^2}}$$$, with amplitude ASSS, sinusoidal frequency fc and rect windowing function T. TT was calculated as the delay between tissue and SSS signals at frequency fc: $$$TT=\frac{\angle C_{tissue}\left(f_c\right)-\angle C_{SSS}\left(f_c\right)}{2\pi f_c}$$$.4
Results
Even though subjects reported that the start of the CO2 paradigm was detectable and a slight hyperventilation response was observed, the stimulus was well-tolerated at both CO2 levels. The EtCO2 and BOLD CO2 response for Subject 1 are shown in Figure 1.The three subjects showed 0.9±0.1% BOLD change in paradigm #1 and larger 1.3±0.3% change in paradigm #2. GM showed larger BOLD changes in both paradigms (1.0±0.1%, 1.4±0.3% respectively) compared to WM (0.7±0.1%, 1.0±0.3% respectively).
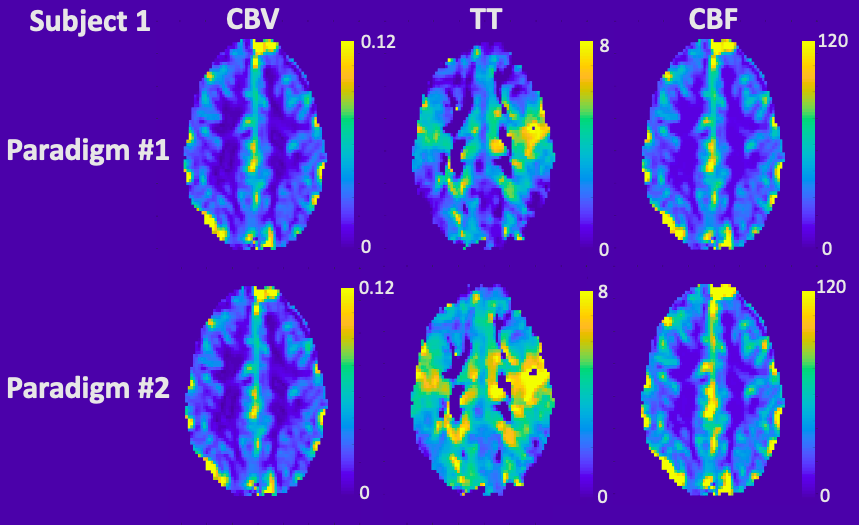
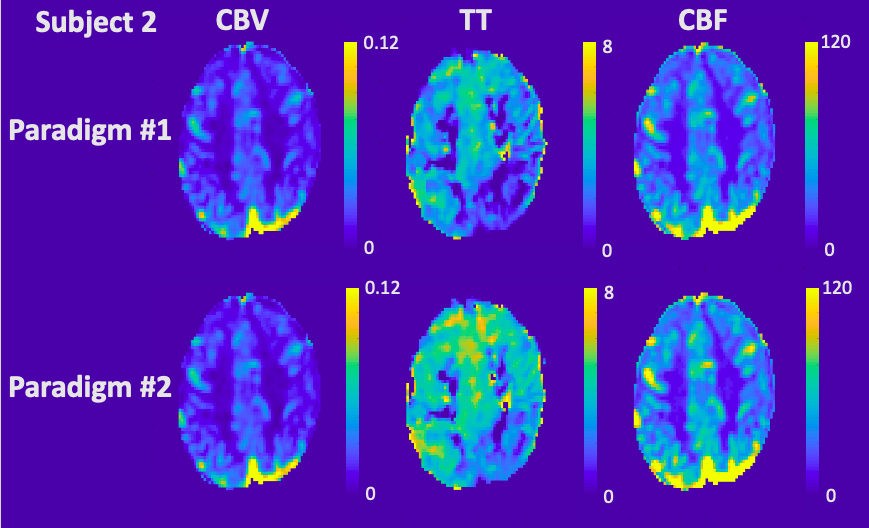
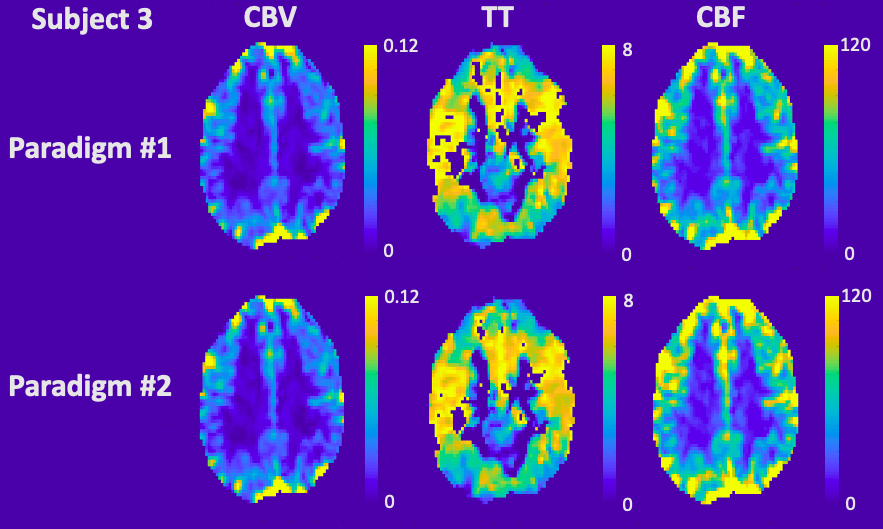
Table 1 details the temporal SNR, CBV, CBF and TT measurements for each subject. CBV with good GM and WM separation was nearly identical between the two paradigms for both mean global values and spatial maps. On the other hand, TT was 25.5±15.2% longer (p=0.06) and CBF was 20.2±1.4% higher (p<0.02) in paradigm #2. This trend could also be observed in the spatial maps, although the relative patterns were well-preserved between paradigms across subjects (Figures 2-4). Regional TT patterns were also qualitatively similar between the two runs, but the longer TT in paradigm #2 was visually obvious. Subjects 1 and 2 had 4.4% and 3.1% voxels in which TT could not be fit (zero values, Figures 2-3), whereas Subject 3 had higher proportion of bad TT voxels (10.1%, Figure 4); these voxels were located in deep watershed areas of the WM. WM did not exhibit a longer transit time than GM (paradigm #1 p=0.07, paradigm #2 p=0.69).
Discussion
In this study, we used a computer-controlled gas blender to modulate EtCO2 partial pressures. The sinusoid EtCO2 stimulus produced corresponding oscillating BOLD signal in the brain. This study derived a method to calculate CBV, CBF and TT from a sinusoidal CO2 stimulus previously used to measure cerebrovascular reactivity.4CBV, CBF and TT maps were generated, and the values were within the acceptable range of literature.7,8 Two paradigms with different EtCO2 amplitudes produced remarkably similar maps but exhibited systematic bias in CBF and TT. Temporal SNR was better with the higher EtCO2 amplitude. Despite targeting a single frequency fc, in practice only a perfect sinusoid can be accomplished on positive cycles. The shape of the negative cycle depends on a subject’s hyperpneic response from the previous positive cycle, introducing a small nonlinearity and frequencies outside the target range. CBF and TT calculations restricted to the dominant frequency fc benefit from the stronger stimulus by paradigm #2. Overall, since all subjects reported similar level of comfort between the two paradigms, we have chosen paradigm #2 for future studies.
One limitation to this sinusoidal CO2 approach is the vasoactive effects of hypercapnia9 and hypocapnia10 on CBF. CO2 modulations within the autoregulatory range change CBF 1–2mL/100g/min per 1mmHg change in PCO2.10–12 By oscillating between hypercapnia and hypocapnia, we hypothesize that the CBF measured is the average of hypercapnia and hypocapnia and is thus an acceptable estimate for baseline CBF. However, at this early stage, we cannot exclude the possibility that the observed CBF and TT differences are due solely to measurement errors rather than physiological differences.
In conclusion, this study proposed the use of sinusoidally-modulated CO2 stimulus to measure CBV, CBF and TT to complement cerebrovascular reactivity measurements. Future work in a larger cohort is required to validate this perfusion technique against other methods such as ASL, DSC and PET.
Acknowledgements
This work was supported by National Heart, Lung, and Blood Institute (grant 1U01-HL-117718-01, 1R01-HL136484-01A1), the National Center for Research (5UL1-TR000130-05) through the Clinical Translational Science Institute at Children’s Hospital Los Angeles, the National Institutes of Health (grant R01-NS074980), the National institute of Neurological Disorders and Stroke (grant 1F31NS106828‐01A1), and National Institute of Health grant (R01-ES024936). Chau Vu was supported by the Core Pilot Program and a Research Career Development Fellowship from the Saban Research Institute at Children’s Hospital Los Angeles. Philips Healthcare provided support for protocol development and applications engineering on a support-in-kind basis.References
1. Agarwal R, Brunelli SM, Williams K, Mitchell MD, Feldman HI, Umscheid CA. Gadolinium-based contrast agents and nephrogenic systemic fibrosis: a systematic review and meta-analysis. Nephrol Dial Transplant. 2008;24(3):856-863. doi:10.1093/ndt/gfn593
2. Broome DR, Girguis MS, Baron PW, Cottrell AC, Kjellin I, Kirk GA. Gadodiamide-Associated Nephrogenic Systemic Fibrosis: Why Radiologists Should Be Concerned. Am J Roentgenol. 2007;188(2):586-592. doi:10.2214/AJR.06.1094
3. Vu C, Chai Y, Coloigner J, et al. Quantitative perfusion mapping with induced transient hypoxia using BOLD MRI. Magn Reson Med. 2021;85(1):168-181. doi:10.1002/mrm.28422
4. Blockley NP, Driver ID, Francis ST, Fisher JA, Gowland PA. An improved method for acquiring cerebrovascular reactivity maps. Magn Reson Med. 2011;65(5):1278-1286. doi:10.1002/mrm.22719
5. Slessarev M, Han J, Mardimae A, et al. Prospective targeting and control of end-tidal CO2 and O2 concentrations. J Physiol. 2007;581(Pt 3):1207-1219. doi:10.1113/jphysiol.2007.129395
6. Østergaard L. Principles of cerebral perfusion imaging by bolus tracking. J Magn Reson Imaging. 2005;22(6):710-717. doi:10.1002/jmri.20460
7. Ibaraki M, Ito H, Shimosegawa E, et al. Cerebral Vascular Mean Transit Time in Healthy Humans: A Comparative Study with PET and Dynamic Susceptibility Contrast-Enhanced MRI. J Cereb Blood Flow Metab. 2007;27(2):404-413. doi:10.1038/sj.jcbfm.9600337
8. GRANDIN C, BOL A, SMITH A, MICHEL C, COSNARD G. Absolute CBF and CBV measurements by MRI bolus tracking before and after acetazolamide challenge: Repeatabilily and comparison with PET in humans. Neuroimage. 2005;26(2):525-535. doi:10.1016/j.neuroimage.2005.02.028
9. Kety SS, Schmidt CF. The effects of altered arterial tensions of carbon dioxide and oxygen on cerebral blood flow and cerebral oxygen consumption of normal young men. J Clin Invest. 1948;27(4):484. doi:10.1172/JCI101995
10. Raichle ME, PLUM F. Hyperventilation and Cerebral Blood Flow. Stroke. 1972;3(5):566-575. doi:10.1161/01.STR.3.5.56611. Moreton FC, Dani KA, Goutcher C, O’Hare K, Muir KW. Respiratory challenge MRI: Practical aspects. NeuroImage Clin. 2016;11:667-677. doi:10.1016/j.nicl.2016.05.003
12. Battisti-Charbonney A, Fisher J, Duffin J. The cerebrovascular response to carbon dioxide in humans. J Physiol. 2011;589(12):3039-3048. doi:10.1113/jphysiol.2011.206052
Figures