1858
A Convolutional Neural Network for Accelerating the Computation of the Extended Tofts Model in DCE-MRI1College of Information Science & Electronic Engineering, Zhejiang University, Hangzhou, China, 2Department of Physical Medicine and Rehabilitation of The Affiliated Sir Run Run Shaw Hospital AND Interdisciplinary Institute of Neuroscience and Technology, School of Medicine, Zhejiang University, Hangzhou, China, 3Key Laboratory of Biomedical Engineering of Ministry of Education, College of Biomedical Engineering and Instrument Science, Zhejiang University, Hangzhou, China, 4Department of Radiology, Qilu Hospital of Shandong University, Jinan, China, 5School of Medicine, Shandong University, Jinan, China, 6Shandong Medical Imaging Research Institute, Shandong University, Jinan, China, 7Department of Neurosurgery, Provincial Hospital Affiliated to Shandong First Medical University, Jinan, China, 8Provincial Hospital Affiliated to Shandong First Medical University, Jinan, China
Synopsis
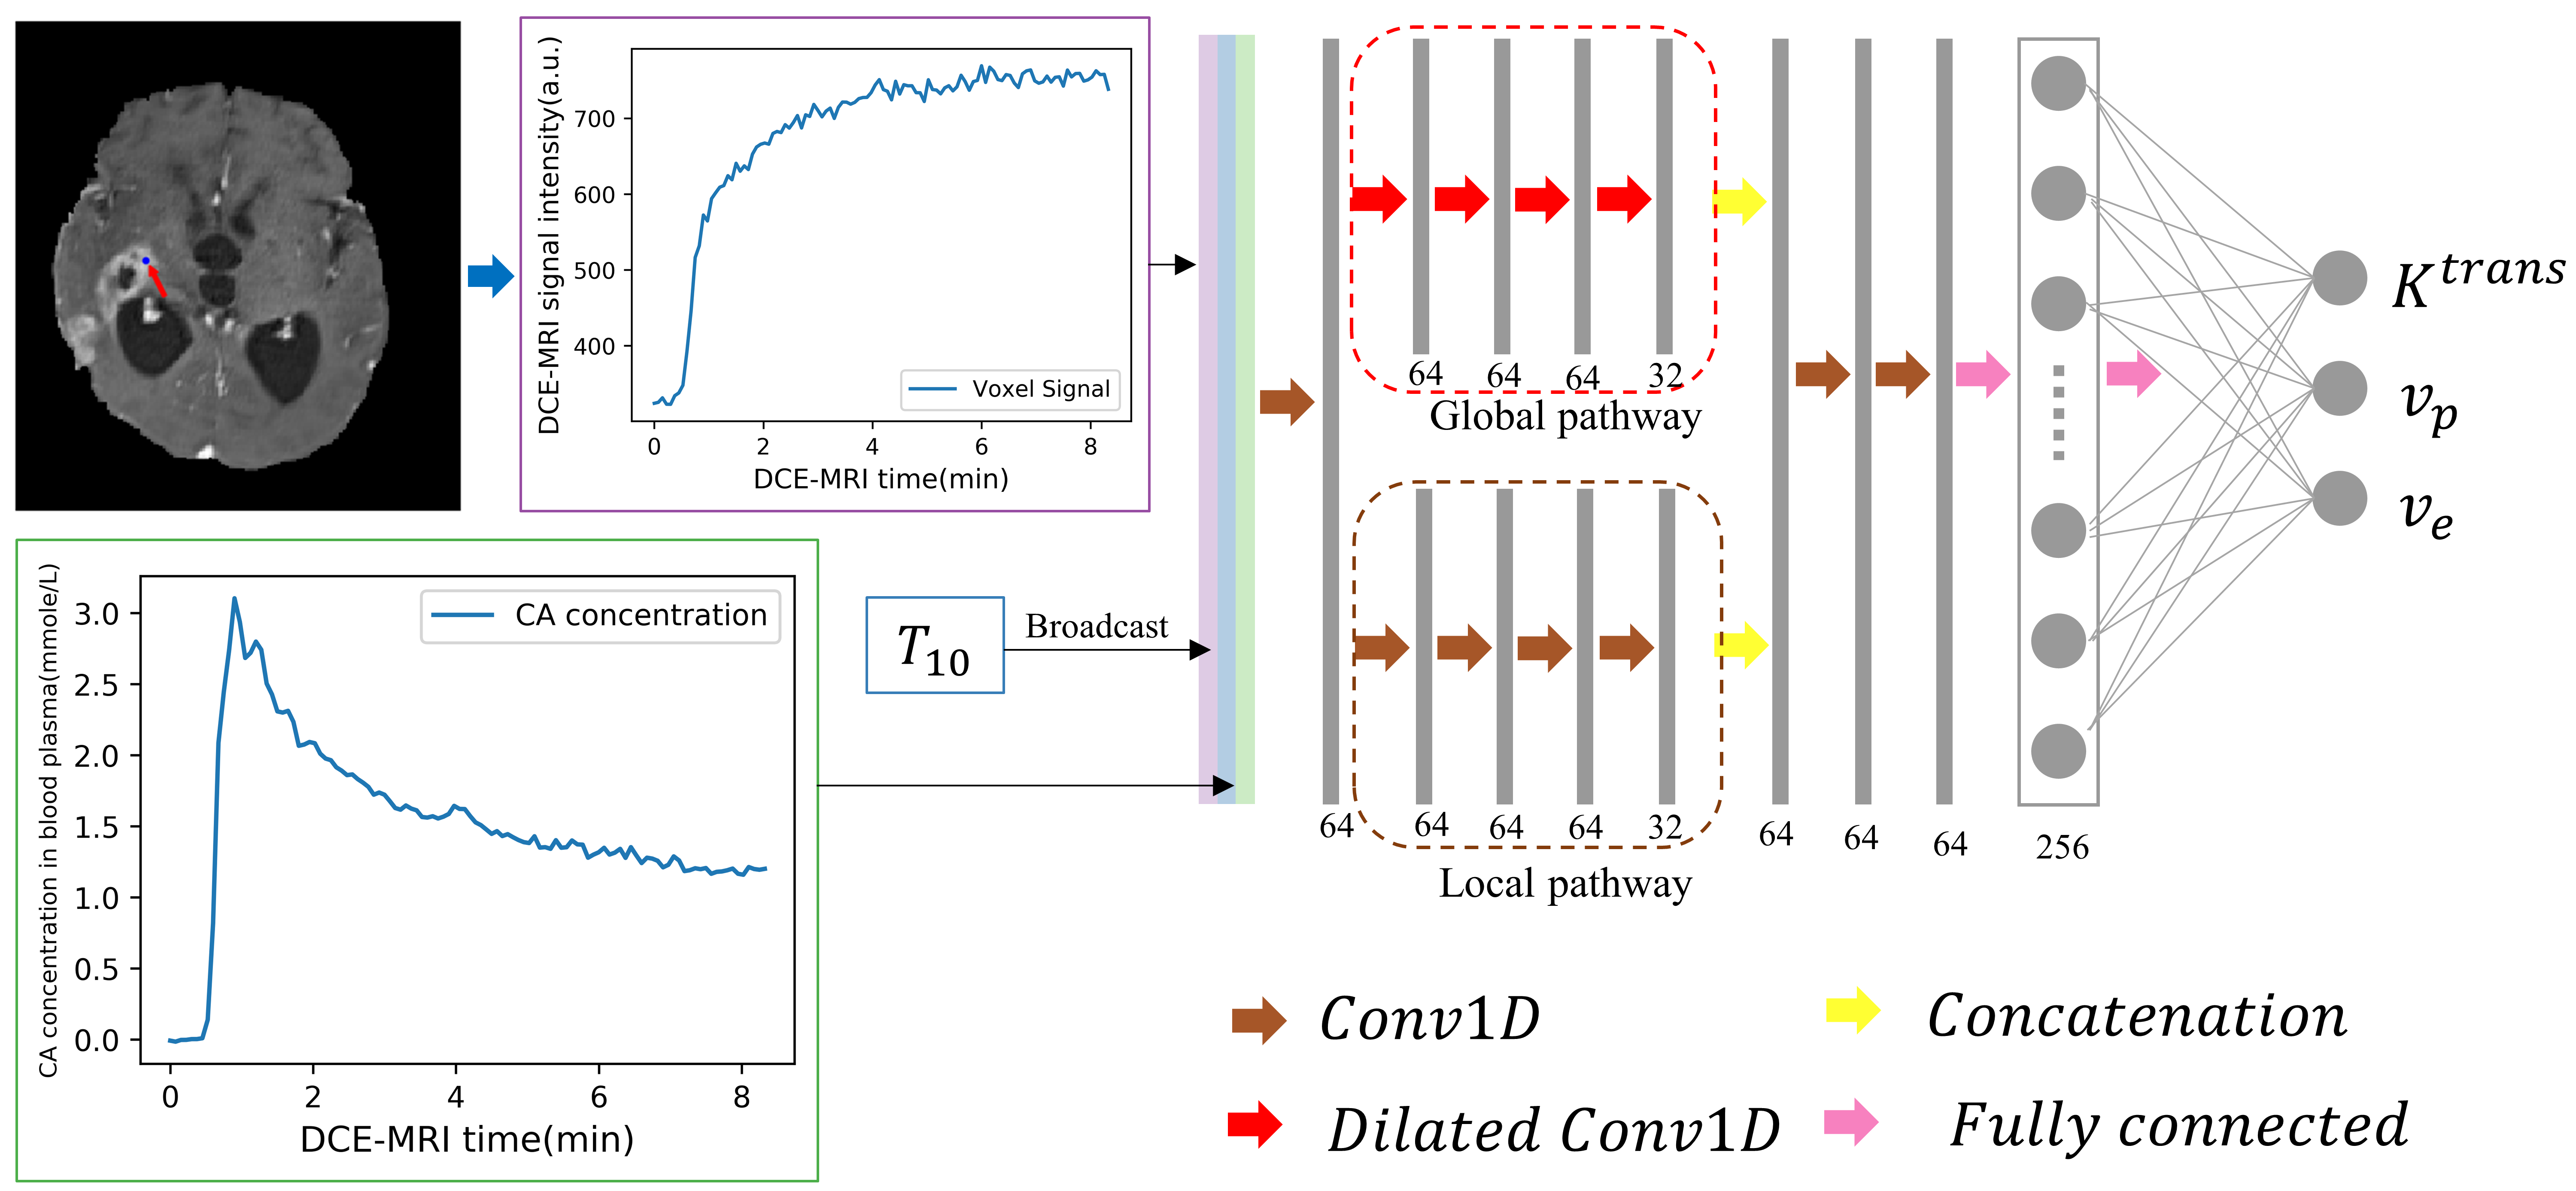
We proposed a customized conventional neural network (CNN) to fasten the computation time of non-linear pharmacokinetic models in DCE-MRI. The results demonstrated that the CNN could shorten the computation time of extended Tofts model of whole-brain data to less than a minute without sacrificing the agreements with conventional non-linear least square (NLLS) fitting. This CNN could serve as an alternative to conventional NLLS fitting for fast assessment of pharmacokinetic parameters in clinical practice.
Introduction
Dynamic contrast-enhanced MRI (DCE-MRI) is a widely used method for the study, diagnosis, and treatment evaluation of many diseases in vivo.1–3 The pharmacokinetic parameters can be estimated through a number of tracer kinetic (TK) models, of which the Extended Tofts (eTofts) model 4,5 is one of the most widely used for analysis of DCE-MRI data 6. However, the fitting of eTofts models is non-linear model and usually performed using a nonlinear-least-squares (NLLS) approach, which involves a large number of iterative operations 7 and is usually computationally expensive.Methods
DCE-MRI data and double flip angle T1 map acquired at 3 T scanner (Magnetom Skyra, Siemens Healthcare, Erlangen, Germany) of 24 patients was used, of which 13 patients with brain glioma were used for training (75%) and validation (25%), and 11 patients (3 glioma, 4 brain metastases and 4 lymphoma) were used for testing. The temporal resolution of the DCE-MRI data was 4.5 s and the voxel size was 0.9 × 0.9 × 1.5 mm3. The total acquisition time for DCE-MRI was approximately 9 min. Sequence details could be found in reference 12.Results
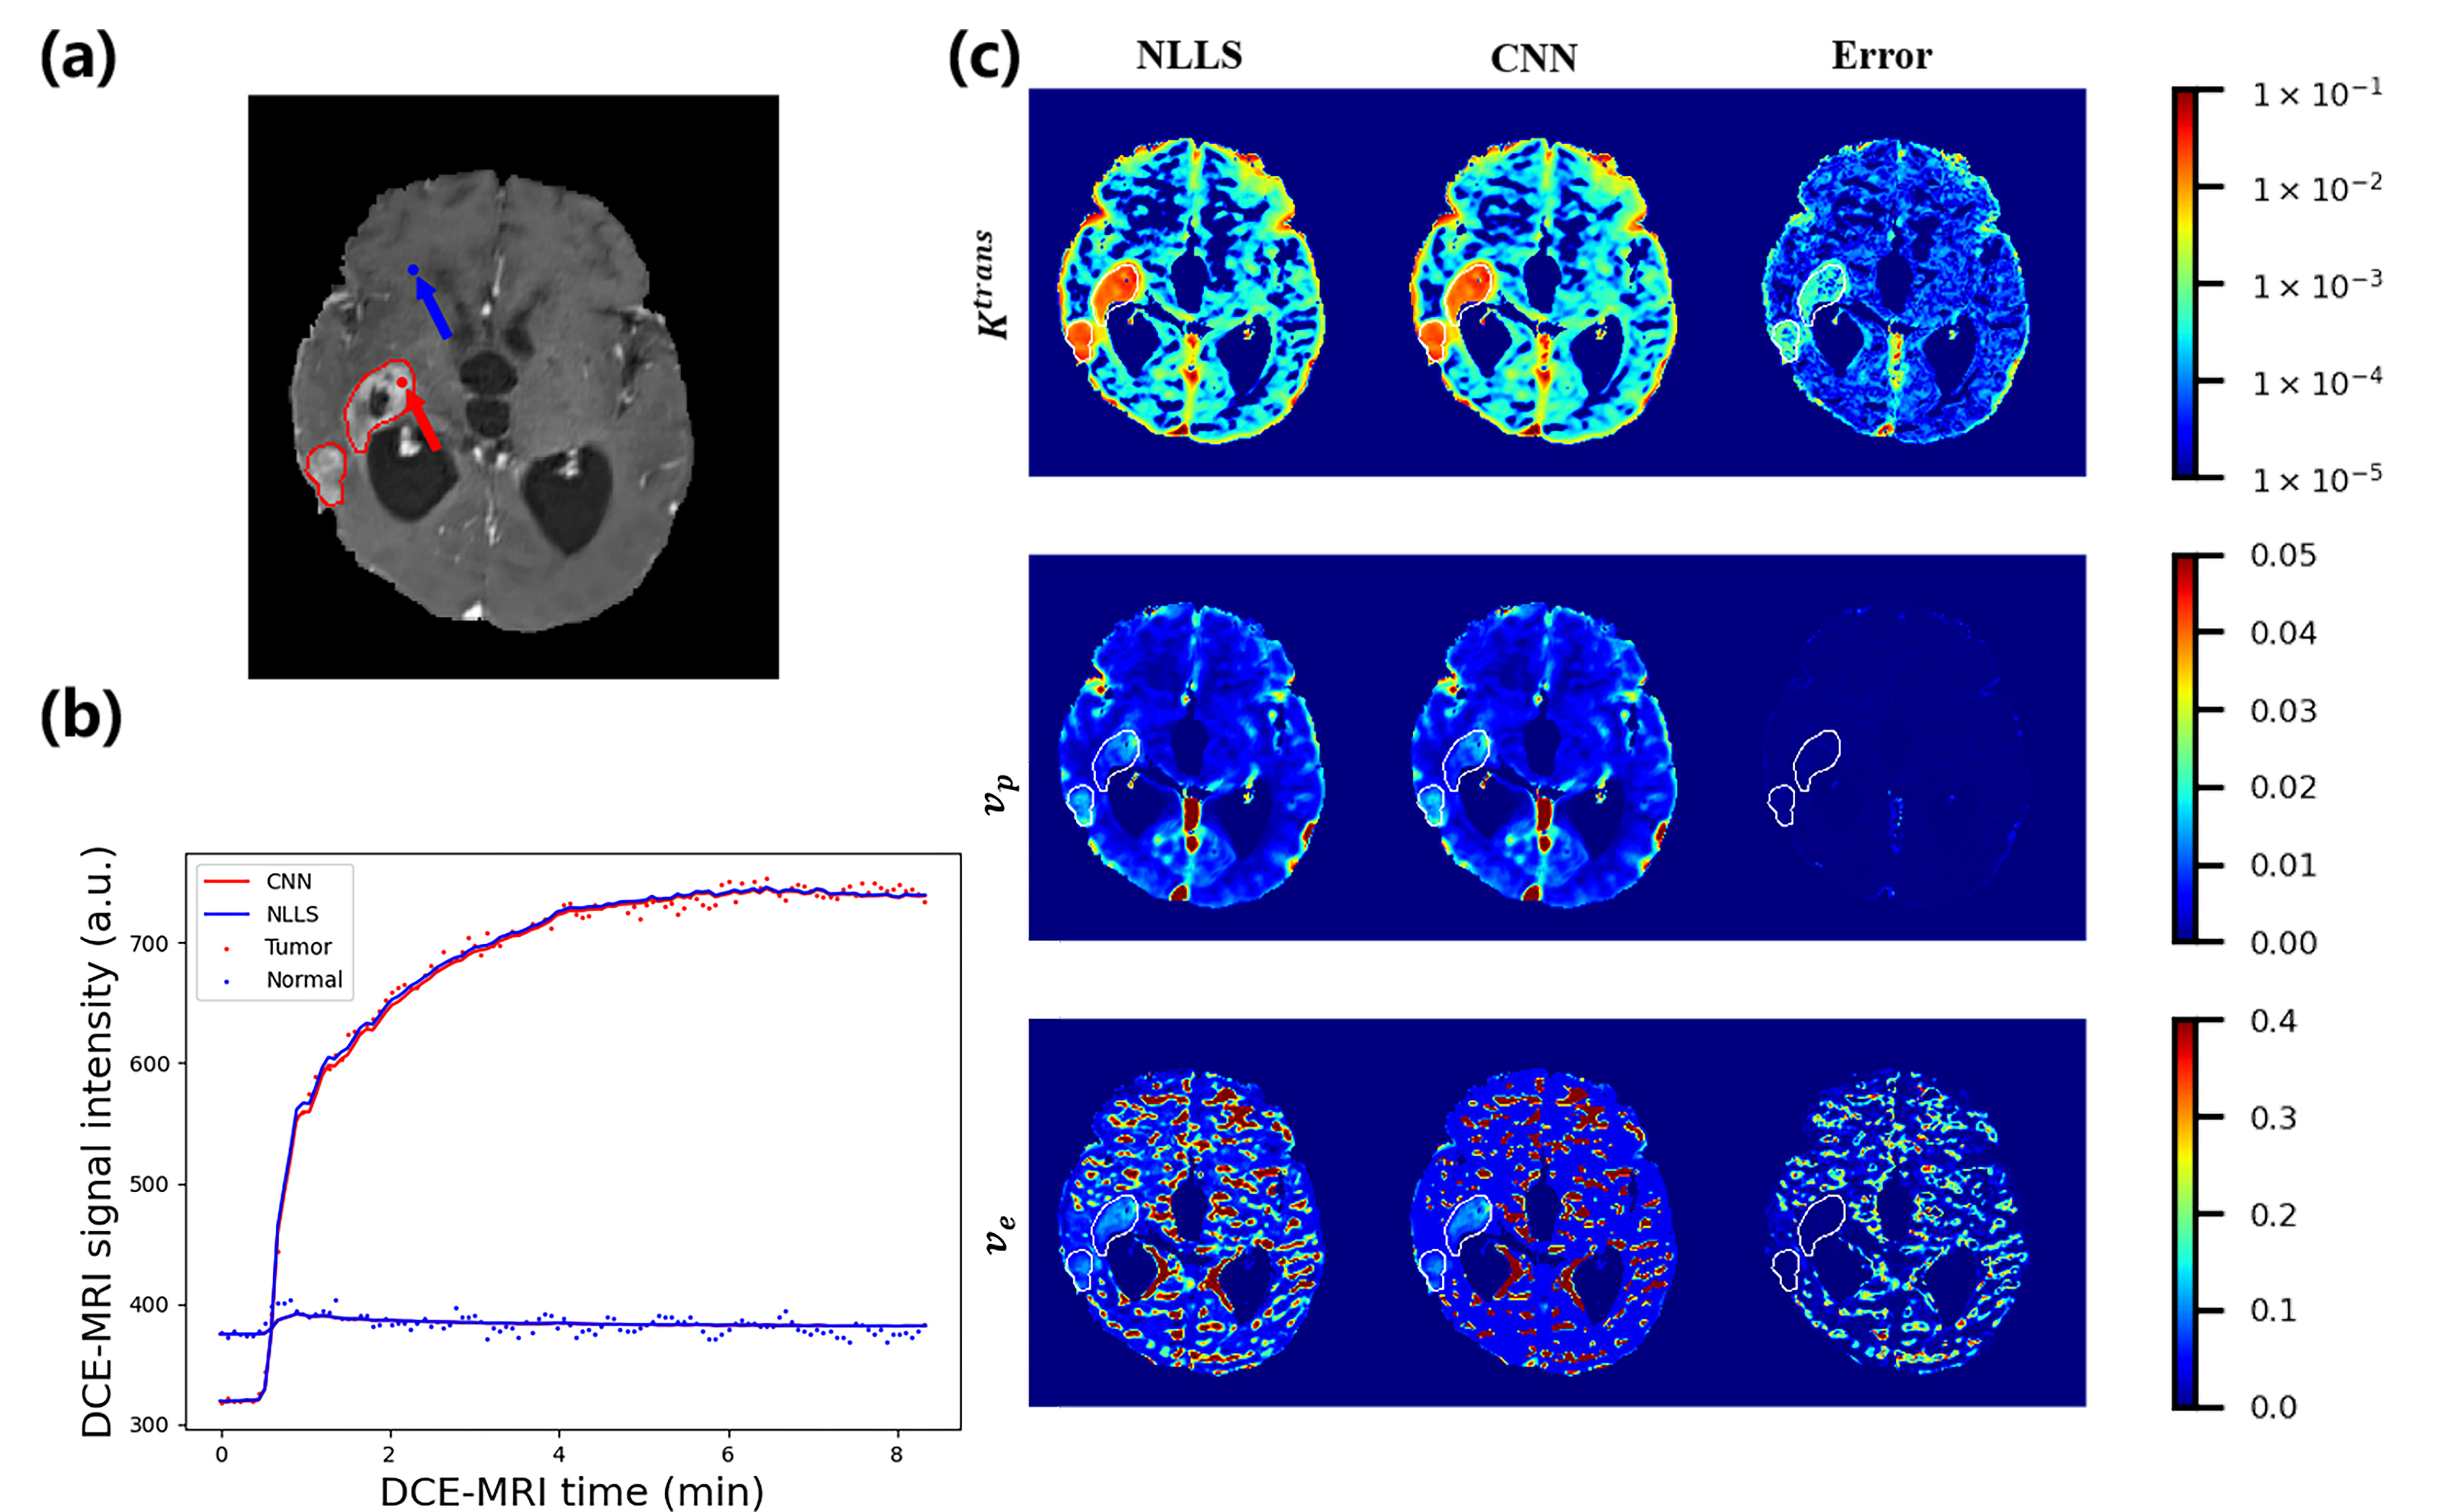
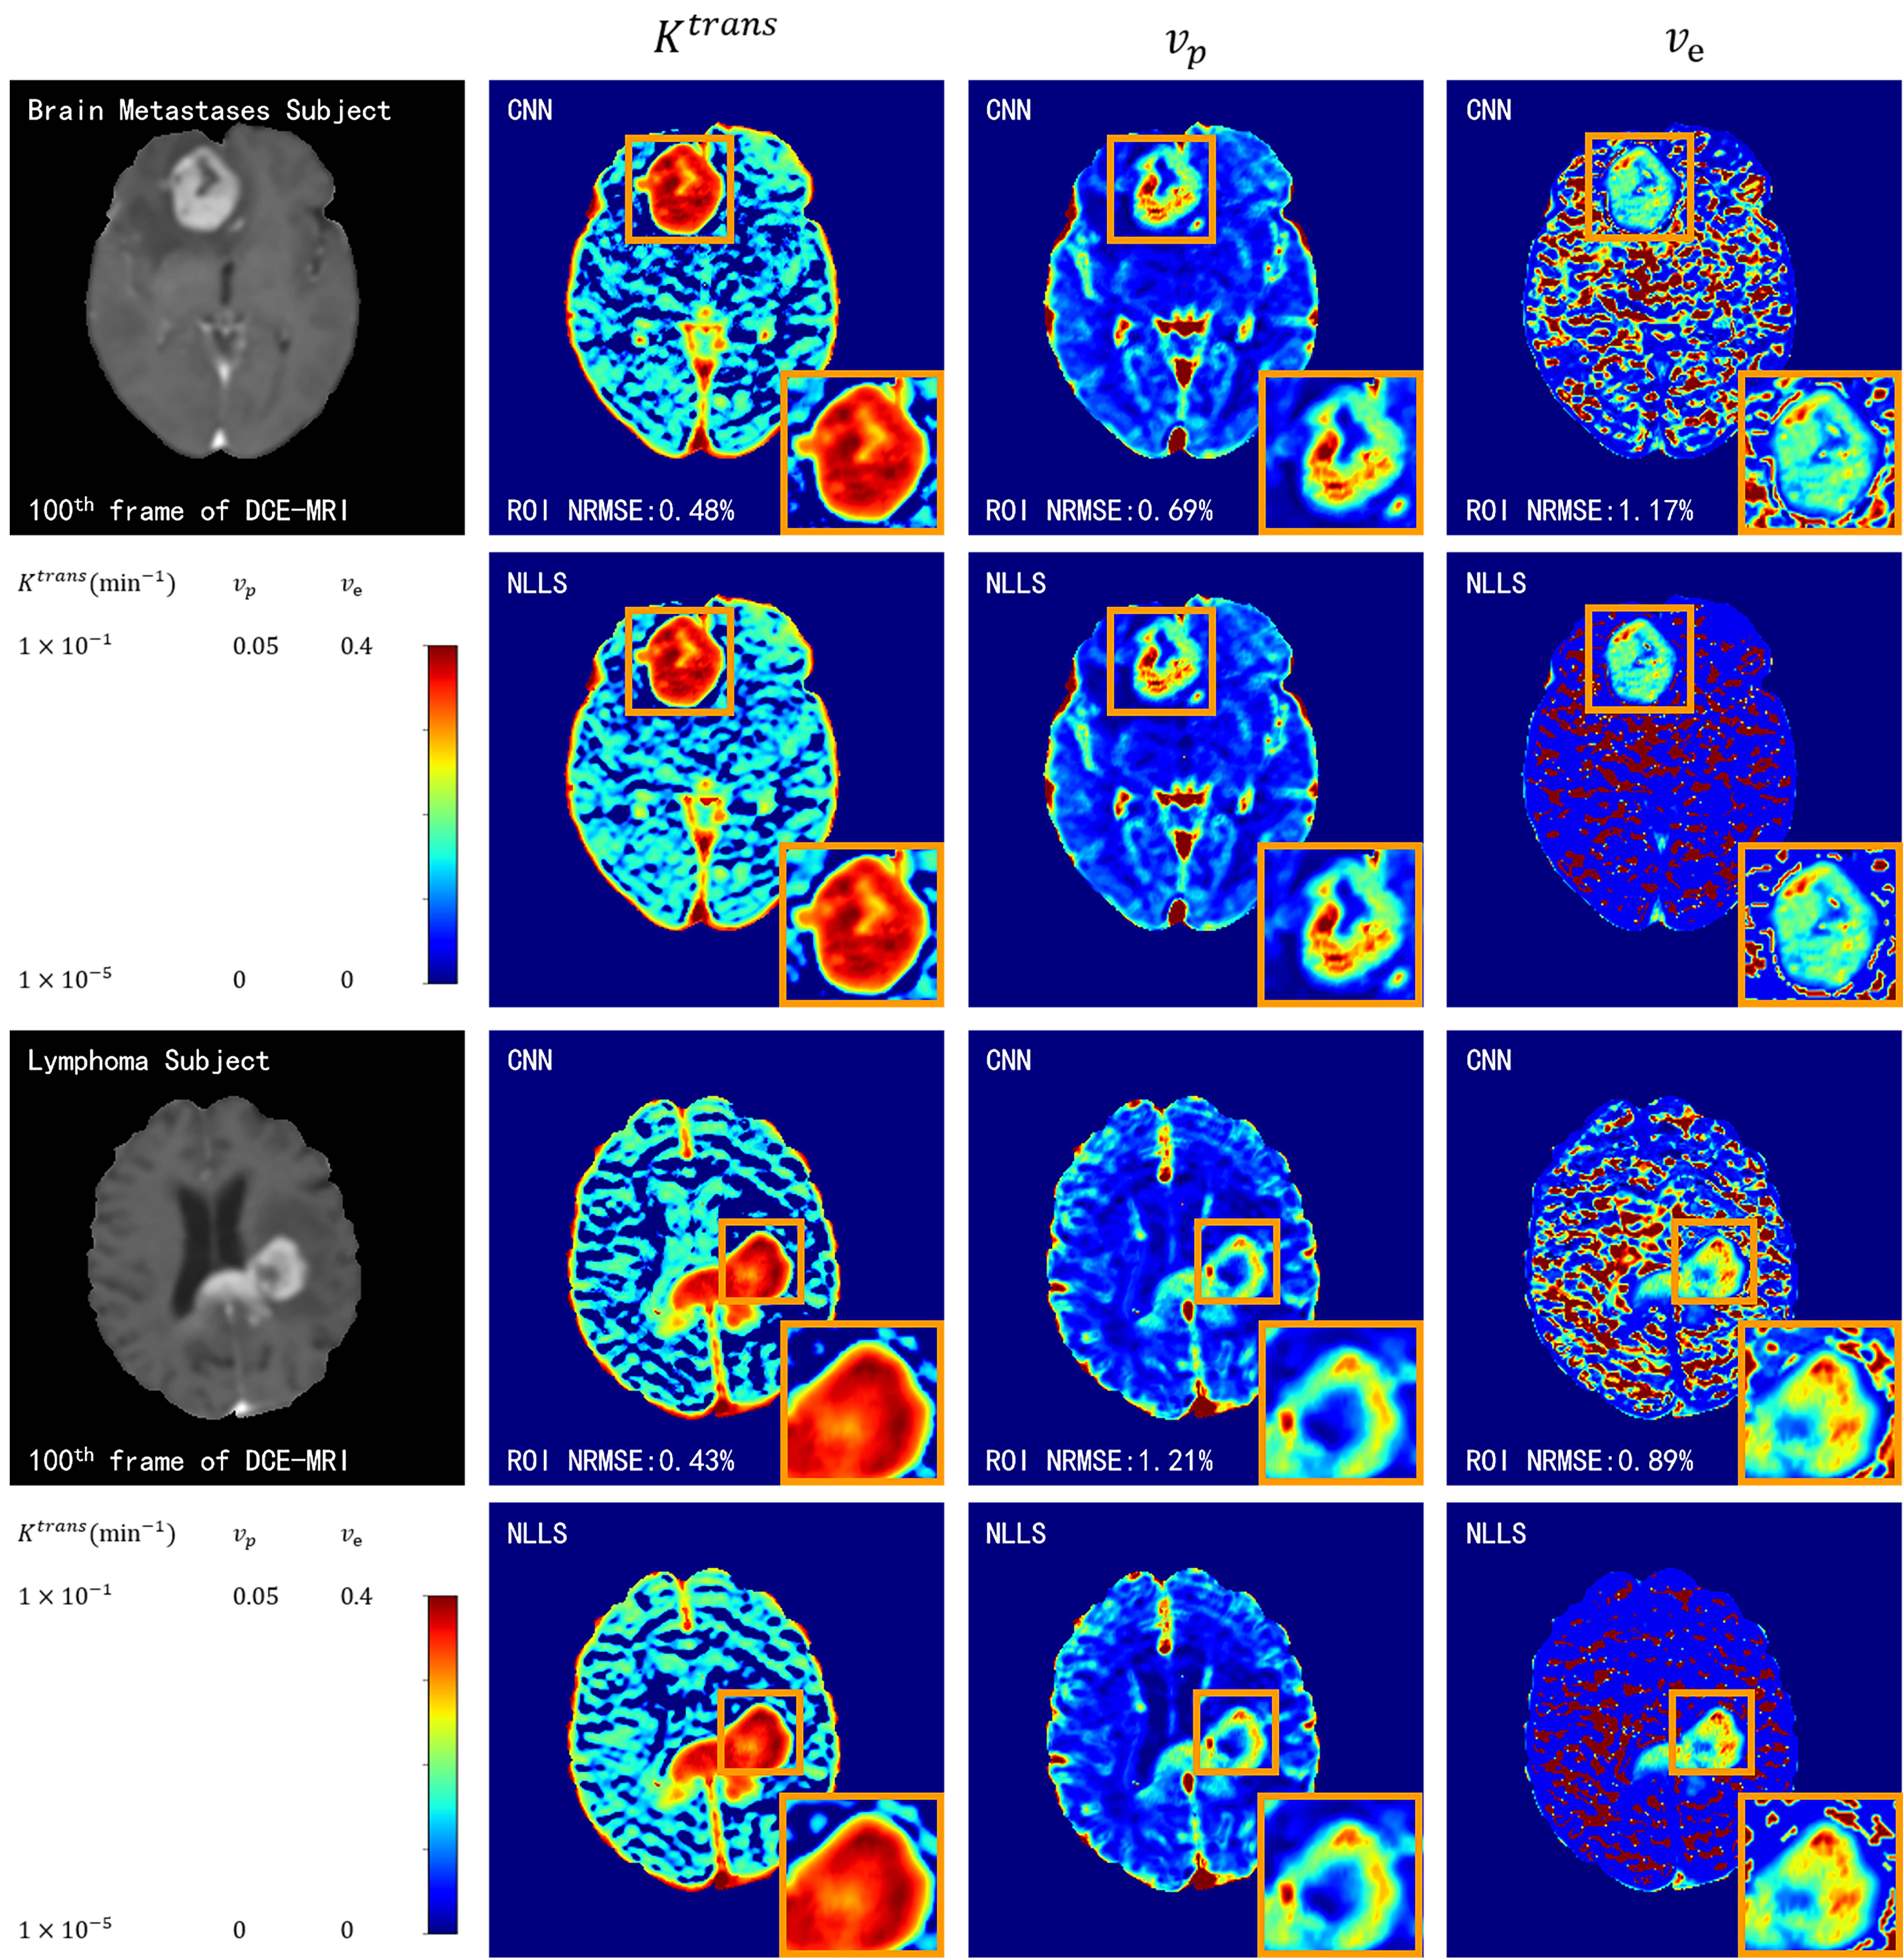
The fitting results of CNN maintain a high degree of agreement with NLLS (Figure 2). In comparison with results obtained with NLLS fitting, CNN yields an average CCC of greater than 0.985 for the estimation of $$$K^{trans}$$$, greater than 0.965 for $$$v_p$$$, and greater than 0.94 for $$$v_e$$$.Discussion
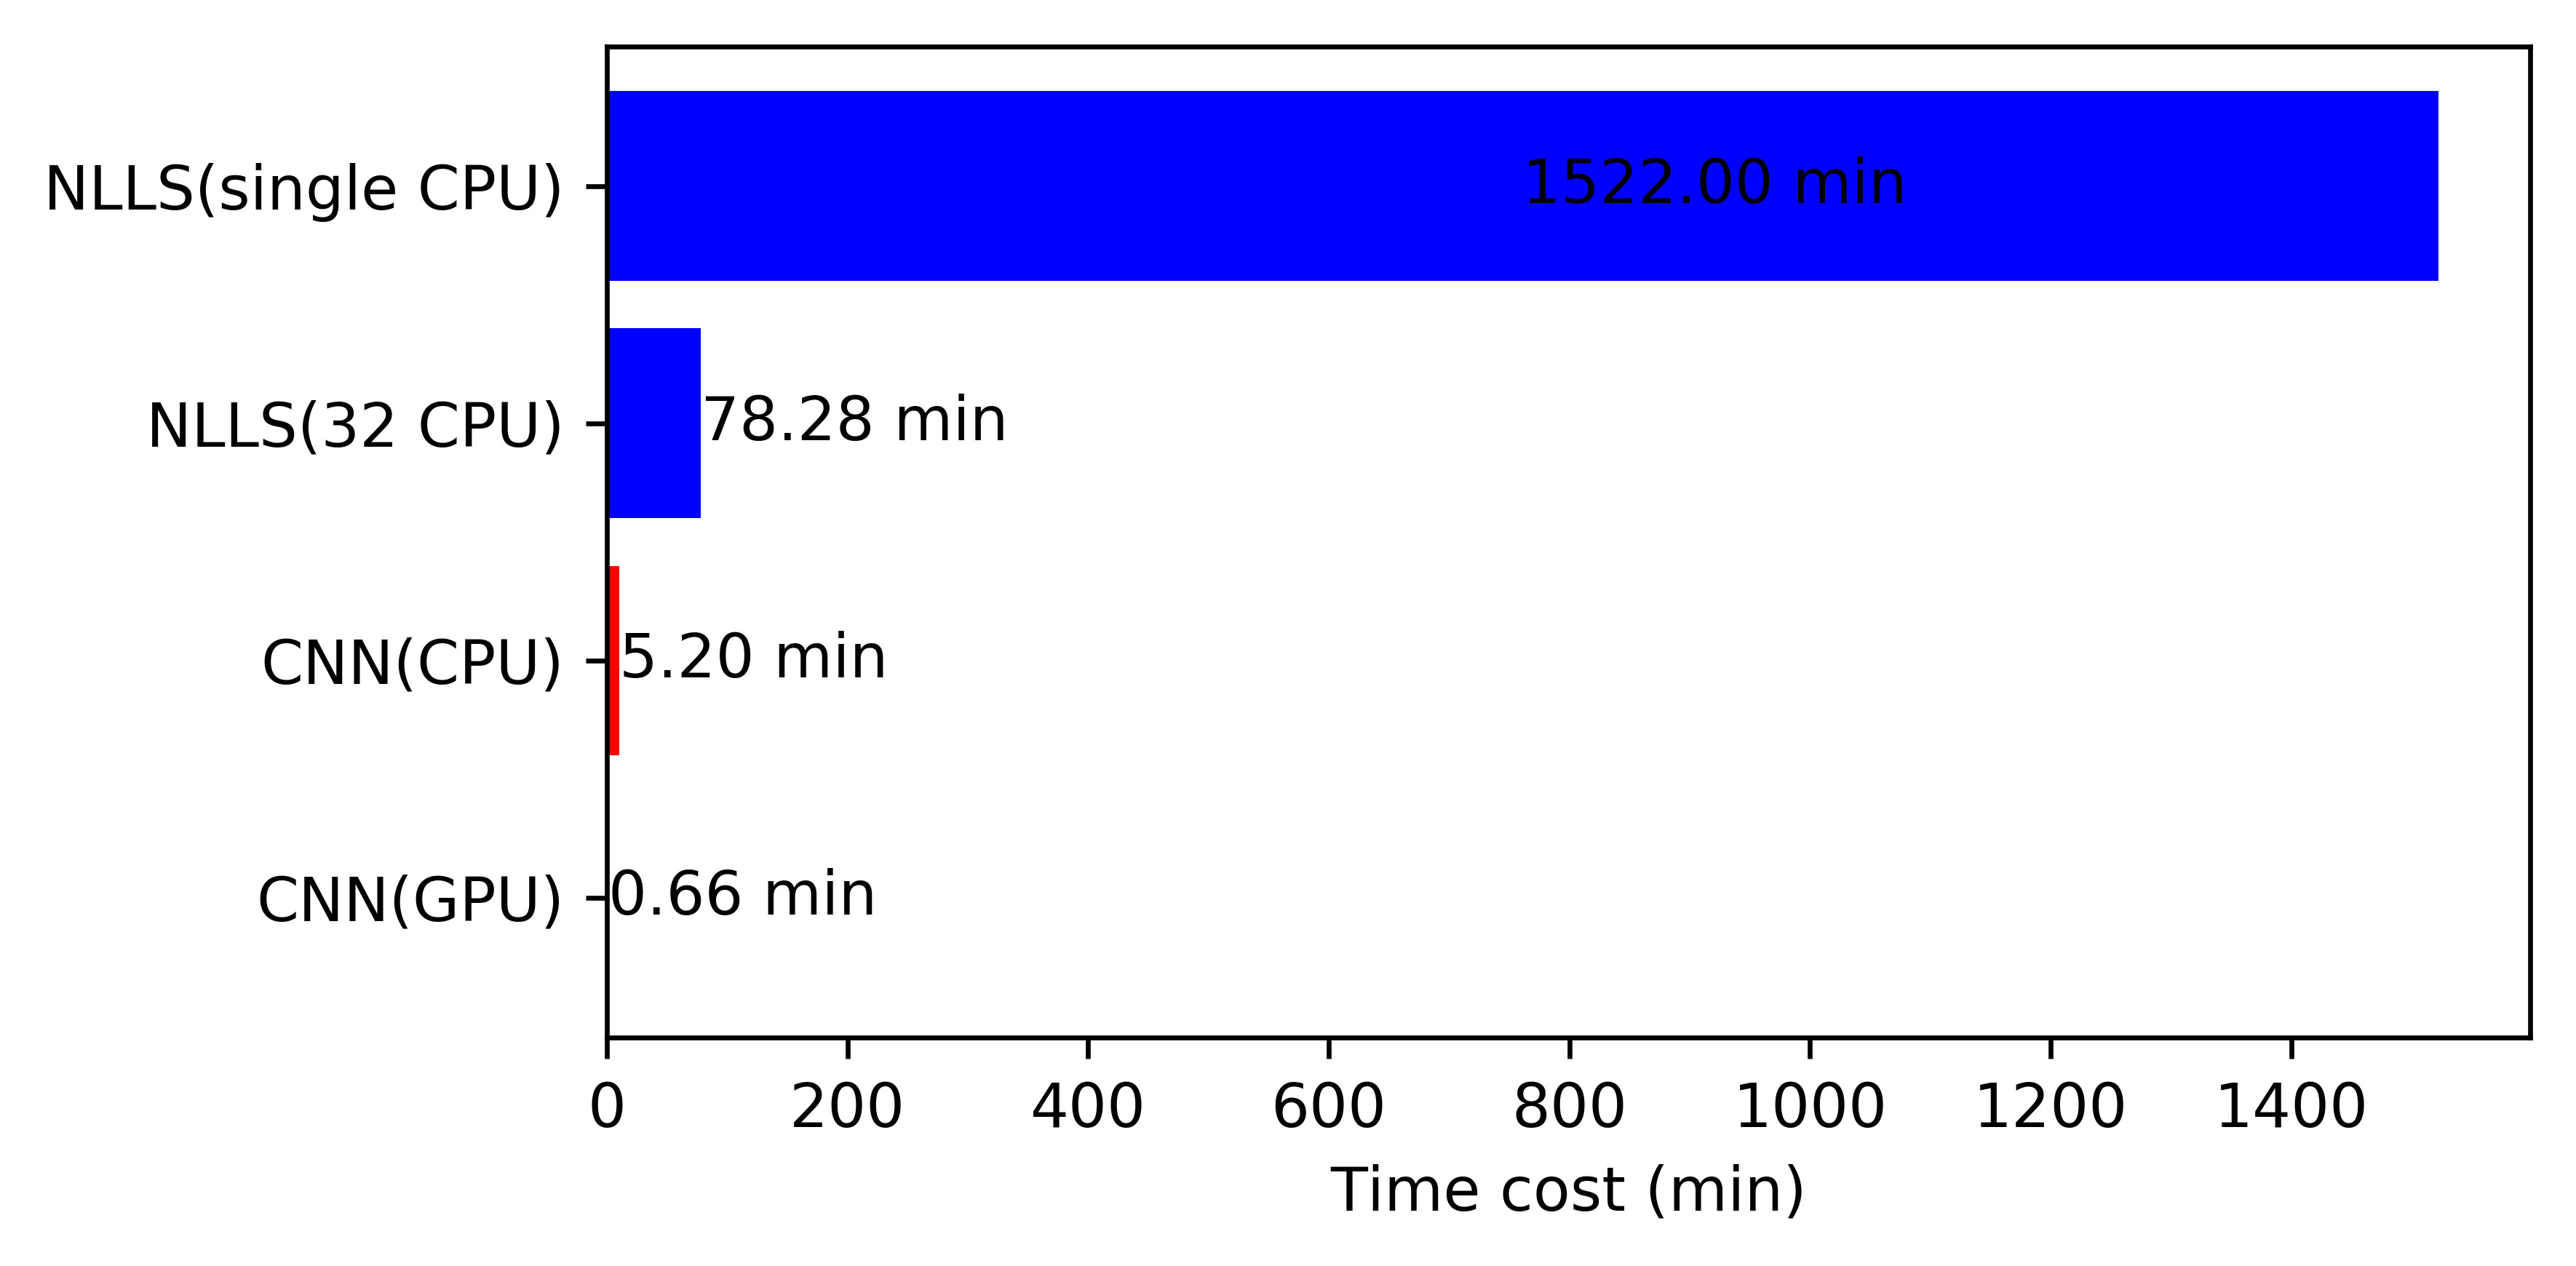
The fast computation speed of CNN is achieved by two factors. At first, CNN avoids the time-consuming, iterative calculations used in NLLS. Secondly, similar to the previous work13, the CNN method can achieve faster computation speed with the support of GPU.Conclusion
The proposed neural network to estimate eTofts parameters showed comparable result as conventional NLLS fitting while significantly reducing the computation time.Acknowledgements
No acknowledgement found.References
1. Collins DJ, Padhani AR. Dynamic magnetic resonance imaging of tumor perfusion. IEEE Eng Med Biol Mag. 2004;23(5):65-83. doi:10.1109/MEMB.2004.1360410
2. Larsson HBW, Stubgaard M, Frederiksen JL, Jensen M, Henriksen O, Paulson OB. Quantitation of blood-brain barrier defect by magnetic resonance imaging and gadolinium-DTPA in patients with multiple sclerosis and brain tumors. Magn Reson Med. 1990;16(1):117-131. doi:10.1002/mrm.1910160111
3. Cramer SP, Simonsen H, Frederiksen JL, Rostrup E, Larsson HBW. Abnormal blood–brain barrier permeability in normal appearing white matter in multiple sclerosis investigated by MRI. NeuroImage: Clinical. 2014;4:182-189. doi:10.1016/j.nicl.2013.12.001
4. Tofts PS. Modeling tracer kinetics in dynamic Gd-DTPA MR imaging. J Magn Reson Imaging. 1997;7(1):91-101. doi:10.1002/jmri.1880070113
5. Tofts PS, Brix G, Buckley DL, et al. Estimating kinetic parameters from dynamic contrast-enhanced t1-weighted MRI of a diffusable tracer: Standardized quantities and symbols. Journal of Magnetic Resonance Imaging. 1999;10(3):223-232. doi:10.1002/(SICI)1522-2586(199909)10:3<223::AID-JMRI2>3.0.CO;2-S
6. Sourbron SP, Buckley DL. On the scope and interpretation of the Tofts models for DCE-MRI. Magn Reson Med. 2011;66(3):735-745. doi:10.1002/mrm.22861
7. Branch MA, Coleman TF, Li Y. A Subspace, Interior, and Conjugate Gradient Method for Large-Scale Bound-Constrained Minimization Problems. SIAM J Sci Comput. 1999;21(1):1-23. doi:10.1137/S1064827595289108
8. Hoppe E, Körzdörfer G, Würfl T, et al. Deep Learning for Magnetic Resonance Fingerprinting: A New Approach for Predicting Quantitative Parameter Values from Time Series. In: GMDS. ; 2017:202–206.
9. Balsiger F, Shridhar Konar A, Chikop S, et al. Magnetic Resonance Fingerprinting Reconstruction via Spatiotemporal Convolutional Neural Networks. In: Knoll F, Maier A, Rueckert D, eds. Machine Learning for Medical Image Reconstruction. Vol 11074. Lecture Notes in Computer Science. Springer International Publishing; 2018:39-46. doi:10.1007/978-3-030-00129-2_5
10. Virtue P, Yu SX, Lustig M. Better than real: Complex-valued neural nets for MRI fingerprinting. In: 2017 IEEE International Conference on Image Processing (ICIP). ; 2017:3953-3957. doi:10.1109/ICIP.2017.8297024
11. Chetlur S, Woolley C, Vandermersch P, et al. cuDNN: Efficient Primitives for Deep Learning. arXiv:14100759 [cs]. Published online December 17, 2014. Accessed December 4, 2020. http://arxiv.org/abs/1410.0759
12. Bai R, Wang B, Jia Y, et al. Shutter-Speed DCE-MRI Analyses of Human Glioblastoma Multiforme (GBM) Data. Journal of Magnetic Resonance Imaging. n/a(n/a). doi:10.1002/jmri.27118
13. Hsu Y-HH, Huang Z, Ferl GZ, Ng CM. GPU-Accelerated Compartmental Modeling Analysis of DCE-MRI Data from Glioblastoma Patients Treated with Bevacizumab. Cercignani M, ed. PLoS ONE. 2015;10(3):e0118421. doi:10.1371/journal.pone.0118421
14. Hansen MB, Tietze A, Haack S, et al. Robust estimation of hemo-dynamic parameters in traditional DCE-MRI models. Schmid VJ, ed. PLoS ONE. 2019;14(1):e0209891. doi:10.1371/journal.pone.0209891
15. Cuenod CA, Balvay D. Perfusion and vascular permeability: Basic concepts and measurement in DCE-CT and DCE-MRI. Diagnostic and Interventional Imaging. 2013;94(12):1187-1204. doi:10.1016/j.diii.2013.10.010
Figures