1857
Disentangling the heterogeneity of MCI condition by unsupervised clustering of brain measurements on ASL and T1w MR imaging1FiRMLAB, IRCCS Stella Maris Foundation, Pisa, Italy, 2IRCCS Stella Maris Foundation, Pisa, Italy, 3Institute of Neuroscience of the CNR, Pisa, Italy, 4the Train the Brain Consortium, Pisa, Italy
Synopsis
One of the main challenges in identifying people at risk of dementia is their clinical heterogeneity. One hypothesis is that the clinical symptoms may be the result of different biological processes. We applied a data-drive clustering approach on structural and perfusion brain-MR imaging on a cohort of 141 MCI subjects in order to elucidate homogeneous structural and perfusion profiles and we observed the correspondent clinical features. Unsupervised clustering identified 6 different clusters on both ASL and gray matter volume data. Perfusion and atrophy showed to be variable in the different clusters and showed dissimilar patterns at subcortical and cortical levels.
Introduction
Neurodegenerative disorders during aging are among the most impactful diseases in societies. The lack of understanding of the underpinning neurophysiological processes has led so far to substantial failures in their treatment. One of the main challenges is the heterogeneity of subjects at risk of dementia, whose clinical symptoms can be the result of different biological processes. Discovery of effective treatments can thus be hindered by this heterogeneity, which potentially determines beneficial effects for small subgroups but ineffectiveness when trials are conducted on the overall population. In this study, we aimed to identify homogeneous subgroups of aged subjects at risk of dementia through unsupervised machine learning techniques applied to anatomical and perfusion MR neuroimaging.Methods
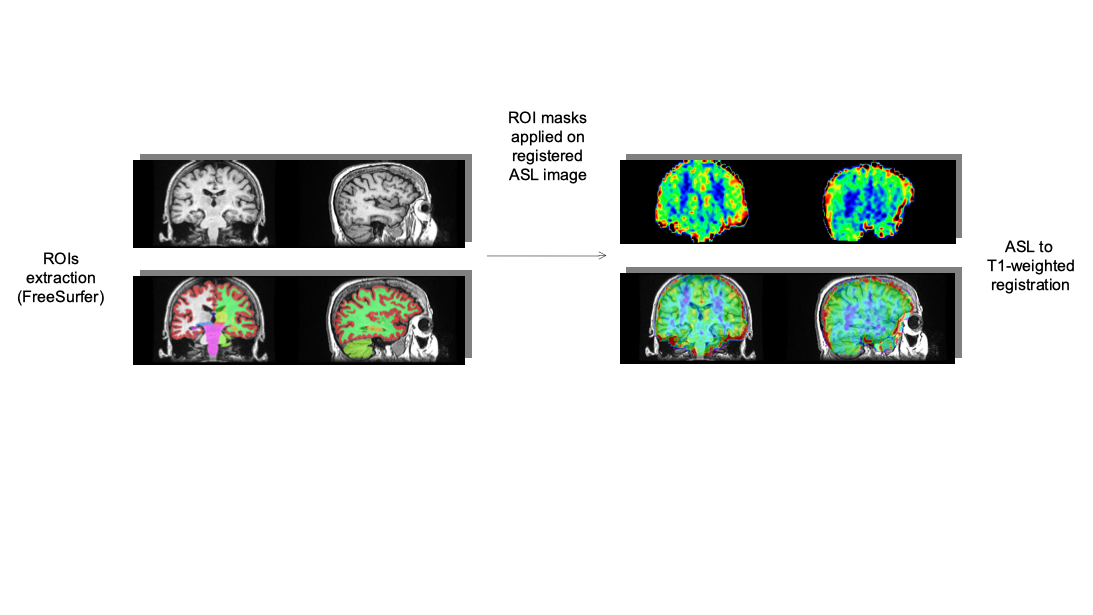
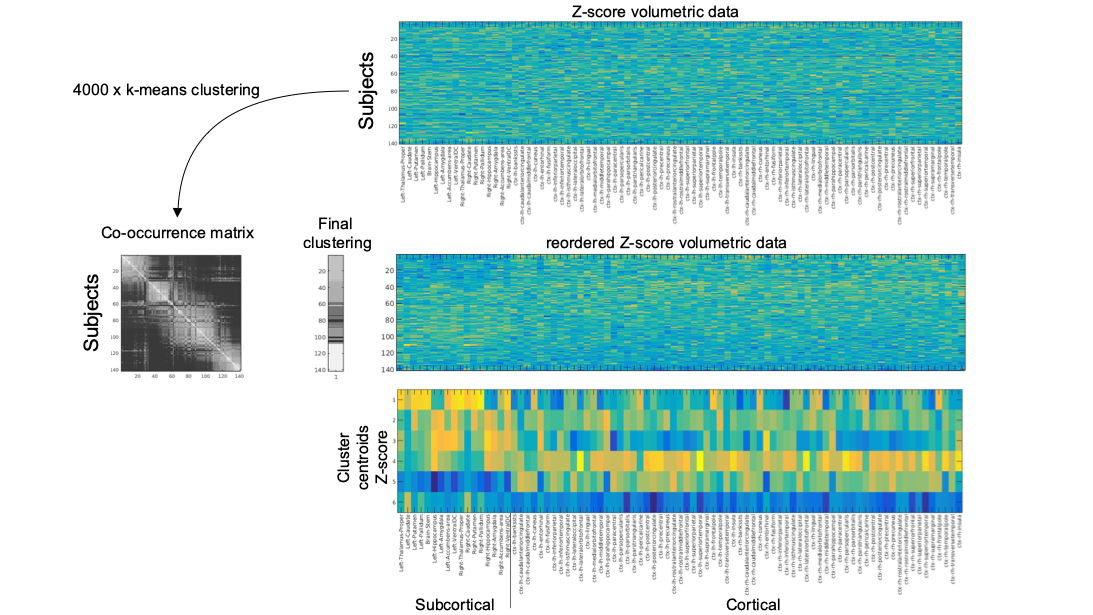
A cohort of 141 elderly subjects (64÷85 years, mean 74.8±4.8) was recruited. According to current guidelines1, they were all confirmed at the neurological examination as MCI. The following neuropsychological scores were gathered: MMSE, digit span test, Rey words (immediate and delayed recall), Rey Figure (copy, immediate and delayed recall), Phonemic fluency test, Corsi test, attentive matrices test , ADAS-cog. Besides clinical evaluation, all subjects underwent a MR exam of the brain at a 1.5T scanner (GE healthcare). MRI protocol included a T1-weighted 3D FSPGR sequence (TR/TE=12650/5300 ms, prep time=700 ms, NEX=1, isotropic voxel=1×1×1 mm3) and a 3D pseudo-continuous Arterial Spin Labeling (pCASL) (TR/TE = 4850/10 ms, NEX=4, pld=2025 ms, spiral acquisition with 512 sampling points on eight spirals, spatial resolution = 3.64 mm, slice thickness = 4 mm). The gray matter was segmented on T1-weighted scans through the FreeSurfer recon-all utility2 and 87 ROIs (19 subcortical and 68 cortical) were identified. After ASL and T1-weighted registration trough ANTs utilities3, for each ROI the gray matter volume (normalized to the supratentorial volume) and the median of the ASL signal was measured. The preprocessing steps are shown on figure 1. The ASL and the gray matters volumes data were separately processed through an unsupervised clustering method to identify homogeneous subgroups of subjects. The clustering was based on a consensus clustering approach through a k-means algorithm. Since k-means algorithm requires a predetermined number of clusters and produces different solutions depending on the starting point, we iterated 4000 times the clusterization by varying both the number of clusters (from 2 to 10) and the starting points. In order to pick a final clustering solution a new clusterization was performed on the clusters co-occurrence matrix of the subjects. The results of the clusterization procedure applied on the gray matter structural measurements along with the centroids of the obtained clusters are shown on figure 2. Neuropsychological variable distributions were then compared across clusters with two tails T tests in order to identify significant clinical differences across the clusters identified through imaging data analysis.Results
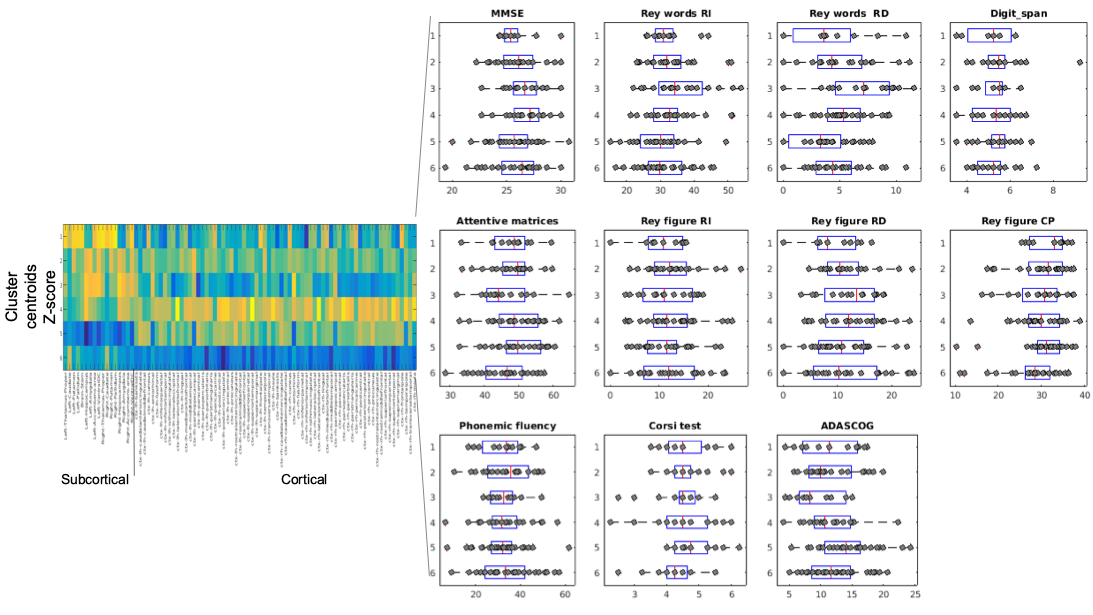
Unsupervised clustering identified 6 different clusters on both ASL and gray matter volume data. Cerebral blood flow showed to be variable in the different clusters and showed dissimilar patterns at subcortical and cortical levels. On the other hand, the patterns of atrophy showed peculiar characteristics in different clusters (atrophy limited to subcortical areas, widespread, limited to cortical areas but with deep structures spared from degeneration, see cluster centroids representation in figure 2). Some of the identified clusters showed to be different also when compared at clinical level (figure 3) , with higher Mini Mental Score Examination (MMSE) and Rey Auditory Verbal Learning Test values, and lower ADAS-cog values in clusters with higher perfusion levels and lower atrophy (see for example centroid of cluster 4, which exhibits the highest values in term of gray matter volumes across the whole brain and the correspondent MMSE median value which is the highest with respect to the other clusters). Regarding other clinical features, significant differences (p value < 0.05 in a two-tail T-test) were for example detected in Rey Auditory Verbal Learning test in delayed recall (figure 3) between cluster 1/cluster 3, cluster 2/cluster 3, cluster 3/cluster 5, cluster 4/cluster 5.Discussion
The proposed data-driven approach seems to be able to provide a novel insight into neurodegenerative brain alterations both at structural and cerebral blood flow level. The clusters, which were identified with imaging measurements data only, seem to exhibit clinical score distributions which are coherent with the severity of the symptoms along with some peculiar behaviours which might be due to the elucidated patterns of atrophy or cerebral blood flow reduction. Future studies need to validate these findings on bigger and multi-centric cohorts to open the possibility of developing tailored interventions for patients with specific disease profiles.Conclusion
Unsupervised clustering of ASL and structural MR imaging of the brain seems to be beneficial in differential diagnosis of subjects at risk of dementia and are promising for the discovery of effective and personalized dementia prevention treatments.Acknowledgements
This work has been partially supported by the following fundings:
CARIPLO 2015-0594 "A systematic molecular study of neuroimmune dysregulation in aging"
Fondazione Pisa, 2017 “A translational study on inflammation and aging”
References
1-Sperling et al. Alzheimer’s and Dementia, 7(3), 270-279, 2011
2-Fischl et al. Neuron, 33(3):341-55, 2002
3-Avants et al. Neuroimage 54(3):2033-44, 2011
Figures