1852
Free-breathing Renal Perfusion Imaging with Multi-Delay Arterial Spin Labeling Using Subspace-Based Fast MR1Gordon Center for Medical Imaging, Department of Radiology, Massachusetts General Hospital and Harvard Medical School, Boston, MA, United States, 2LTCI, Télécom Paris, Institut Polytechnique de Paris, Paris, France
Synopsis
Renal perfusion imaging with multi-delay arterial spin labeling (ASL) can provide multi-parametric information along with more robust quantification of renal blood flow. However, renal perfusion imaging with ASL is challenging especially due to respiratory motion. This work presents a subspace-based fast MR method for free-breathing multi-delay ASL imaging of the kidney. The feasibility of the proposed method is shown using in vivo data obtained from a healthy volunteer on a 3T MR scanner.
Introduction
Renal perfusion imaging with multi-delay arterial spin labeling (ASL) can provide multi-parametric information along with more robust quantification of renal blood flow1,2. However, renal perfusion imaging with ASL is challenging especially due to respiratory motion. Methods utilizing multiple breath-holds3-6 or respiratory triggered acquisitions7-9 have been proposed to resolve respiratory motion in multi-delay ASL imaging of the kidney. However, multiple breath-hold scans are difficult to perform in patient populations and respiratory triggering methods work at the expense of scan time. In this work, we present a subspace-based fast MR method for free-breathing multi-delay ASL imaging of the kidney. In vivo experiment was performed to test the feasibility of the proposed method for free-breathing multi-delay ASL imaging of the kidney.Methods
The imaging function of ASL signal $$$\rho(x,t)$$$ is modeled as PS functions10-13:$$\rho(x,t) = \sum_{l=1}^{L} U_{l}(x)V_{l}(t) \;\;\;\;\;\;\;\;\;\;\;\; (1)$$
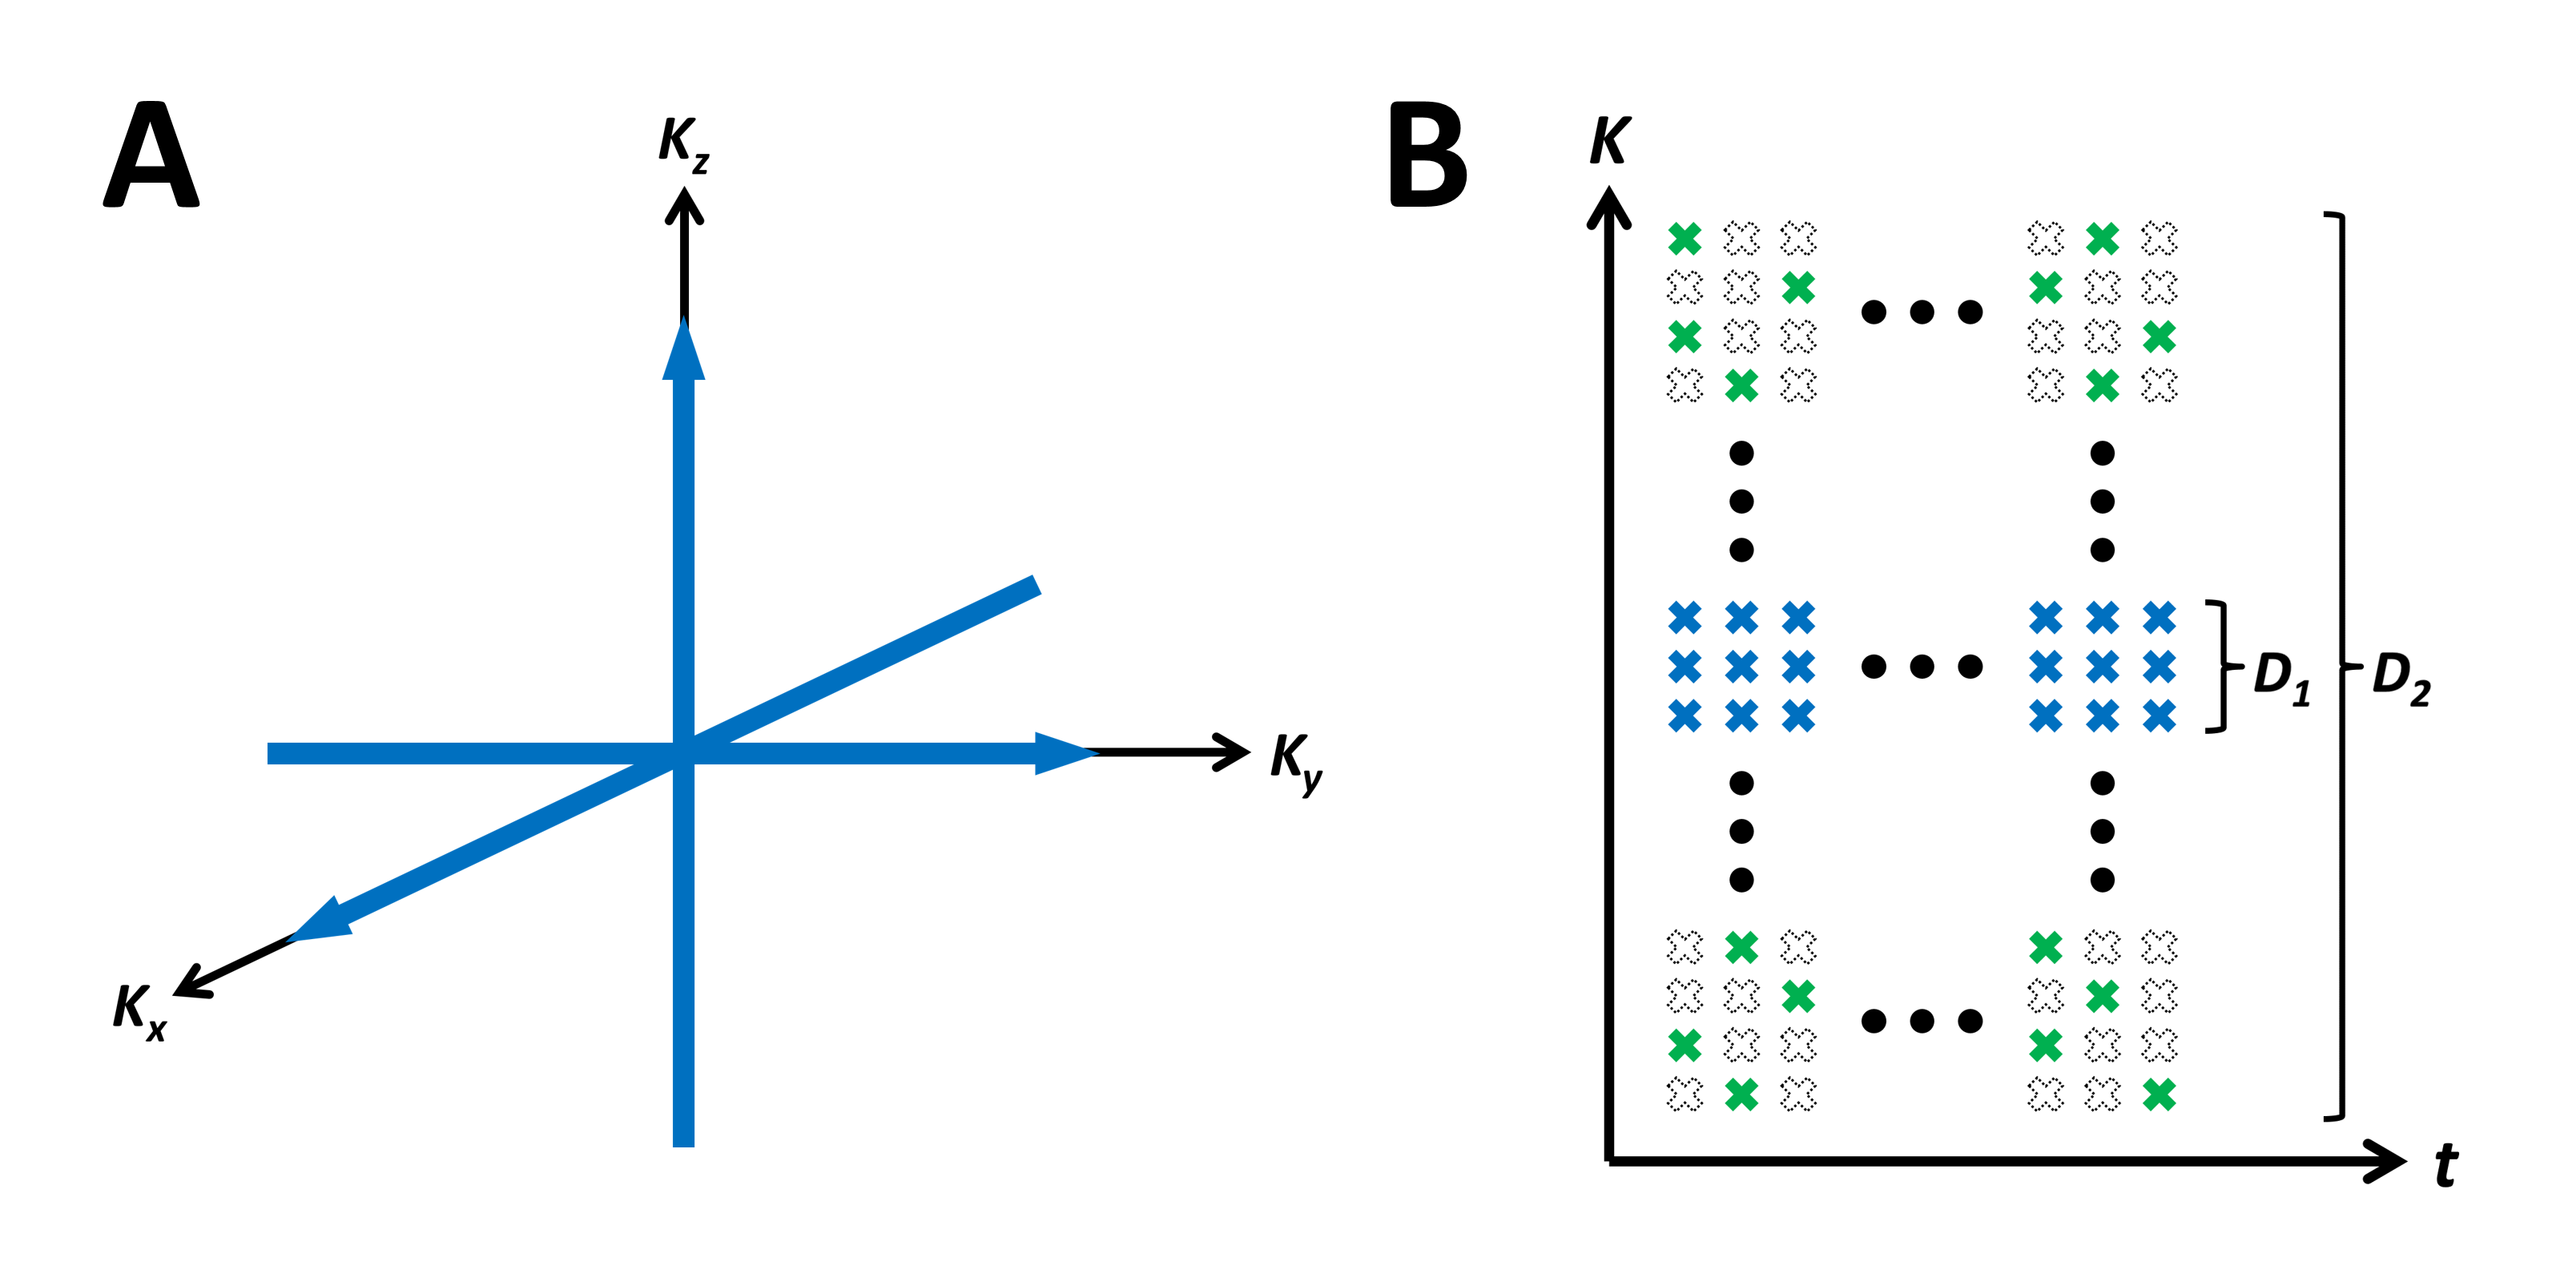
where $$$U_{l}(\cdot)$$$ and $$$V_{l}(\cdot)$$$ each denotes the spatial and temporal basis functions, respectively, $$$x$$$ denotes spatial dimension, $$$t$$$ denotes clock time, and $$$L$$$ denotes model order. The proposed model indicates that the spatio-temporal imaging function resides in a low-dimensional subspace and thus can be recovered even from an under-sampled data as long as the temporal basis functions $$$V_{l}(t)$$$ are estimated and sufficient number of measurements (e.g., greater than model order $$$L$$$) are sampled. $$$V_{l}(t)$$$ can be estimated from training data (D1) acquired with high sampling rate at a limited number of locations near the $$$k$$$-space center (Fig.1a). All other $$$k$$$-space locations are sparsely-sampled randomly across the entire $$$(k,t)$$$-space for the imaging dataset (D2) to ensure sufficient number of measurements are sampled at each location for image reconstruction (Fig. 1b).
Once the temporal basis functions $$${\hat V}_{l}(t)$$$ are determined, the spatial basis functions $$$U_{l}(x)$$$ can be estimated by fitting the model in Eq.1 to the sampled $$$k$$$-space data:
$$\underset{U_l(x)}{\operatorname{argmin}}||d(k,t)-A\{\rho(x,t)\}||_2^2 + R(\{\rho(x,f)\}) \;\;\; s.t. \;\; \rho(x,t) = \sum_{l=1}^{L} U_{l}(x){\hat V}_{l}(t) \;\;\;\;\;\;\;\;\;\;\;\; (2) $$
where $$$d(k,t)$$$ denotes the sparsely-sampled $$$k$$$-space measurement of ASL imaging data, $$$A$$$ denotes the transformation from image-space to k-space, and $$$R(\cdot)$$$ denotes the regularization penalty. In this work, we have defined $$$A=\Omega F_s$$$, where $$$\Omega$$$ denotes the sampling matrix, and $$$F_s$$$ denotes the spatial Fourier transform matrix.
Results and Discussion
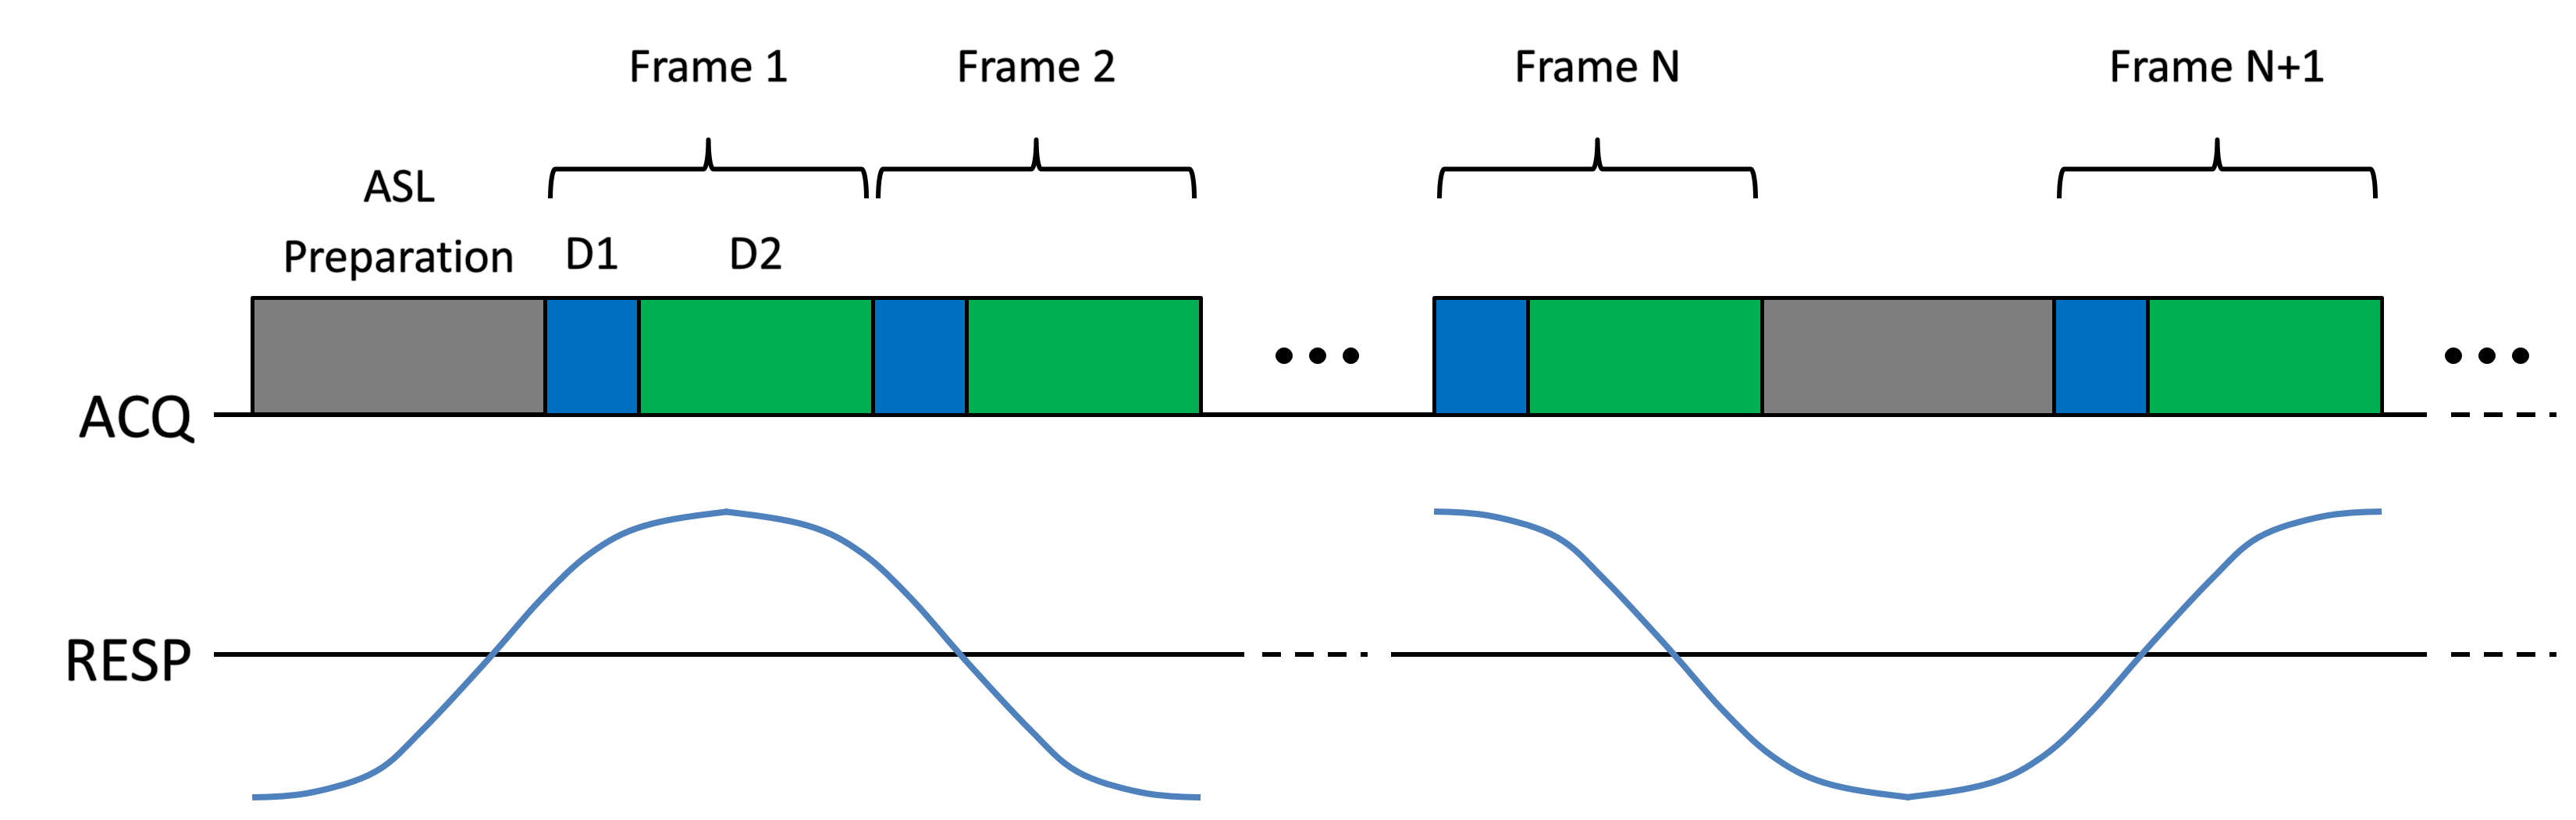
One healthy volunteer was imaged using a whole-body 3-T MR scanner (TIM Trio, Siemens Healthcare, Erlangen, Germany) under a study protocol approved by our local Institutional Review Board. Imaging was performed using a scheme with repeated acquisition of ASL preparation pulse followed by a continuous series of data acquisition to acquire images at multiple PLD times and to maximize data sampling efficiency (Fig.2). Pseudo-continuous ASL (pCASL)14-15 pulse was applied at an axial labeling plane 10cm superior to the center of the right kidney with conventional pCASL labeling parameters16. Data was acquired using spoiled gradient echo readout with the following imaging parameters: image orientation=coronal, field-of-view (FOV)=340$$$\times$$$340mm, matrix size=128$$$\times$$$128, slice thickness=10mm, TR/TE=3.4/1.9ms, flip angle=6°, number of phase-encoding (PE) lines sampled per ASL pulse=750, number of PE lines sampled per frame=10 (frame rate=34ms; 3 lines for D1 and 7 lines for D2), and total acquisition time=3.3min.In this work, L1-norm regularization was used for $$$R(\cdot)$$$ and the reconstruction problem in Eq.2 was solved using an algorithm based on half-quadratic regularization12. The reconstructed clock time images were binned to different respiratory motion phases by evaluating the 1D profile at the center of liver. The binned images were further grouped into control/label images at different PLD times by correlating clock time with PLD times. The perfusion-weighted images were generated for each PLD by normalizing the difference images between label and control scans at the same respiratory motion phase with the control images from the earliest PLD time (i.e., least affected by RF pulses from readout) as M0.
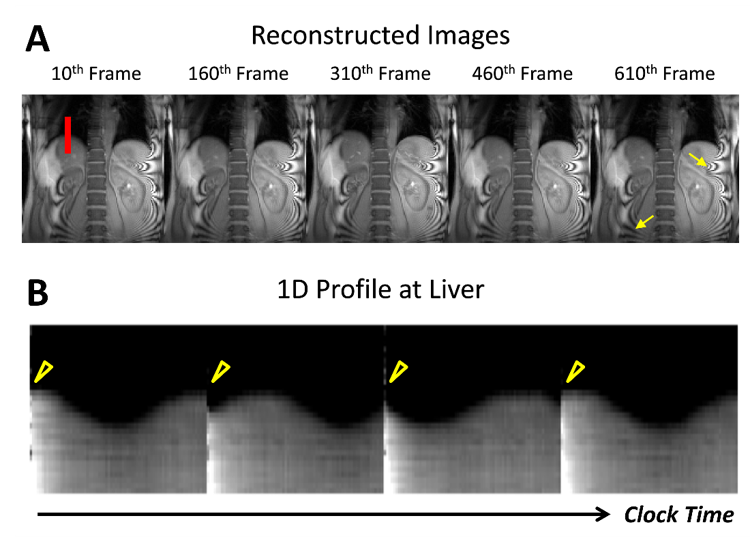
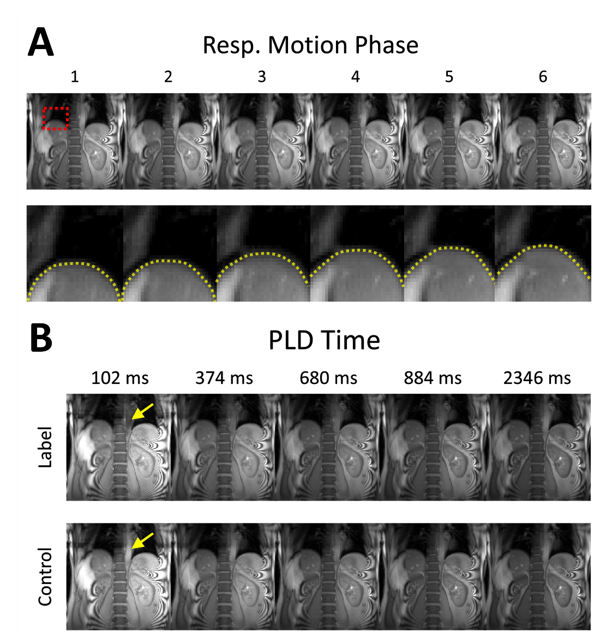
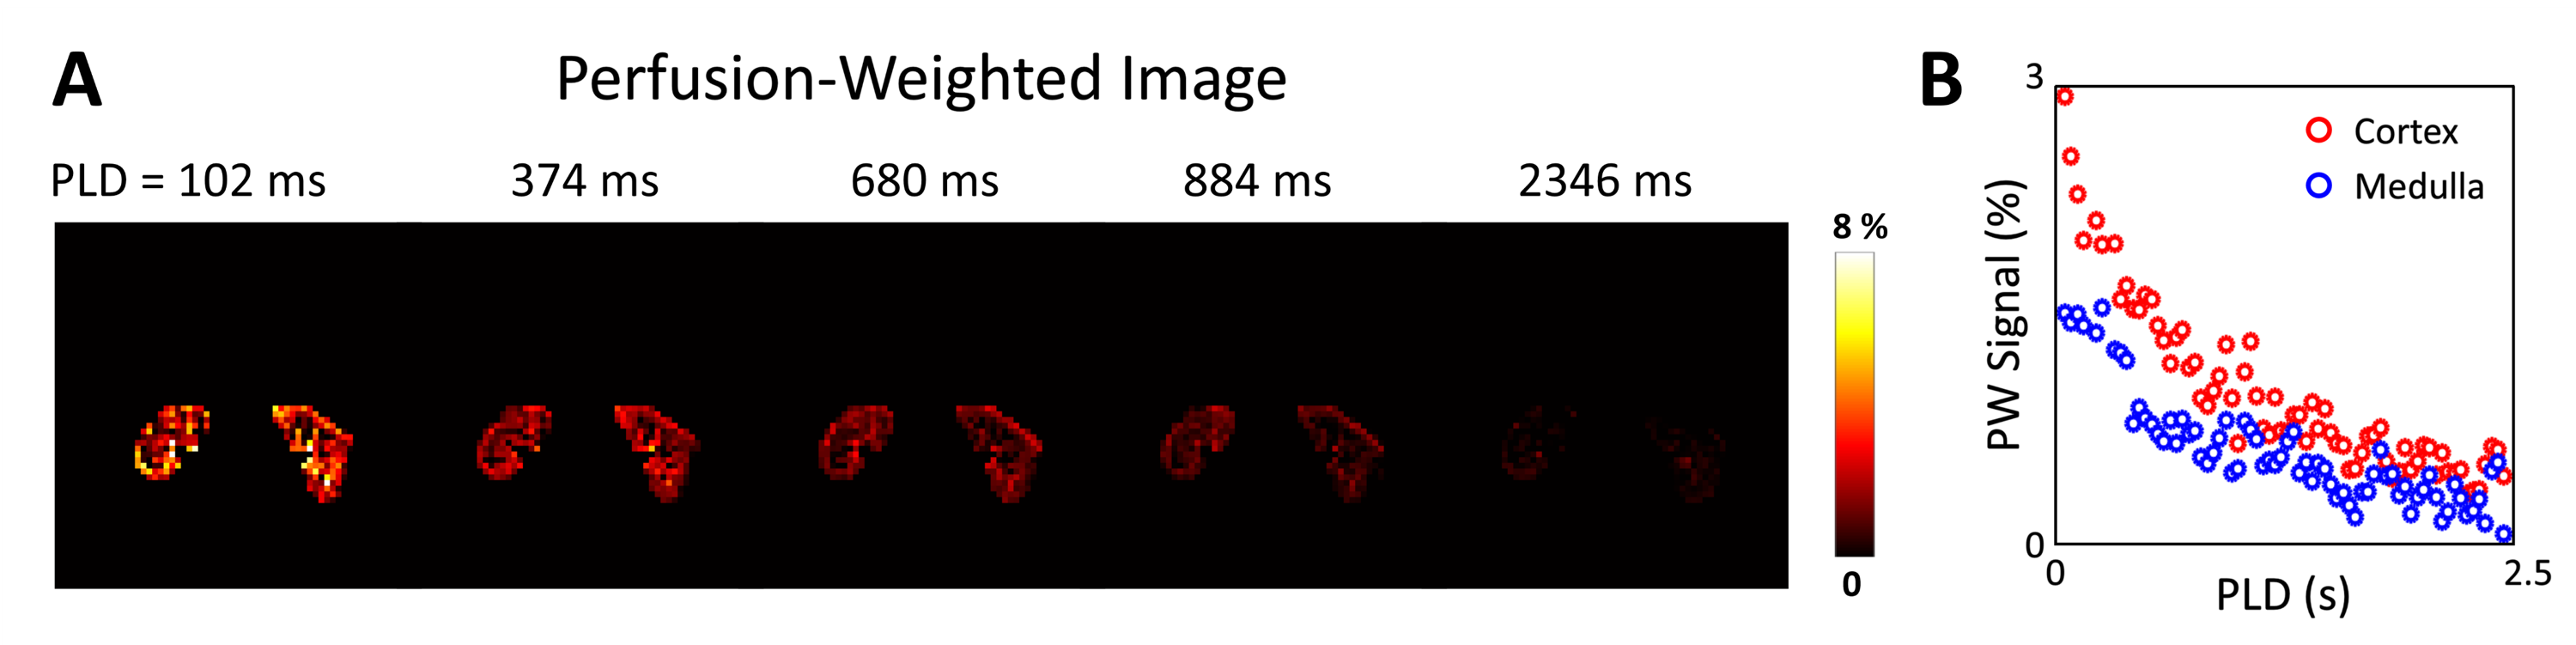
The proposed approach successfully reconstructed artifact-free dynamic images from the highly under-sampled $$$(k,t)$$$-space data (Fig.3a). The 1D profile evaluated at the center of liver (denoted by red line in Fig.3a) from the reconstructed images show changes in liver position over clock time reflecting respiratory motion (Fig.3b). Discontinuity in the liver position was observed periodically over time (yellow arrowhead in Fig.3b) due to the application of pCASL pulse with relatively long labeling duration (Fig.3b). The reconstructed images were binned to different respiratory motion phases and PLD times as shown in Fig.4. Difference in liver position (denoted by yellow dashed lines in Fig.4a) was observable in images binned at different respiratory motion bins (Fig.4a). At fixed respiratory motion phase, lower signal within the descending aorta (yellow arrow) was observed in the label images at early PLD times compared to the control images. The perfusion-weighted images were generated over multiple PLD times using the proposed method, as shown in Fig.5. The results showed expected signal decay from both the kidney cortex and medulla regions over PLD time.
Conclusion
We present a multi-delay ASL method with subspace-based fast MR for free-breathing perfusion imaging of the kidney. The feasibility of the proposed method is shown using in vivo data obtained from a healthy volunteer on a 3T MR scanner. Further investigation is necessary with increased number of subjects to validate and accurately assess the performance of the proposed method.Acknowledgements
This work was supported in part by the National Institutes of Health (P41EB022544, R01CA165221, R01HL137230, R01HL118261, T32EB013180, and K01EB030045).References
1. Nery, Fabio, Isky Gordon, and David L. Thomas. "Non-invasive renal perfusion imaging using arterial spin labeling MRI: challenges and opportunities." Diagnostics 8.1 (2018): 2.
2. Nery, Fabio, et al. "Consensus-based technical recommendations for clinical translation of renal ASL MRI." Magnetic Resonance Materials in Physics, Biology and Medicine 33.1 (2020): 141-161.
3. Shimizu, Kazuhiro, et al. "Arterial transit time-corrected renal blood flow measurement with pulsed continuous arterial spin labeling MR imaging." Magnetic Resonance in Medical Sciences (2016): mp-2015.
4. Li, Xiufeng, et al. "Quantitative single breath‐hold renal arterial spin labeling imaging at 7T." Magnetic resonance in medicine 79.2 (2018): 815-825.
5. Conlin, Christopher C., et al. "Renal plasma flow (RPF) measured with multiple-inversion-time arterial spin labeling (ASL) and tracer kinetic analysis: Validation against a dynamic contrast-enhancement method." Magnetic resonance imaging 37 (2017): 51-55.
6. Kim, Dong Won, et al. "Measurement of arterial transit time and renal blood flow using pseudocontinuous ASL MRI with multiple post‐labeling delays: Feasibility, reproducibility, and variation." Journal of Magnetic Resonance Imaging 46.3 (2017): 813-819.
7. Cutajar, Marica, et al. "Repeatability of renal arterial spin labelling MRI in healthy subjects." Magnetic Resonance Materials in Physics, Biology and Medicine 25.2 (2012): 145-153.
8. Cox, Eleanor F., et al. "Multiparametric renal magnetic resonance imaging: validation, interventions, and alterations in chronic kidney disease." Frontiers in physiology 8 (2017): 696.
9. Cutajar, Marica, et al. "Comparison of ASL and DCE MRI for the non-invasive measurement of renal blood flow: quantification and reproducibility." European radiology 24.6 (2014): 1300-1308.
10. Liang ZP. "Spatiotemporal imaging with partially separable functions." Biomedical Imaging: From Nano to Macro, 2007. ISBI 2007. 4th IEEE International Symposium on. IEEE, 2007.
11. Haldar, Justin P., and Zhi-Pei Liang. "Spatiotemporal imaging with partially separable functions: A matrix recovery approach." Biomedical Imaging: From Nano to Macro, 2010 IEEE International Symposium on. IEEE, 2010.
12. Zhao B et al. "Image reconstruction from highly undersampled-space data with joint partial separability and sparsity constraints." IEEE transactions on medical imaging 31.9 (2012): 1809-1820.
13. J. He et al. "Accelerated High-Dimensional MR Imaging With Sparse Sampling Using Low-Rank Tensors," IEEE transactions on medical imaging, vol. 35, pp. 2119-29, Sep 2016.
14. Dai, Weiying, et al. "Continuous flow-driven inversion for arterial spin labeling using pulsed radio frequency and gradient fields." Magnetic Resonance in Medicine: An Official Journal of the International Society for Magnetic Resonance in Medicine 60.6 (2008): 1488-1497.
15. Wu, Wen-Chau, et al. "A theoretical and experimental investigation of the tagging efficiency of pseudocontinuous arterial spin labeling." Magnetic Resonance in Medicine: An Official Journal of the International Society for Magnetic Resonance in Medicine 58.5 (2007): 1020-1027.
16. Alsop, David C., et al. "Recommended implementation of arterial spin-labeled perfusion MRI for clinical applications: a consensus of the ISMRM perfusion study group and the European consortium for ASL in dementia." Magnetic resonance in medicine 73.1 (2015): 102-116.
Figures