1851
High Temporal Resolution Wideband Dynamic Contrast-Enhanced Magnetic resonance imaging : The Mice Renal Function Study1Graduate Institute of Biomedical Electronics and Bioinformatics, National Taiwan University, Taipei, Taiwan, Taipei, Taiwan, 2Interdisciplinary MRI/MRS Lab, Department of Electrical Engineering, National Taiwan University, Taipei, Taiwan, Taipei, Taiwan
Synopsis
In this study, we aim to combine dynamic contrast enhanced magnetic resonance imaging (DCE-MRI) and Wideband technique and use this accelerated sequence to assess the renal function of mice. With temporal resolution improvement, we can get more information in the same scan time, helping to perform a more accurate analysis. The quantitative analysis based on the Tofts model was performed and compare the result to the conventional DCE. All in all, we validate the feasibility of high temporal resolution Wideband DCE.
Introduction
Dynamic contrast-enhanced magnetic resonance imaging (DCE MRI) is an imaging technique that assesses the tissue vasculature perfusion capability by the administration of the intravenous contrast medium and a serial of MR images.1 The dynamic change of the target can be analyzed by judging the signal enhancement of the target area or using semi-quantitative indices to characterize the perfusion curve. Furthermore, the quantitative parameters that reflected the dynamic distribution of gadolinium (Gd) contrast agents in different compartments of the tissue can be evaluated based on pharmacokinetic models. To capture minor dynamic change, temporal resolution is highly demanded. However, the DCE technique is a trade-off between three factors: spatial resolution, temporal resolution, and signal to noise ratio (SNR) but sometimes it is difficult to satisfy all of these conflicting demands. Single excitation wideband MRI (SE-WMRI), an accelerated MRI technique, is one of the solutions to achieve a high temporal resolution DCE without sacrificing the image quality or lowering the spatial resolution.2 In this study, we aim to assess the renal function of mice using SE-Wideband high temporal resolution DCE. With temporal resolution improvement, we can get more information in the same scan time, helping to perform more accurate analyses.Materials and Methods
MR experiments were performed on a Bruker (Ettlingen, Germany) 7T Biospec 70/30 scanner. The conventional gradient echo (GRE) and SE-WMRI were performed respectively on two different mice (C57BL/6, weight~25g) with 0.05mmol/kg Gadodiamide (Omniscan, GE Healthcare, USA) intravenous injection.A series of 2D conventional T1-weighted GRE and W=2, S=5 SE-WMRI scans were acquired by the following parameters: TR/TE:80ms/4.5ms, flip angle: 35 deg, matrix size: 128×128, FOV: 30×30 mm2, spatial resolution = 0.234mm/px, slice thickness: 1 mm. The temporal resolution of conventional GRE and SE-WMRI is 10.24s and 5.12s.
The serial MR images were imported to MIstar (Apollo Medical Imaging Technology) to perform the quantitative analysis and we chose the Tofts model3 as the pharmacokinetic model.
Results and Discussion
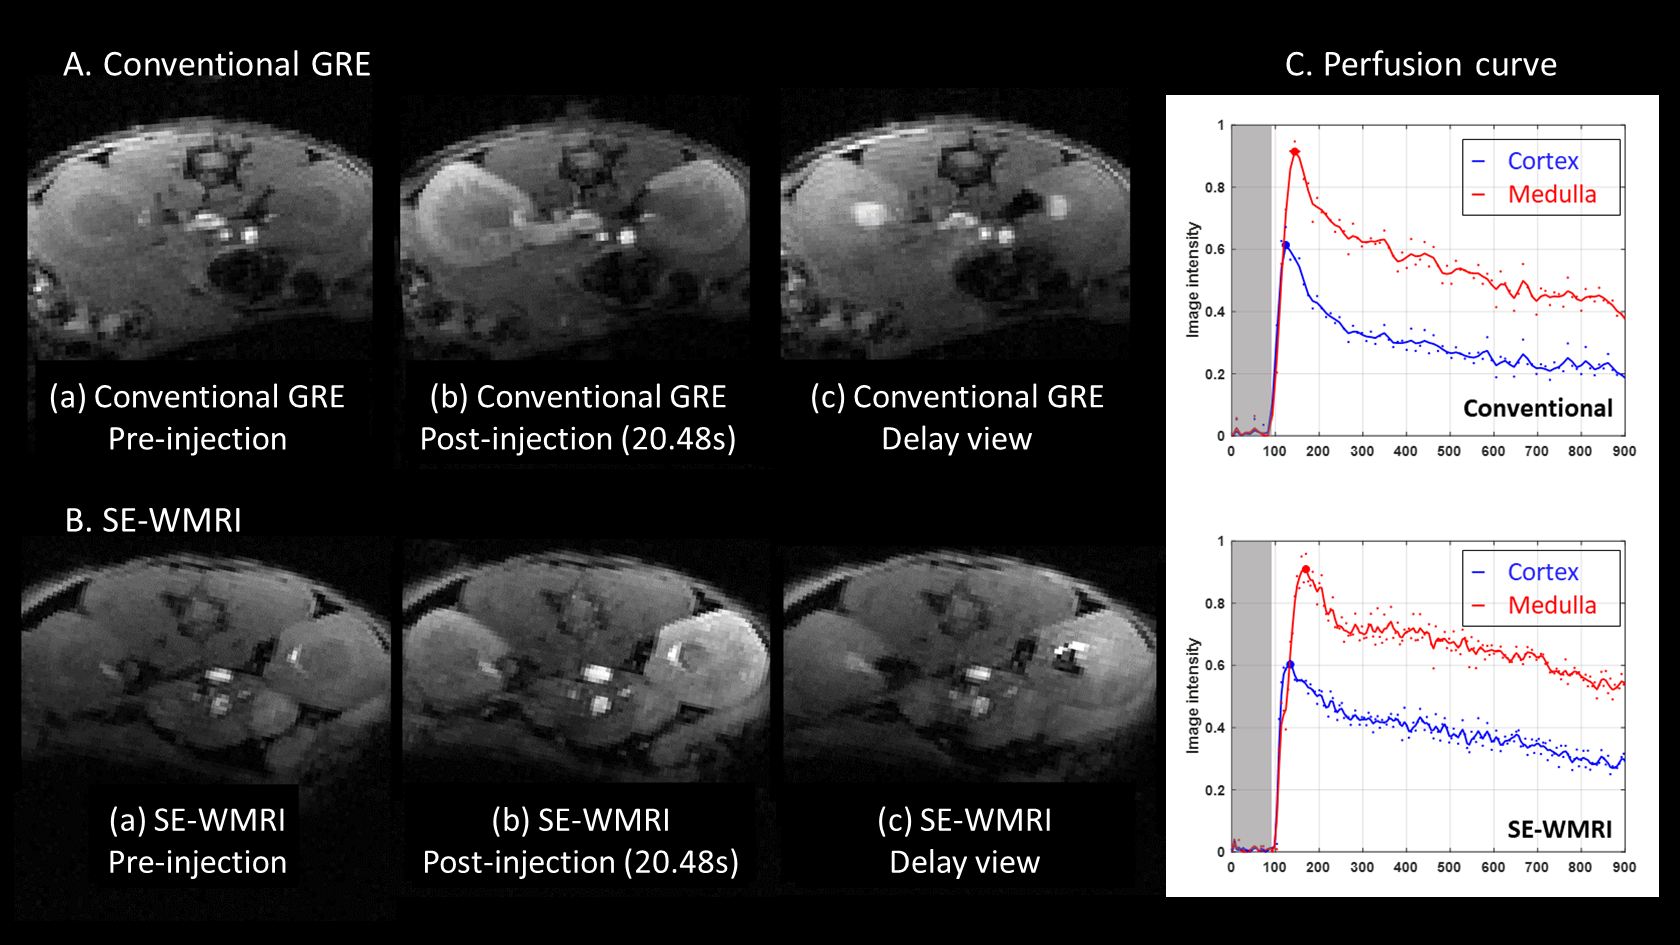
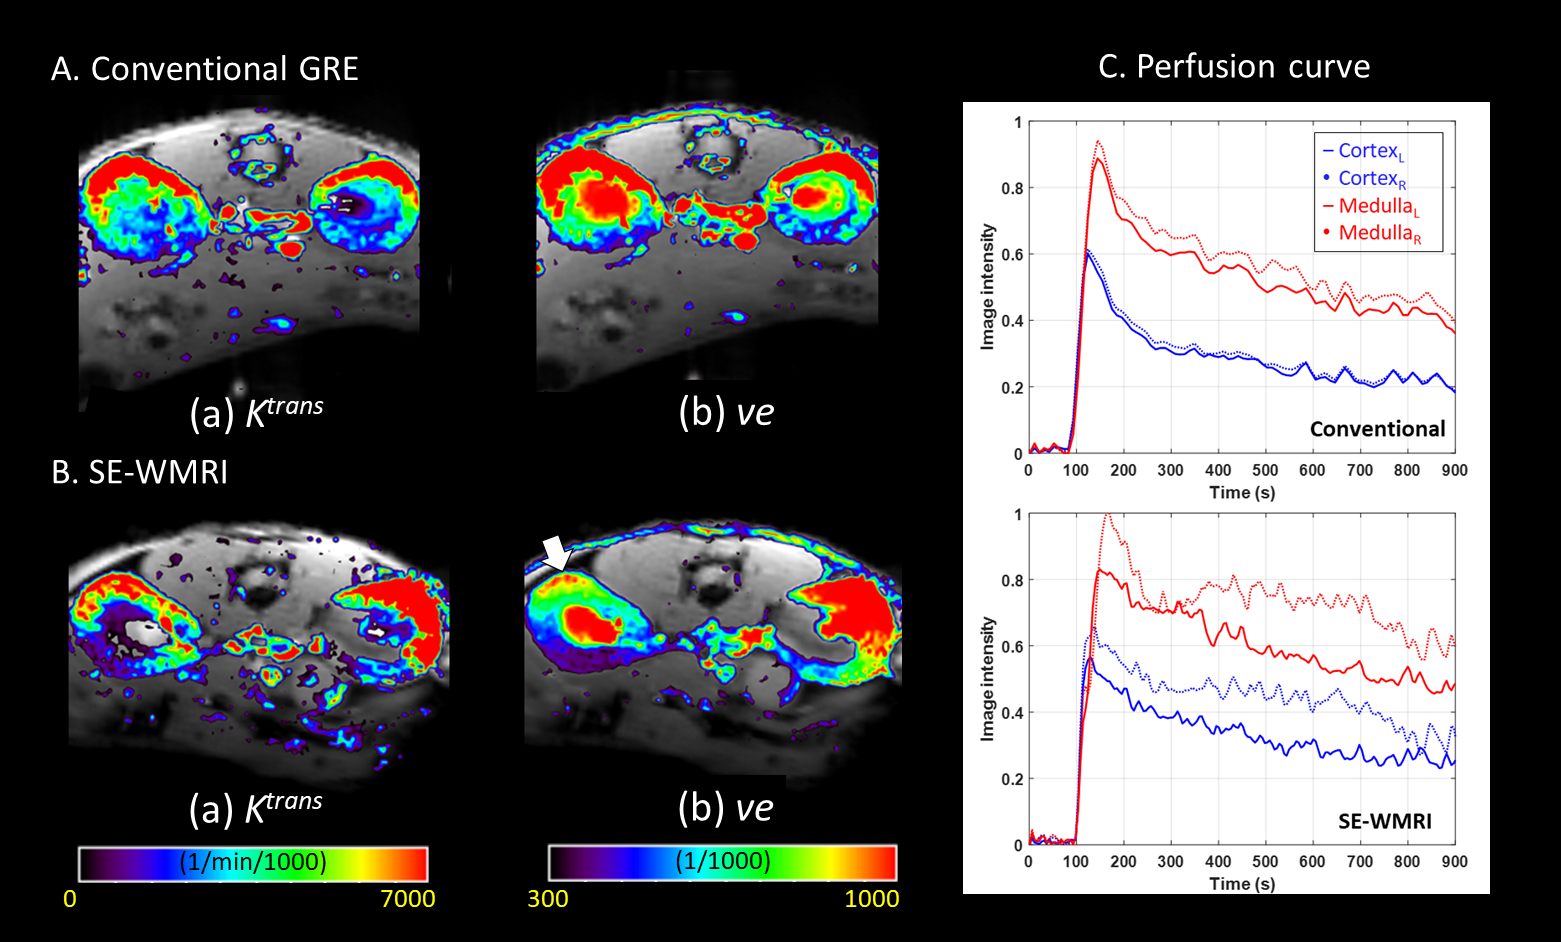
The DCE image acquired by conventional GRE and SE-WMRI are demonstrated in Figure1 and figure (a)(b)(c) present the image of three-stage, pre-injection, post-injection (20.48s), and delay view. By measuring the signal in the cortex and medulla region of the series MR images, we get perfusion curves in Figure1C and both curves show similar kinetic characteristics. Once inject Gd contrast agent, the image intensity of the kidneys elevate rapidly then the contrast agent is washed out by the kidneys making the image intensity start to decrease. There is around a 25-second time delay of intensity peaks between the cortex and the medulla because the contrast agent arrives at renal vasculature in the cortex region first then enters to renal tubules in the medulla region.4The results of the quantitative analysis present in Figure2. In Ktrans maps, we observe that the cortex region has higher Ktrans values because permeability in the cortex is better than the medulla.5 The mean Ktrans value of the cortex region are 5544 and 5760 (1/min/1000) in conventional GRE and SE-WMRI. In ve maps, the medulla area has high ve and the values are around 900 (1/1000) in both methods (Conventional GRE: 929, SE-WMRI:898). In general, the quantitative parameters processed from conventional GRE and SE-WMRI are comparable. However, there is a slight difference in the left side cortex (white arrow) that may be caused by the physiological difference between the two mice. The SE-WMRI perfusion curves in Figure2C are less consistent that means the two kidneys had different physiological status. Hence, we will increase the experiment number to eliminate the unwanted physiological effect.
Conclusion
In this study, we achieved a high temporal resolution DCE MRI using the SE-Wideband technique and observed the same kinetic characteristics. Additionally, the quantitative analysis also had similar patterns. To sum up, the feasibility of combing SE-WMRI with DCE MRI was preliminarily validated and showed the potential to utilize in various applications where high-speed observation is needed. Besides improving the temporal resolution, the time saving by SE-Wideband may be used to increase spatial resolution or elevate SNR, which makes the DCE experiment design more flexible. Currently, it is just a preliminary study so we only have two cases. We will increase the case number to validate the stability and implement different applications of SE-WMRI.Acknowledgements
This study was supported by the Ministry of Science and Technology (MOST 109-2314-B-002-270-).References
1. Padhani AR. Dynamic contrast-enhanced MRI in clinical oncology: current status and future directions. J Magn Reson Imaging. 2002
2. Wu EL, Huang YA, Chiueh TD, Chen JH. Single-frequency excitation wideband MRI (SE-WMRI). Med Phys. 2015
3. Tofts PS, Brix G, Buckley DL, et al. Estimating kinetic parameters from dynamic contrast-enhanced T(1)-weighted MRI of a diffusable tracer: standardized quantities and symbols. J Magn Reson Imaging. 1999
4. Bokacheva L, Rusinek H, Zhang JL, Lee VS. Assessment of renal function with dynamic contrast-enhanced MR imaging. Magn Reson Imaging Clin N Am. 2008
5. Cutajar M, Thomas DL, Hales PW, Banks T, Clark CA, Gordon I. Comparison of ASL and DCE MRI for the non-invasive measurement of renal blood flow: quantification and reproducibility. Eur Radiol. 2014
Figures