1850
Blood flow measurements in diabetic kidney disease: A comparison of phase contrast, arterial spin labelling and dynamic contrast enhanced MRI1Department of Biomedical Imaging Sciences, University of Leeds, Leeds, United Kingdom, 2Leeds Teaching Hospitals, NHS Trust, Leeds, United Kingdom, 3Siemens Healthcare GmbH, Erlangen, Germany, 4Department of Imaging, Infection, Immunity and Cardiovascular Disease, The University of Sheffield, Sheffield, United Kingdom
Synopsis
Kidney perfusion can be measured using DCE or ASL, but clinical confidence in the assays is undermined by the large variability in published values. In this study, an intra-subject comparison was performed of DCE and ASL against phase-contrast RBF in 25 patients with diabetic kidney disease. Results show that the three techniques agree well on average, but pairwise agreement on the single-subject level remains poor. ASL agreed better with PC than DCE, but the difference was driven by a single DCE outlier. While RBF is a useful biomarker for studies at population level, individual patient management will require further optimization.
Introduction
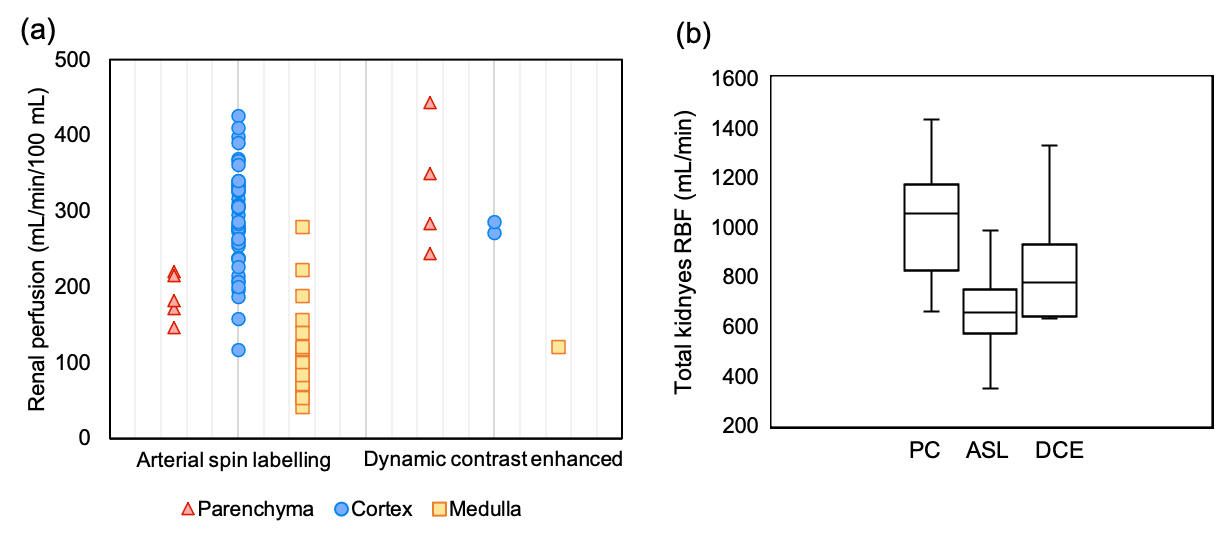
Renal perfusion (RP, mL/min/100mL) is a valuable biomarker that can be measured with DCE or ASL. However, clinical confidence in MRI assays is undermined by the large variability in published values (Figure1a). Unfortunately, the accuracy of RP assays is difficult to determine because preclinical results may not translate, and clinical reference methods have not been sufficiently validated in the kidneys.1An alternative approach is to perform an “internal” validation. Since DCE and ASL rely on different physical principles, a strong agreement between the two would offer confidence that they are both valid. Unfortunately, previous studies have shown that internal validation is inconclusive: while DCE and ASL agree well on average, the agreement on the single-subject level is poor.2 Technical validation studies therefore tend to focus on repeatability and reproducibility.3 However, this does not test for bias and –when used in isolation– risks promoting methods that are less sensitive to change.4
A potential solution is to involve phase contrast (PC) measurement of renal blood flow (RBF, mL/min) as an arbitrating method.5 While RBF and RP are different physical quantities, for a well-defined perfusion measurement the integration of perfusion values across the organ should equal to the total blood flow. Hence our aim was to compare ASL and DCE in terms of their agreement with PC. Intra-subject comparisons were performed in a single-centre cohort of 25 patients with diabetic kidney disease.6
Methods
RBF in this report refers to the total blood flow to both kidneys. For reference, literature RBF in healthy volunteers for PC, ASL and DCE were compared (t-test). For literature data, ASL-RBF and DCE-RBF were derived using average volumes for cortex, medulla or parenchyma depending on the RP reported.7Experiment-design: Twenty-five iBEAt participants6 (type-2 diabetes, eGFR>30 ml/min/1.73m2) were scanned using 3T MRI (MAGNETOM Prisma, Siemens Healthcare GmbH, Erlangen, Germany) between 8-11am after>8 hour fast and a standard breakfast. The acquisition involved 2D-cine PC, 3D-ASL (pCASL, WIP sequence) and 2D-DCE as detailed in the iBEAt protocol.6
Post-processing: PC was analysed in Syngo.via (Siemens Healthcare GmbH, Erlangen, Germany), using elliptical ROIs to segment the renal artery. ASL and DCE were analysed in PMI 0.4.8 Renal parenchyma ROIs were selected semi-automatically on DCE and ASL parametric maps. For DCE, the whole parenchyma curve was fitted using a non-linear signal model with literature-based T1 and a 2-compartment-filtration model.
Reporting: PC-RBF was derived by multiplying average velocity with average vessel cross-section; ASL-RBF by adding RP over the ROI and multiplying with voxel-volume; DCE-RBF by multiplying RP with ROI volume. RBF was normalised to body-surface-area using DuBois formula. Split-RBF was derived as (right kidney RBF)/RBF.
Statistics: Repeated measures one-way ANOVA and paired t-tests were used to determine the significance of the differences between mean RBF (and split-RBF) derived from PC/DCE/ASL. The RBF difference between ASL/PC and DCE/PC was determined for each subject and a two-sample F-test for equal variances was performed to determine whether one of the two methods (ASL or DCE) agreed better with PC.
Results
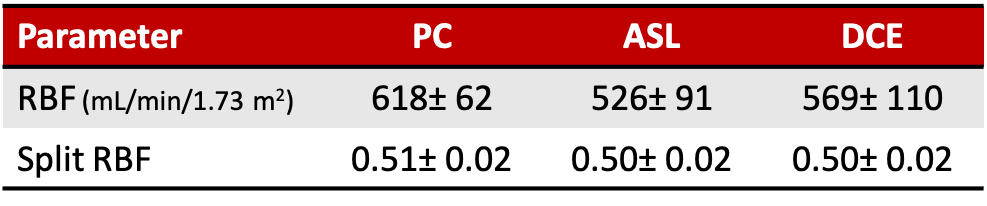
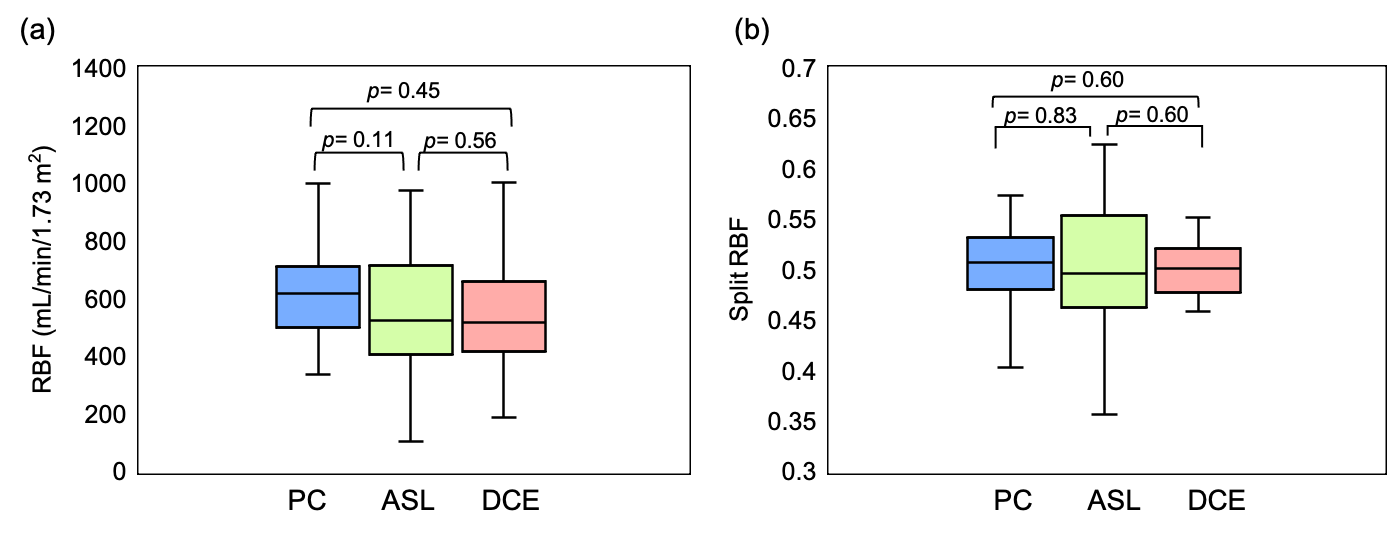
Figure1 compares literature RBF data from healthy volunteers, showing large range of values for each method and a systematic difference between ASL and PC (p<0.001).Table1 and Figure2 show RBF and split-RBF values derived in this study. The difference in the means is not significant for RBF (F(1, 32)=1.26, p=0.28) or split-RBF (F(2, 36)=0.14, p=0.87).
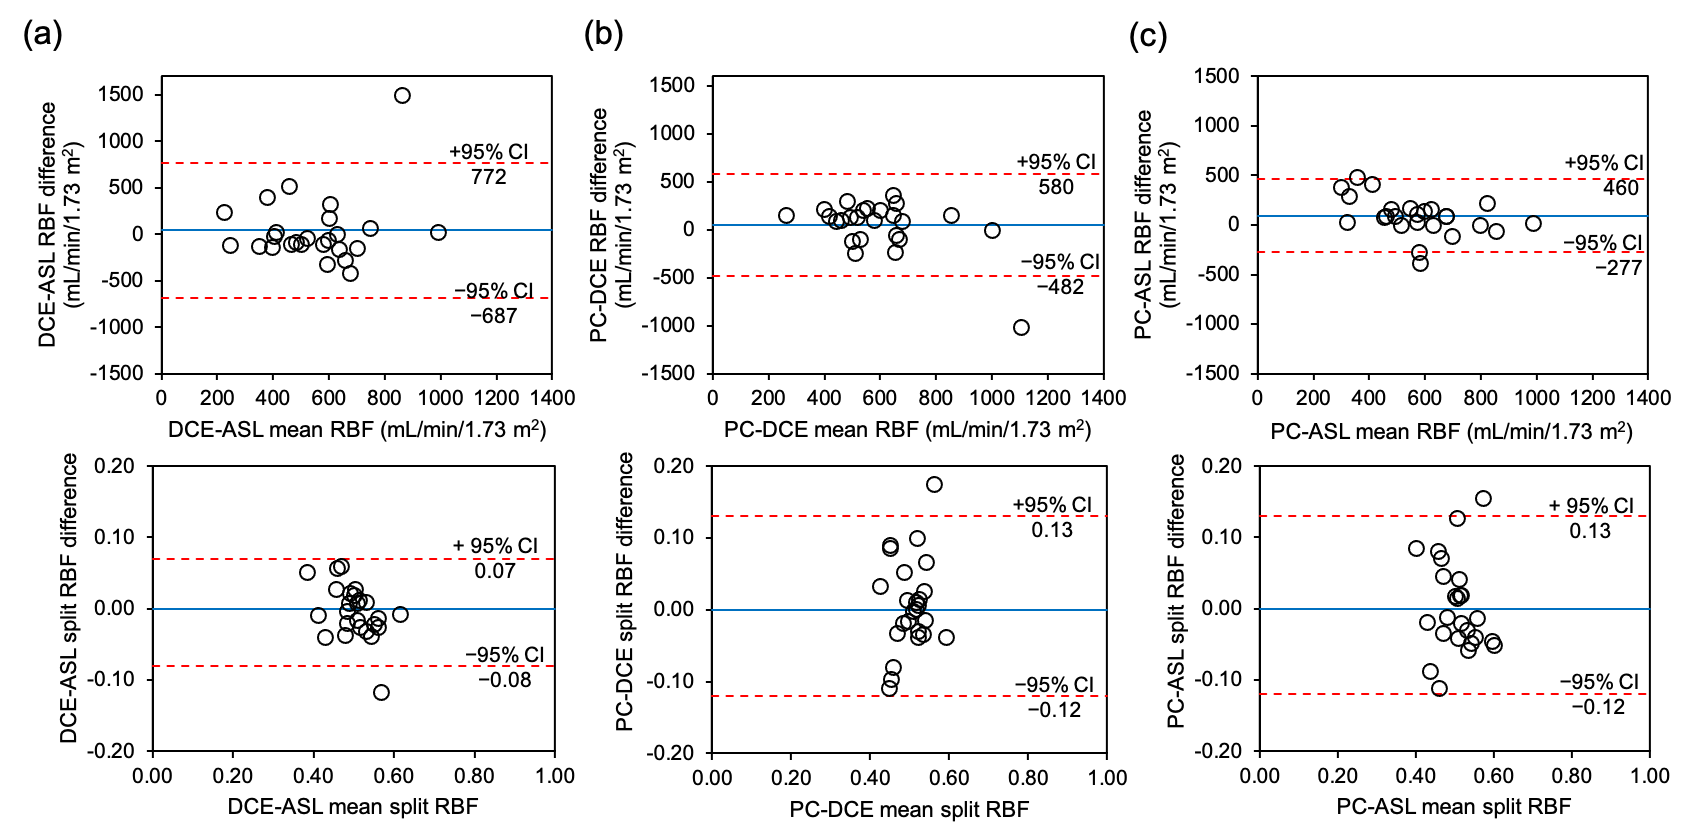
Pairwise comparisons of our data (Figure3) show poor intra-subject agreement between RBF of different methods. The half-width of the 95%CI for the difference is on the same order as the mean values: 729 ml/min/1.73m2 for DCE-ASL, 531 ml/min/1.73m2 for PC-DCE, 368 ml/min/1.73m2 for PC-ASL. ASL is closer to PC than DCE but the difference is marginally significant (p=0.049). After removing an extreme outlier (#23) the difference between DCE and ASL is no longer significant (p=0.315): 313 ml/min/1.73m2 for PC-DCE, 347 ml/min/1.73m2 for PC-ASL.
The agreement between methods in split-RBF is much better, with limits-of-agreement of the order [–0.1, 0.1] for each pairwise comparison, substantially smaller than the mean values (Table1).
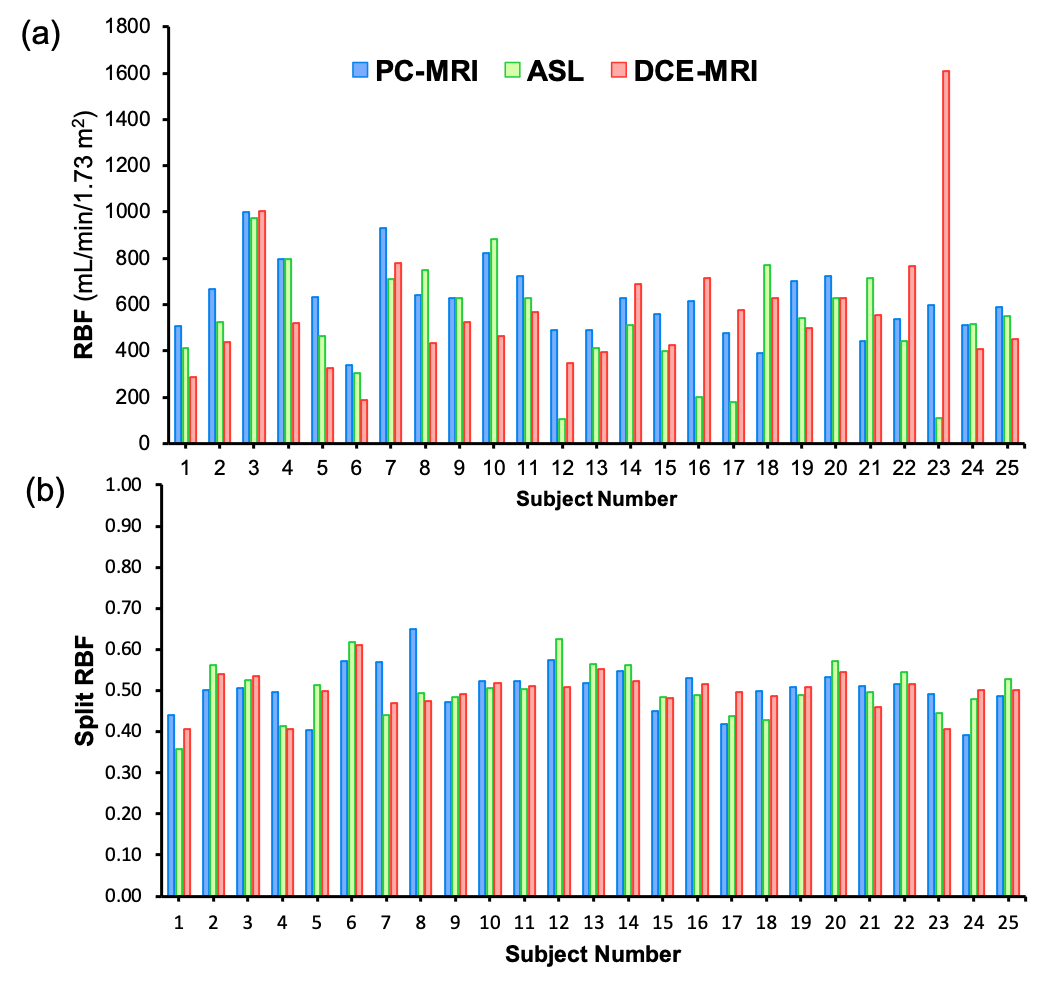
Visual comparison of results in all subjects (Figure4) indicates four comparatively low ASL-RBF values (#12, 16, 17, 23), and one extreme DCE-RBF (#23).
Discussion and conclusion
A strong agreement in RBF between at least two of the methods was not observed, which means the technical validity of MRI-based RP measurements remains to be demonstrated. On the single-subject level ASL is closer to PC than DCE, but the difference is fully driven by a single outlier. The agreement in split-RBF is much stronger than in RBF, suggesting subject-specific scaling errors that affect both kidneys in a similar way play a significant role in at least two of the three methods.An inspection of the outliers indicates some possible mechanisms. Outliers with low ASL-RBF showed global signal drop-out on the images, potentially due to B0 inhomogeneity causing a low pCASL labelling efficiency. The overestimated DCE-RBF in one case resulted from inflow artifacts in the measured input-function. Both types of error can in principle be addressed with suitable optimization of the acquisition, or outlier rejection. In addition, a possible approach to improve MRI-derived perfusion measurements is to combine all 3 methods, either by reporting the median value or performing a joint optimization.
Acknowledgements
iBEAt study is part of the BEAt-DKD project. The BEAt-DKD project has received funding from the Innovative Medicines Initiative 2 Joint Undertaking under grant agreement No 115974. This Joint Undertaking receives support from the European Union’s Horizon 2020 research and innovation programme and EFPIA with JDRF. For a full list of BEAt-DKD partners, see www.beat-dkd.eu.
B. Alhummiany is supported by a government scholarship from Saudi Arabia.
References
- Kudomi N, Koivuviita N, Liukko KE, et al. Parametric renal blood flow imaging using [15O]H2O and PET. Nucl. Med. Mol. Imaging. 2009; 36(4): 683–691.
- Cutajar M, Thomas DL, Hales PW, et al. Comparison of ASL and DCE MRI for the non-invasive measurement of renal blood flow: quantification and reproducibility. Eur Radiol. 2014; 24(6), 1300–1308.
- Selby N, Blankestijn P, Boor P, et al. Magnetic resonance imaging biomarkers for chronic kidney disease: a position paper from the European Cooperation in Science and Technology Action PARENCHIMA. Nephrol. Dial. Transplant. 2018; 33(2): ii4–ii14.
- Hockings P, Saeed N, Simms R et al. MRI Biomarkers. In: Seiberlich N, Gulani V, Campbell-Washburn A et al., Quantitative Magnetic Resonance Imaging. 1st ed. Elsevier Academic Press; 2020.
- Eckerbom P, Hansell P, Cox E, et al. Multiparametric assessment of renal physiology in healthy volunteers using noninvasive magnetic resonance imaging. Am J Physiol Renal Physiol. 2019; 316(4): F693-F702.
- Gooding KM, Lienczewski C, Papale M, et al. Prognostic imaging biomarkers for diabetic kidney disease (iBEAt): study protocol. BMC Nephrol. 2020; 21(1): 242.
- Wang X, Vrtiska T, Avula R, et al. Age, kidney function, and risk factors associate differently with cortical and medullary volumes of the kidney. Kidney Int. 2014; 85(3): 677–685.
- Sourbron S, Biffar A, Ingrisch M, et al. PMI: platform for research in medical imaging. Magn Reson Mater Phy. 2009; 22 (suppl 1).
Figures