1846
Cross-Vendor Test-Retest Analysis of 3D pCASL Cerebral Blood Flow1Laboratory of Functional MRI Technology (LOFT), USC Stevens Neuroimaging and Informatics Institute, Keck School of Medicine, University of Southern California (USC), Los Angeles, CA, United States, 2Siemens Medical Solutions USA, Inc., Los Angeles, CA, United States, 3Department of Radiology, Massachusetts General Hospital and Athinoula A Martinos Center for Biomedical Imaging, Harvard Medical School, Charlestown, MA, United States, 4Department of Neurology, Massachusetts General Hospital and Athinoula A Martinos Center for Biomedical Imaging, Harvard Medical School, Charlestown, MA, United States, 5The Russell H. Morgan Department of Radiology & Radiological Science, Johns Hopkins University School of Medicine, Baltimore, MD, United States
Synopsis
Standardized acquisition protocols have been recommended for Arterial Spin Labeling perfusion MRI across major MRI platforms. However, there are still vendor and sequence specific differences for ASL implementations that limit the use of ASL for clinical trials. Here we evaluated the repeatability of CBF measurements across 4 different MR platforms on a traveling cohort of 10 volunteers using standardized 3D background suppressed pCASL sequences. We show that while there are differences in global CBF values, relative CBF values are reproducible in major vascular territories across the 4 MRI platforms.
Background
Arterial Spin Labeling (ASL) provides noninvasive quantitative cerebral blood flow (CBF) measurement with good test-retest repeatability and has been validated by PET [1]. ASL acquisition can be standardized across major MRI platforms with 3D pseudo-continuous ASL (pCASL) [2], which has been used in multi-site clinical studies and trials. However, there are still vendor and sequence specific differences for ASL implementations, and the repeatability across vendors is not well studied [3]. Here we compared CBF measurements using standardized 3D pCASL protocols from 4 different MR platforms for within and between vendor repeatability. Furthermore, since there might be differences in absolute CBF due to scanner hardware and ASL implementation, we also compared relative CBF normalized to global mean CBF of the gray matter.Methods
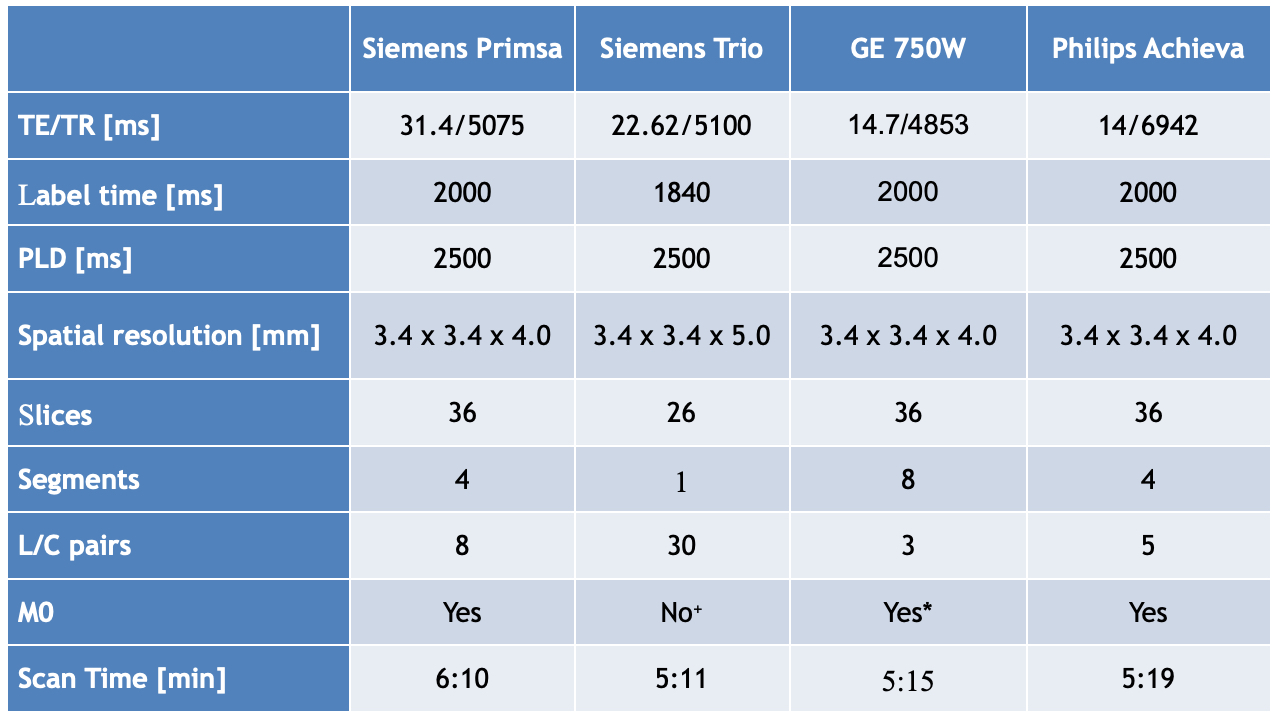
As part of the MarkVCID study (https://markvcid.partners.org/), 10 subjects (age 63.4±9.9years, 6F/4M) underwent repeated scans on 4 different 3T MRI systems: GE Discovery 750W, Philips Achieva, Siemens Magnetom Trio and Siemens Magnetom Prisma. The 10 subjects also underwent 2 repeated scans on Siemens Trio and Prisma scanners ~8months apart. MRI protocols were harmonized as much as possible across platforms as listed in Table1. For GE no raw data was available while for Siemens Trio no M0 calibration images was acquired. Hence for GE we used the vendor created CBF maps while for Siemens Trio we estimated a M0 value based on parameters of inversion pulses for background suppression. For Philips and Siemens Prisma we used the separate M0 images for voxel-wise calibration. For each scan session a separate T1 weighted anatomical image was also acquired. Data analysis was performed using in-house ASL post-processing pipeline implemented using custom Matlab programs that utilize several routines of SPM12. Motion correction was run separately for control and labeled images followed by brain extraction. Perfusion images were generated by pairwise subtraction of label and control images. A principal component analysis (PCA) based denoising algorithm was used to reduce the effect of head motion and physiological noise [4]. Quantitative CBF maps were generated according to the perfusion model recommended by the ASL white paper [2] and spatially smoothed with a 6mm FWHM Gaussian kernel. Calculated CBF maps were coregisterd to individual T1w images and normalized to MNI template space. Mean CBF values for the 4 vascular territories [5] on both hemispheres as well as the gray matter (GM) were extracted. The 4 vascular territories included middle cerebral artery (MCA), anterior cerebral artery (ACA), posterior cerebral artery (PCA) and MCA perforator (MCAperf). Relative CBF values of the 4 vascular territories were calculated as the ratio of regional CBF vs. GM-CBF, to account for potential cross-site variations (e.g. labeling efficiency) that affect global CBF. Interclass Correlation Coefficients (ICC) were calculated between the 4 sites and within the Siemens sites. ICC was calculated for absolute agreement of values (A-K criterion) as well as for agreement with bias across sites (C-k criterion). We hypothesize that there will be significant differences in mean absolute CBF measurements across the 4 sites given the differences in pulse sequences and imaging protocols as well as M0-calibration. Repeated measures ANOVA was performed to compare mean relative CBF measurements across the 4 sites, and the within-subject coefficient of variation (wsCV) of the relative CBF values across sites was computed.Results
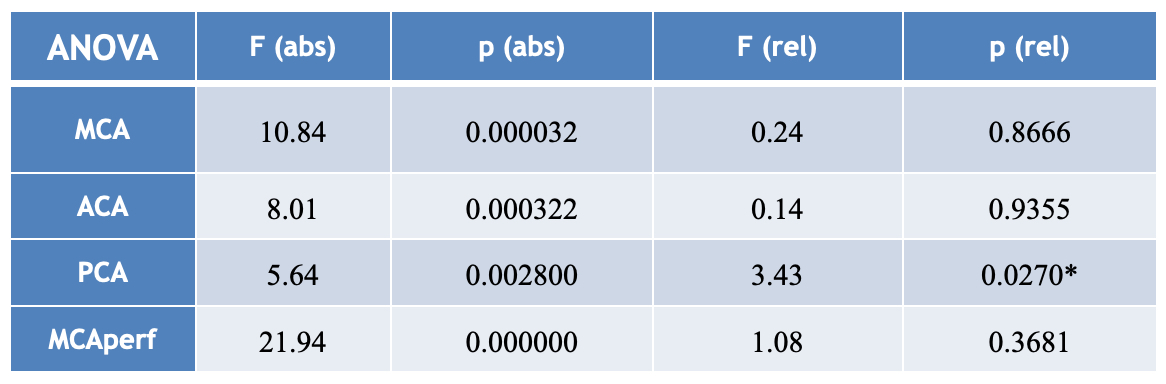
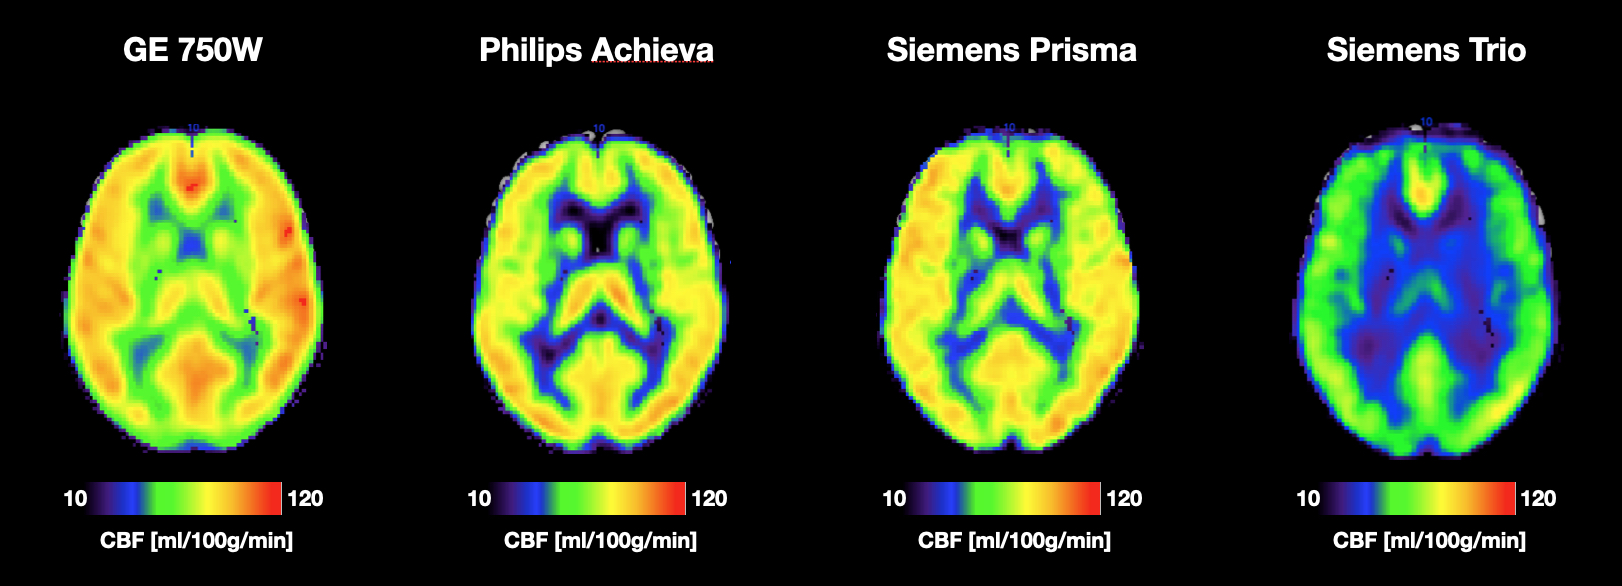
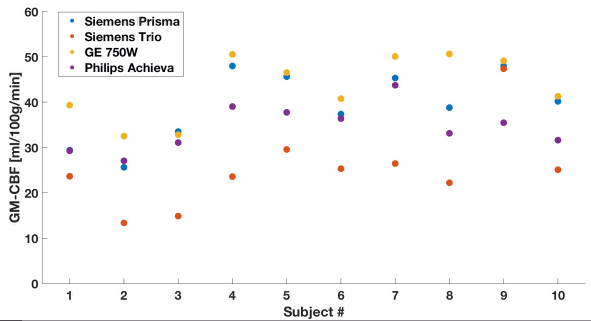
Averaged CBF maps acquired on the 4 MR platforms show qualitatively similar pattern of GM and WM contrast (Figure1). However, there are considerable variations or biases in absolute CBF values across the 4 different MR platforms (Figure2). The ICC for absolute GM-CBF between sites was 0.64 (p<0.0001) (A-k model). However, when accounting for bias in global GM-CBF, the ICC (C-k model) for GM-CBF was 0.88 (p<0.0001). For Siemens sites the within-site test-retest ICC was 0.91 (p=0.0006) for Prisma whereas Trio showed poor repeatability with ICC of 0.17 (p=0.394). ANOVA results for absolute CBF in the 4 vascular territories showed significant differences between scanner platforms which could be ameliorated by accounting for GM-CBF i.e. relative CBF (Table2). For relative CBF of the 4 vascular territories, only PCA showed a significant scanner effect and post-hoc test revealed significantly lower PCA-CBF in GE 750W compared to Siemens Trio and Philips Achieva. ICC (C-k) for regional CBF aligned with the ANOVA results with ICC for MCA=0.96, ACA=0.74, PCA=0.90 and MCAperf=0.88. Average wsCV of relative CBF in the 4 vascular territories was MCA=5.1%, ACA=7.9%, PCA=9.6% and MCAperf=9.4%.Discussion and Conclusion
This is the first study that systematically evaluated repeatability of standardized 3D pCASL scans across all major MRI platforms. Our results show that there are platform dependent biases in quantified global GM-CBF. Nevertheless, when accounting for such bias by using relative CBF normalized for global GM-CBF, regional CBF in four major vascular territories show good to excellent agreement across the 4 MRI platforms. Furthermore, repeated scans on a Siemens Prisma showed excellent test-retest repeatability, while repeatability was poor on Siemens Trio which lacked M0 scan. This highlights the importance of appropriate M0 calibration for reliable CBF quantification. Overall the data are encouraging and suggest that multi-center ASL perfusion studies are feasible with standardized acquisition protocols and analysis procedures that account for difference in global CBF caused by hardware and sequence differences across MRI platforms.Acknowledgements
Funding for Mark VCID UH2/3 (https://markvcid.partners.org/) from NIH grants: U24 NS100591 and NS100588References
1. Kilroy E, Apostolova L, Liu C, Yan L, Ringman J, Wang DJ. Reliability of two-dimensional and three-dimensional pseudo-continuous arterial spin labeling perfusion MRI in elderly populations: comparison with 15O-water positron emission tomography. Journal of magnetic resonance imaging : JMRI 2014;39:931-939.
2. Alsop DC, Detre JA, Golay X, et al. Recommended implementation of arterial spin-labeled perfusion MRI for clinical applications: A consensus of the ISMRM perfusion study group and the European consortium for ASL in dementia. Magnetic resonance in medicine : official journal of the Society of Magnetic Resonance in Medicine / Society of Magnetic Resonance in Medicine 2015;73:102-116.
3. Mutsaerts HJMM, van Osch MJP, Zelaya FO, et al. Multi-vendor reliability of arterial spin labeling perfusion MRI using a near-identical sequence: Implications for multi-center studies. Neuroimage 2015;113:143-152.
4. Shao X, Tisdall MD, Wang DJ, van der Kouwe AJ. Prospective motion correction for 3D GRASE pCASL with volumetric navigators. International Society for Magnetic Resonance in Medicine2017: 0680.
5. Tatu L, Moulin T, Bogousslavsky J, Duvernoy H. Arterial territories of the human brain: cerebral hemispheres. Neurology 1998;50:1699-1708.
Figures