1843
Metabolic Effects of Deferiprone on Triple Negative Breast Cancer1Medical Physics, Memorial Sloan Kettering Cancer Centre, New York, NY, United States, 2Department of Medicine, Memorial Sloan Kettering Cancer Center, New York, NY, United States, 3Molecular Pharmacology Program, Memorial Sloan Kettering Cancer Center, New York, NY, United States, 4Weill Cornell Medical College, Cornell University, New York, NY, United States
Synopsis
Triple-negative breast cancer (TNBC) metastasizes and is currently associated with poor prognosis and lack of effective targeted therapies. We are studying the potential of Deferiprone, an intracellular iron chelator clinically used for non-cancer-related diseases, to improve the chemotherapeutic treatment response in TNBC by altering cellular iron-dependent proliferation and metabolism. Here, cellular and energy metabolism changes in response to Deferiprone were assayed in live TNBC cells by multi-nuclear MRS in our MR-compatible bioreactor. Metabolic changes in a human TNBC cell line are compared to previous findings in murine TNBC cells.
Introduction
Triple-negative breast cancer (TNBC) metastasizes, is associated with poor prognosis and lacks effective targeted therapies.Supported by previous data showing the cytostatic and metabolic effects of Deferiprone (DFP) in multiple cancer cell lines1,3 we expanded our preliminary TNBC studies investigating the metabolic effects of DFP in the TNBC cell line 4T11 to include the human TNBC cell line MDA-MB-231. Here, we monitored and quantified the metabolic effects of DFP in live MDA-MB-231 cells in our MR-compatible bioreactor by multi-nuclear MRS.
Methods
Human MDA-MB-231 and murine 4T1 TNBC cells were grown in Dulbecco’s Modified Essential (DME) medium, containing 25 mM glucose (Glc), 6 mM glutamine (Gln), 10% fetal bovine serum and 1% penicillin/streptomycin, and cultured in humidified 5% CO2 / 95% air at 37 ⁰C.For the MR-cell bioreactor studies, 6×10⁶ MDA-MB-231 cells or 3×10⁶ 4T1 cells respectively were seeded per 0.5 ml microcarrier beads (total 3.5 ml; 125-212 μm diameter; PP3772, Corning, New York, NY) until reaching ~70% confluence. Cell number and viability were estimated from a representative sample at the start (#cellsinit) and end (#cellsend) of each MR experiment by Trypan Blue exclusion assay.
Continually perfused, live cells were studied in an MR-compatible cell bioreactor1,2,3 on a 500 MHz AVANCE III Bruker scanner equipped with a 10-mm broad-band probe (Bruker BioSpin, Billerica, MA) for 1H and 31P/13C MRS. To monitor metabolism changes, cells were continuously perfused for 31 hours with complete DME media. After the setup and the first 31P MR spectrum, the un-labelled perfusion medium was replaced with medium containing 25 mM 1-13C-labeled glucose for the remaining 30 h of experiment.
During each experiment, 1H-decoupled, Nuclear Overhauser Effect-enhanced 13C MR spectra (1200 s relaxation time (TR), 45 flip angle, 30 kHz sweep width (SW), 8k points, 1000 averages, 20 min acquisition time) were acquired repeatedly interspaced with two consecutive 31P spectra (1200 s TR, 45 degree flip angle, 20 kHz SW, 2k points, 1800 averages, 30 min acquisition time) every six hours.
Three independent experiments each, were performed in untreated medium (CTRL) and three in medium containing 100 µM DFP (DFP-treated).
Quantification of MR spectral peaks was performed using AMARES (jMRUI v5.2). Metabolites were normalized to the β-NTP signal of the first 31P MR spectrum (β-NTPinit).
A 2-tailed, unpaired Student’s T test was used to compare DFP-treated and untreated (CTRL) MDA-MB-231 cell data. Metabolic 13C-labeling rates for DFP-treated and untreated MDA-MB-231 cells were compared to corresponding rates in previously studied1 murine 4T1 cells for various glucose-driven metabolites.
Results & Discussion
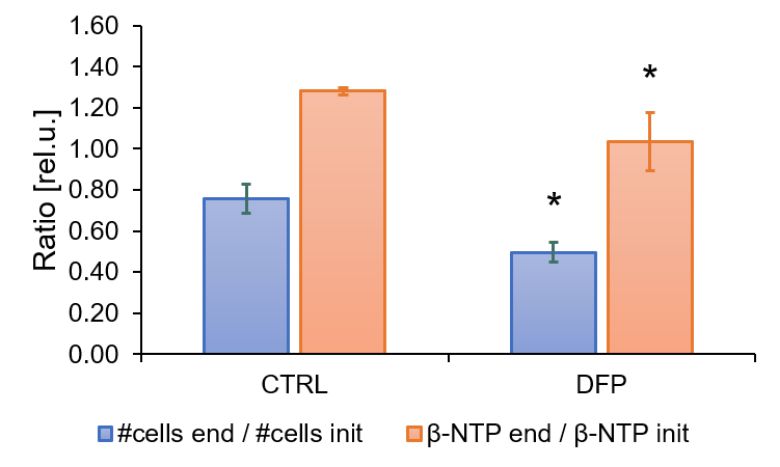
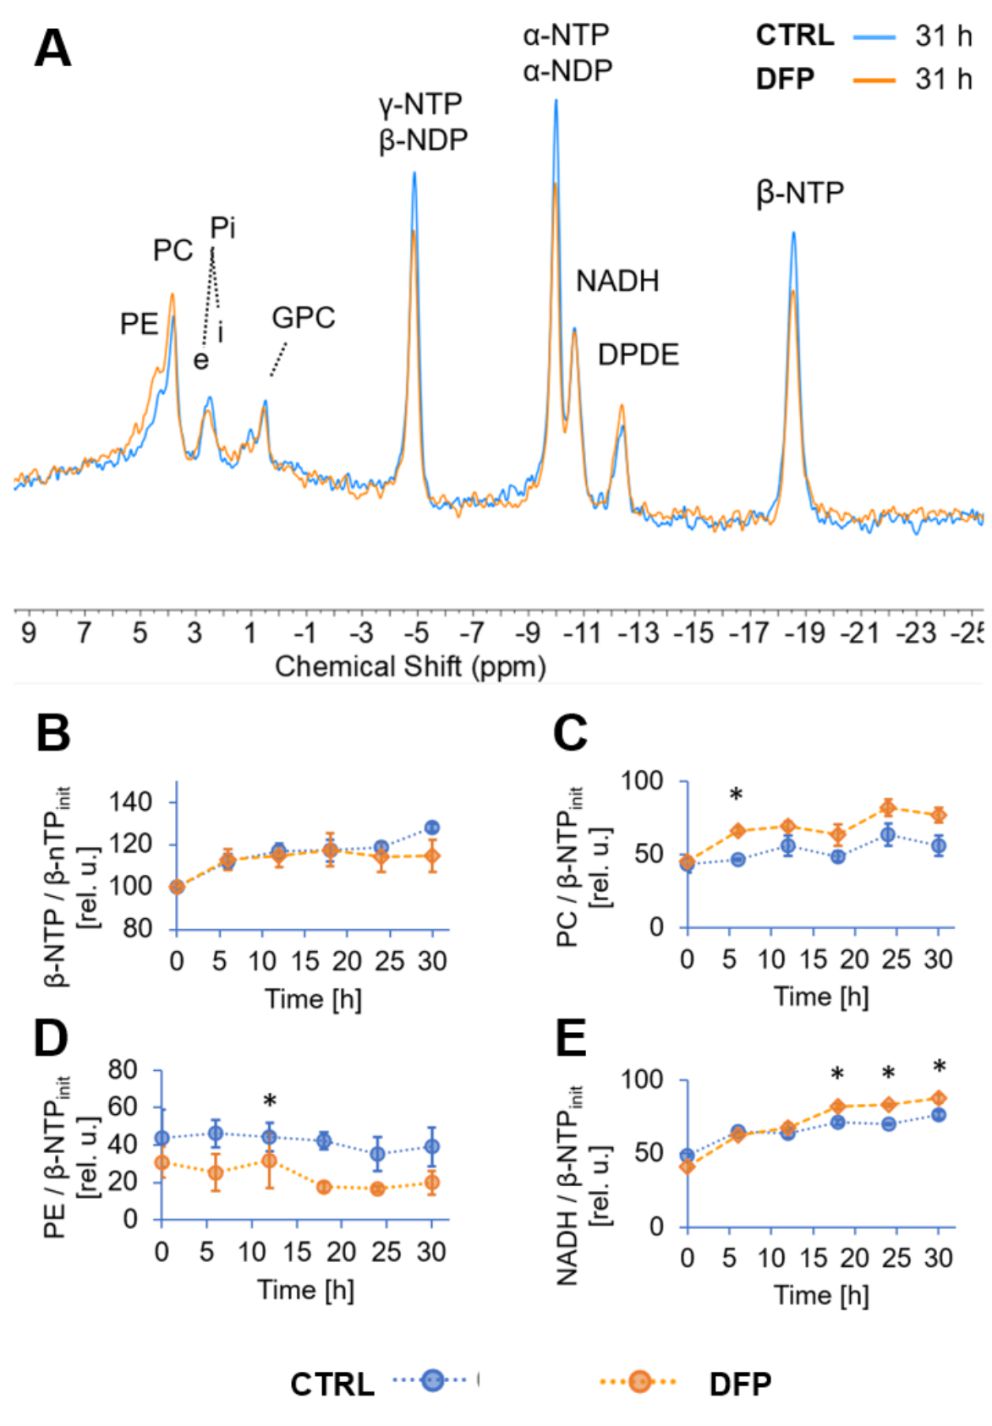
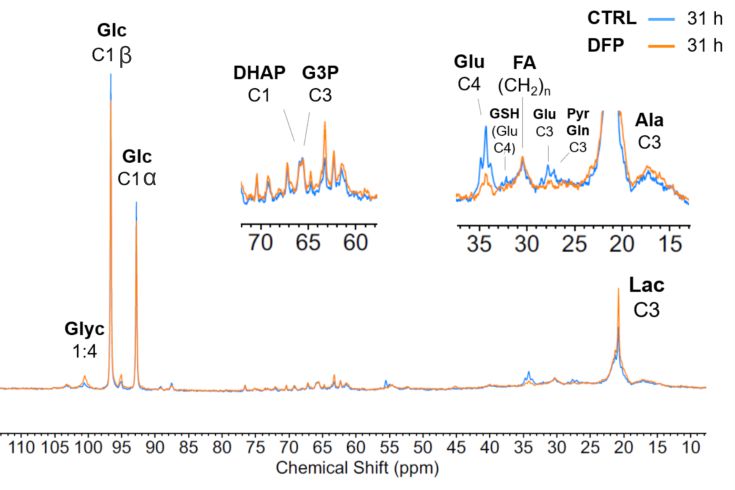
The comparison between cell count ratios (rC = #cellsend/#cellsinitial) and corresponding cellular energy ratios (rE=[β-NTPend/β-NTPinit]) of DFP-treated and untreated MDA-MB-231 cells showed that cell mass and cellular energy ratios were significantly lower in DFP-treated than untreated MDA-MB-231 cells, with a significantly smaller decrease (p<0.05) observed for rE than for rC (Fig. 1). These observations agree with our previous findings for murine 4T1 TNBC cells and the cytostatic DFP effect in our IC50studies1. Figure 2 addresses the effects of DFP on cellular energy and phospholipid metabolism and pH, as measured by 31P MRS (representative spectra at 31 h shown in Fig. 2A). Time course data of β-NTP reveal similar β-NTP levels up-to 25 h beyond which β-NTP increases further only in the CTRL MDA-MB-231 cells, consistent with cell growth (Fig. 2B). Beyond the significantly higher PC in CTRL versus DFP-treated MDA-MB-231 cells, PC remains higher in the DFP-treated cells, consistent with reduced phospholipid turnover (Fig. 2C). PE is lower in DFP-treated than untreated MDA-MB-231 cells with a statistically significant difference at 12 h (Fig. 2D). NADH metabolites differ significantly at the latest time points (>15 h) between DFP-treated and untreated MDA-MB-231 cells (Fig. 2E). These results agree with our previous findings in murine 4T1 TNBC1 and the TRAMP-C2 prostate cancer cell lines3.Figure 3 shows the comparison between representative 13C MR spectra of DFP-treated and untreated MDA-MB-231 cells acquired at 31 h. The quantitative evaluation of 13C metabolites (Fig. 4) shows various average metabolite levels that differ significantly between DFP-treated and untreated MDA-MB-231 cells. A significant decrease in uptake and metabolization of Glc 1Cα and Glc 1Cβ was observed in the presence of DFP at 12 h and 18 h for Glc 1Cα and at 12 h – 31 h for Glc 1Cβ. The incorporation of Glc into glycogen (Glyc) is significantly higher in DFP-treated than untreated MDA-MB-231 cells while de-novo glutamate (Glu) and lactate (Lac) syntheses significantly decrease in DFP-treated compared to untreated MDA-MB-231 cells (Fig. 4B).
Figure 5 shows the comparison of the metabolite 13C-labeling rates at each time point between DFP-treated and untreated human MDA-MB-231 murine 4T1 cells. In both TNBC cell lines, exposure to DFP affects glucose consumption, glucose-driven Krebs cycle activity, cellular energy and fatty acid metabolism in accordance to previous findings in TRAMP-C2 prostate cancer cells3.
Conclusion
The cytostatic and metabolic effects of DFP in the TNBC cell lines MDA-MB-231 and 4T1 is a preliminary step for the preclinical application in combination therapy in ongoing in vivo animal studies followed by clinical translation. Clinical translation is straightforward due to Deferiprone already being clinically approved for non-cancer related diseases.Acknowledgements
This work was supported by grants W81ZWH-17-1-0525 (JAK) and P30CA008748 (Cancer Center Support Grant). We thank Dr. RV Simões for helpful discussions.References
1. Porcari P, Ackerstaff E, Winkleman DP, et al. The Role of Iron Chelation in the Tumour Microenvironment of Triple-Negative Breast Cancer. Proc. Intl. Soc. Mag. Reson. Med.2020; 28:144
2. Simoes RV, Serganova IS, Kruchevsky N, et al. Metabolic plasticity of metastatic breast cancer cells: adaptation to changes in the microenvironment. Neoplasia. 2015; 17(8):671-84
3. Simoes RV, Veeraperumal S, Serganova IS, et al. Inhibition of prostate cancer proliferation by Deferiprone. NMR Biomed. 2017;30(6).
Figures
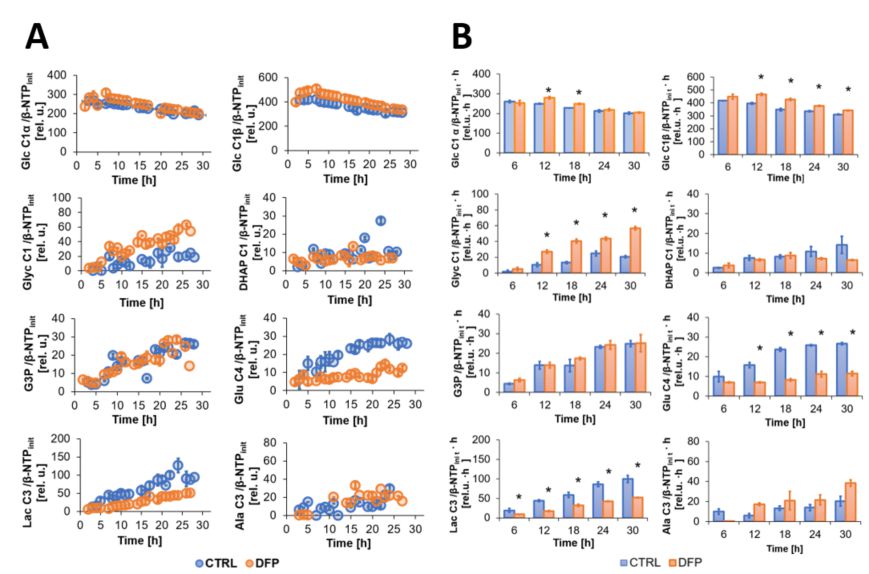
Effect of DFP on live MDA-MB-231 cell metabolism over time, as detected by 13C MRS. A: Average time course data of 1-13C-labeled Glc consumption and synthesis of [1-13C] Glyc, [1-13C] DHAP; [3-13C] G3P, [4-13C] Glu, [3-13C] Lac and [3-13C] Ala, are shown for DFP-treated (orange) and untreated (blue) MDA-MB-231 cells. B Average metabolite levels (mean ± SE) at different 6 h time intervals.
* Significantly different from untreated MDA-MB-231 cells (p<0.05, unpaired T test).
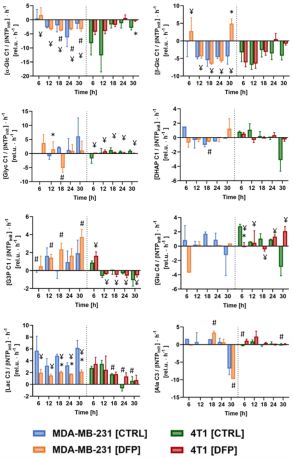
Comparison between the metabolite 13C-labeling rates of the human MDA-MB-231 and the murine 4T1 TNBC cells, (both, DFP-treated (DFP) and untreated (CTRL)), as detected by 13C MRS at each time point.
* Significantly different from untreated (CTRL) cells (p<0.05, unpaired T test).
# Significantly different from DFP-treated cells (p<0.05, unpaired T test).
¥ Significantly different from different time points (p<0.05, 2-way ANOVA with Geisser-Greenhouse correction