1841
Reliable estimation of the MRI-visible effective axon radius using light microscopy: the need for large field-of-views1Institute of Systems Neuroscience, University Medical Center Hamburg-Eppendorf, Hamburg, Germany, 2Department of Neurophysics, Max Planck Institute for Human Cognitive and Brain Sciences, Leipzig, Germany, 3Paul Flechsig Institute of Brain Research, University of Leipzig, Leipzig, Germany, 4Felix Bloch Institute for Solid State Physics, Faculty of Physics and Earth Sciences, Leipzig, Germany
Synopsis
MRI-based models enable non-invasive characterization of brain microstructure, e.g. the effective axon radius ($$$r_{\text{eff}}$$$). Often, these models were validated by small-field-of-view microscopy (sFoVM) images (~10³ axons). As $$$r_{\text{eff}}$$$ is dominated by large, sparsely occurring axons, sFoVM-based estimations may miss large axons and underestimate $$$r_{\text{eff}}$$$. We employed an in-house developed pipeline to estimate $$$r_{\text{eff}}$$$ on large-scale light microscopy (lsLM) sections with similar spatial extent as the voxel sizes in human MRI systems. Taking lsLM as a baseline, we showed that sFoVM is an unsuitable reference for $$$r_{\text{eff}}$$$ and verified the potential of $$$r_{\text{eff}}$$$ to capture relevant spatial, anatomical variation.
Introduction
The assessment of microstructural properties through MRI-based models in white matter tissue of the human brain, such as the MRI-visible effective radius ($$$r_{\text{eff}}$$$) 1, is of increasing interest, but requires thorough validation studies and has been questioned as being a meaningful neuroimaging biomarker 2. However, the literature is currently lacking a reliable reference for the validation of $$$r_{\text{eff}}$$$. As $$$r_{\text{eff}}$$$ is weighted towards the tail of the axon radii distribution, it is necessary to representatively capture large, sparsely occurring axons and therefore validate MRI-based models at similar scale i.e. the spatial extent of typical MRI voxels (~1 mm³). Often, the validation of $$$r_{\text{eff}}$$$ was done based on small-field-of-view microscopy (sFoVM) images covering a few thousand axons or less 1,3-6, e.g. obtained from manually labeled electron microscopy (mlEM) sections 3-6. While sophisticated electron microscopy (EM) techniques have been demonstrated to provide high resolution images at the desired scale 7, we instead employed CNN-based (convolutional neural network), automated segmentation on large-scale light microscopy (lsLM) sections. Albeit suffering from variations in contrast and being incapable to resolve very small axons, lsLM may prove to be a cost- and time-efficient approach to generate reference data at the required spatial extent (>= 1mm²). Using lsLM-based estimation as a reference method, we assessed the error in sFoVM-based estimations of $$$r_{\text{eff}}$$$. Moreover, we investigated the potential of $$$r_{\text{eff}}$$$ to capture anatomical variation of the pool of large axons across a human corpus callosum sample to verify its general potential as a meaningful neuroimaging biomarker.Materials and Methods
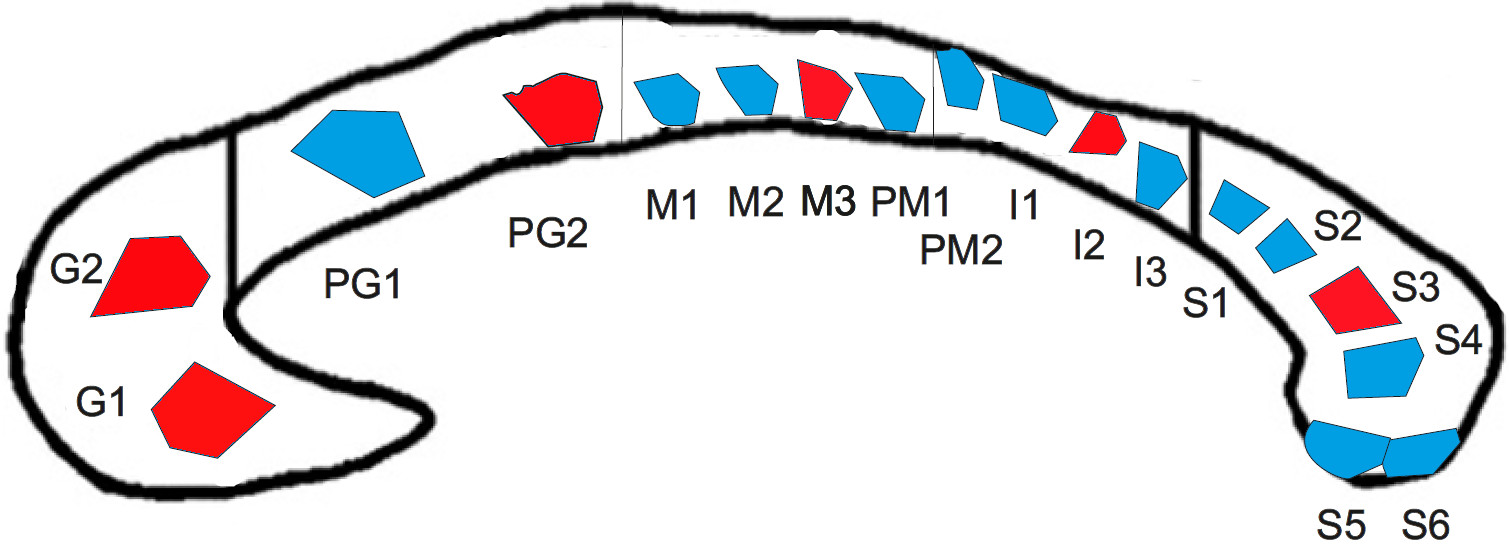
DatasetA human corpus callosum sample (see Figure 1) was obtained at autopsy with prior informed consent (male, 74 years, 24 hours postmortem delay) and approval by the responsible authorities (Approval \#205/17‐ek). We acquired lsLM images of 18 semi-thin (500 nm) sections using a Zeiss AxioScan Z1 (pixel size: 0.1112 µm). The spatial extent ranged from 0.3 mm² to 9.2 mm² (on average: 3.5 mm²). For six lsLM sections, consecutively cut, ultra-thin (50 nm) EM sections were acquired using a Zeiss EM 912 Omega (pixel size: 0.0043 µm) and subsections (size: 0.005 mm² to 0.014 mm²; on average: 0.007 mm²) were manually segmented as axon, myelin or background to obtain mlEM images.
Effective axon radius estimation
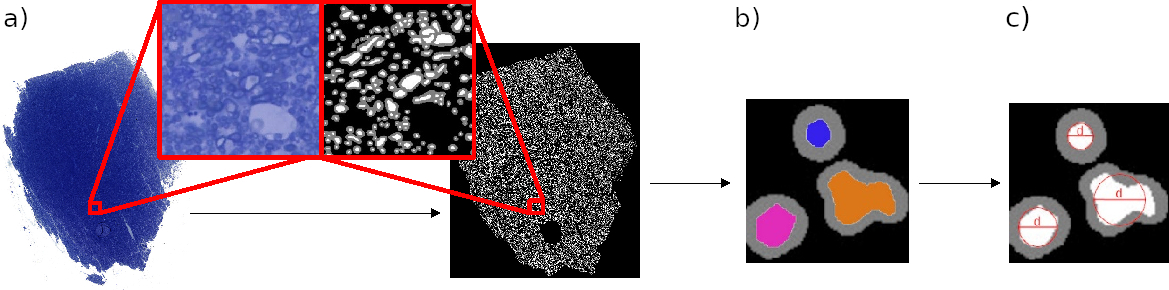
Individual axon radii ($$$r$$$) were obtained from lsLM sections and mlEM subsections using an in-house developed pipeline (see Figure 2) 8. The effective axon radius was computed as $$$r_{\text{eff}} = \sqrt[4]{<r^6>/<r^2>}$$$ 1 .
Experiment 1: Influence of FoV on $$$r_{\text{eff}}$$$
To assess the influence of the FoV on the estimation accuracy of $$$r_{\text{eff}}$$$, we sampled the distribution of $$$r_{\text{eff}}$$$ over randomly positioned lsLM subsections and compared it to $$$r_{\text{eff}}$$$ obtained from the corresponding whole lsLM sections and consecutively cut mlEM subsections. This procedure was repeated for varying FoV (0.002 mm² to 0.64 mm² but at most 10 % of the whole section area) and the number of subsections per FoV was chosen so that the accumulated subsection areas matched approximately 25 times the area of the whole lsLM section. To evaluate the typical error for a FoV that resembled the average size of the mlEM subsections (0.007 mm²), we determined the error 1 as the range of relative errors of the median with respect to the corresponding whole section $$$r_{\text{eff}}$$$ for a FoV of 0.005 mm².
Experiment 2: Relationship between large axons and $$$r_{\text{eff}}$$$
We computed a linear regression to predict the fraction of large axons ($$$f_{\text{large}}$$$) from $$$r_{\text{eff}}$$$ over all lsLM sections. The threshold for large axons ($$$r >= 1.6$$$ µm) was determined so that $$$r_{\text{eff}}$$$ was halved when axons with radii above this threshold were removed.
Results
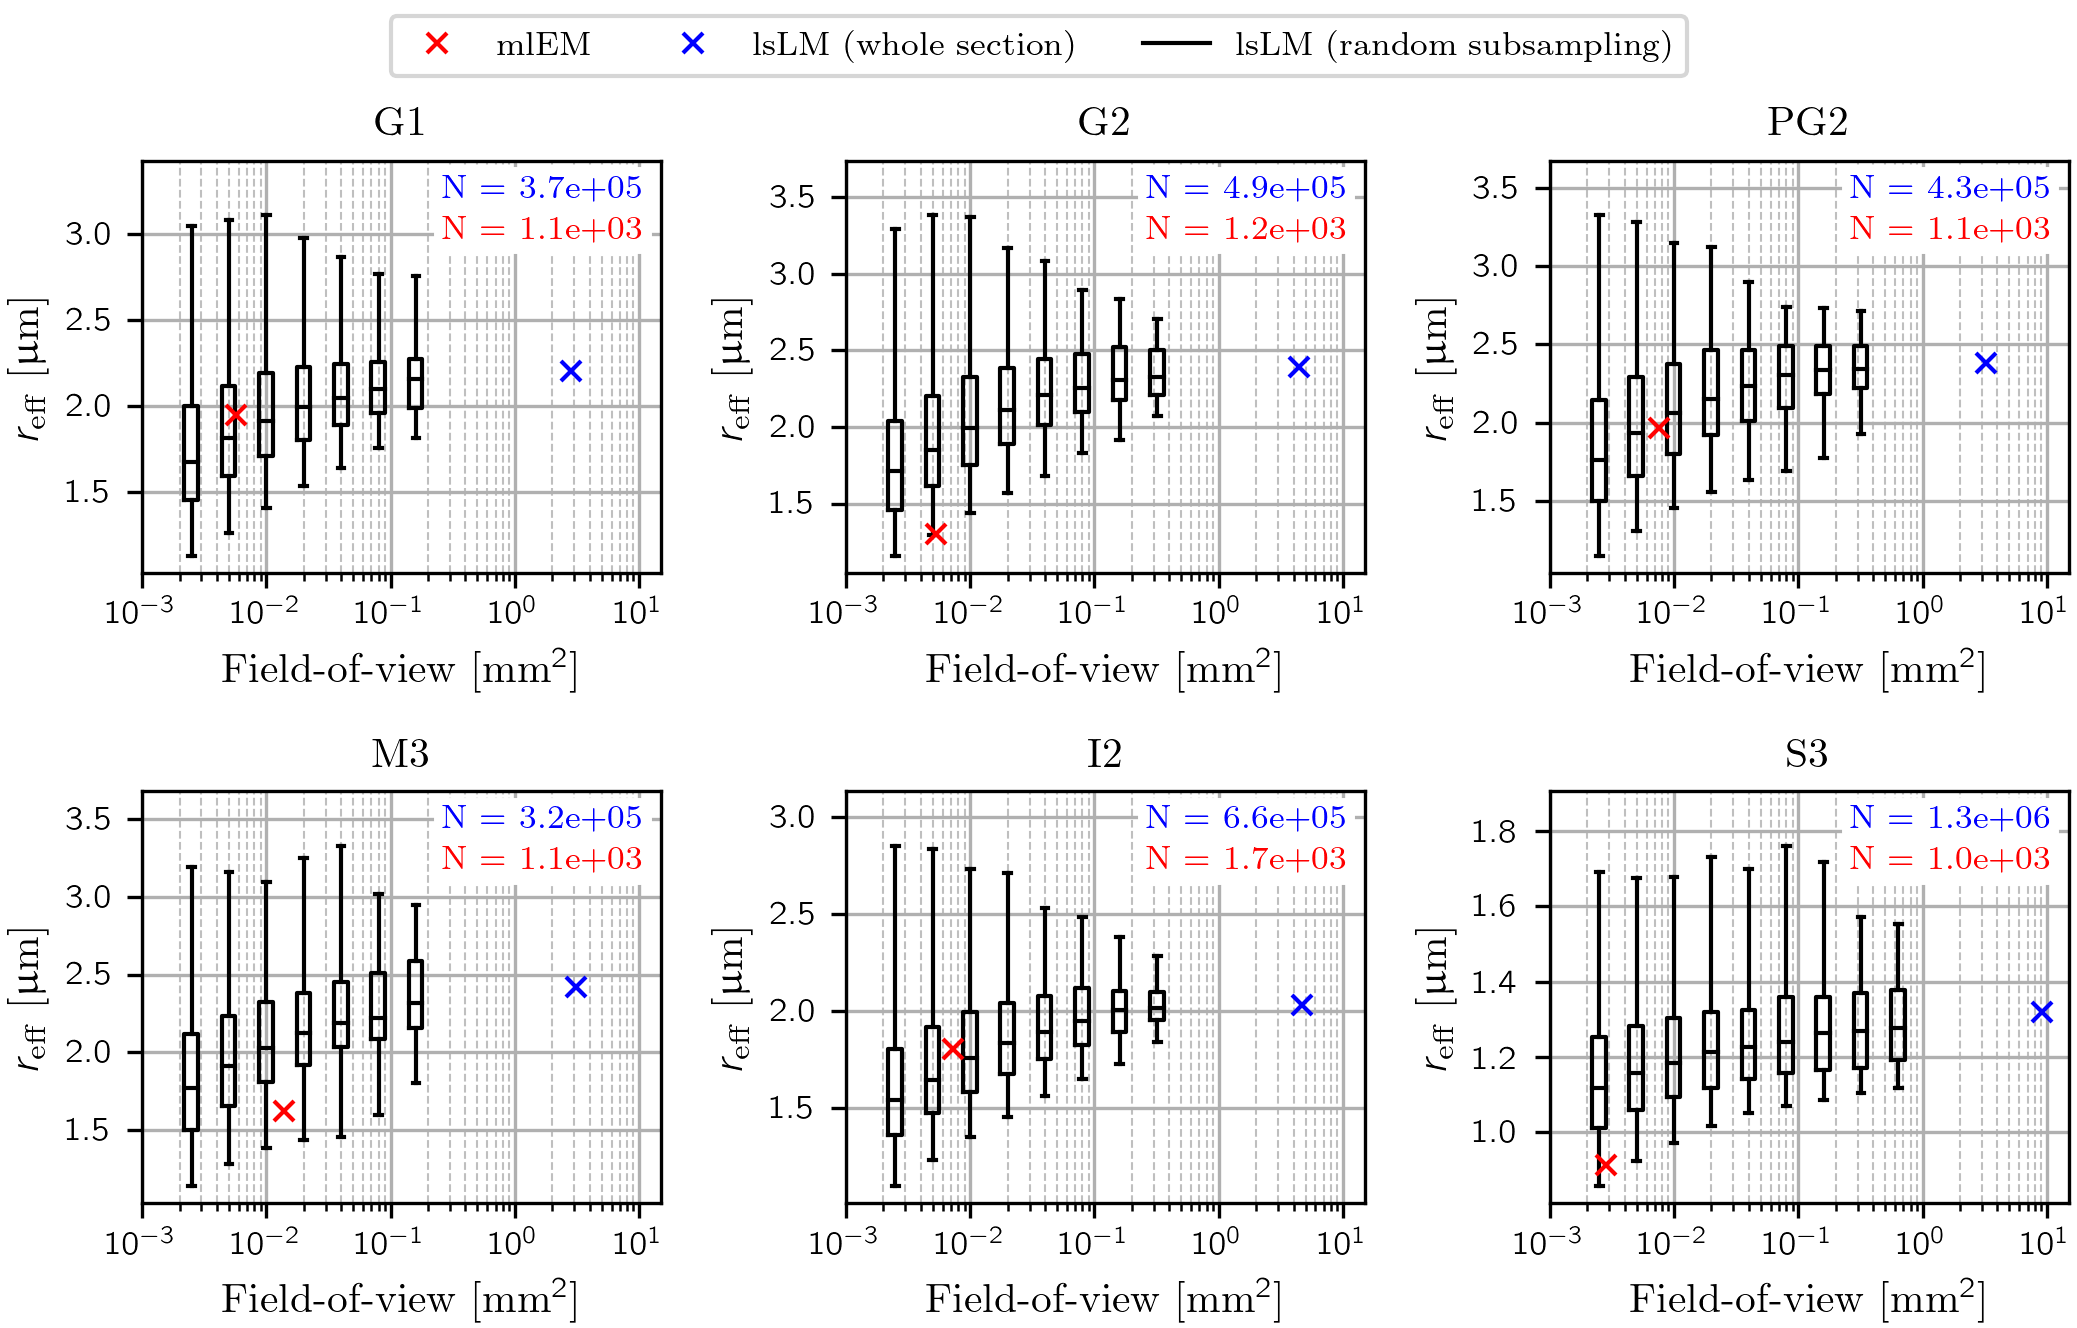
Experiment 1: Influence of FoV on $$$r_{\text{eff}}$$$$$$r_{\text{eff}}$$$ obtained from small-FoV subsections as well as the estimation of $$$r_{\text{eff}}$$$ from mlEM consistently underestimated $$$r_{\text{eff}}$$$ (see Figure 3). With increasing FoV, both underestimation of the median and spread of the subsampled $$$r_{\text{eff}}$$$ decreased. Errors of the median $$$r_{\text{eff}}$$$ ranged from -22.6 % to -12.3 % for a FoV of 0.005 mm² that resembled the mlEM FoV used in this study.
Experiment 2: Relationship between large axons and $$$r_{\text{eff}}$$$
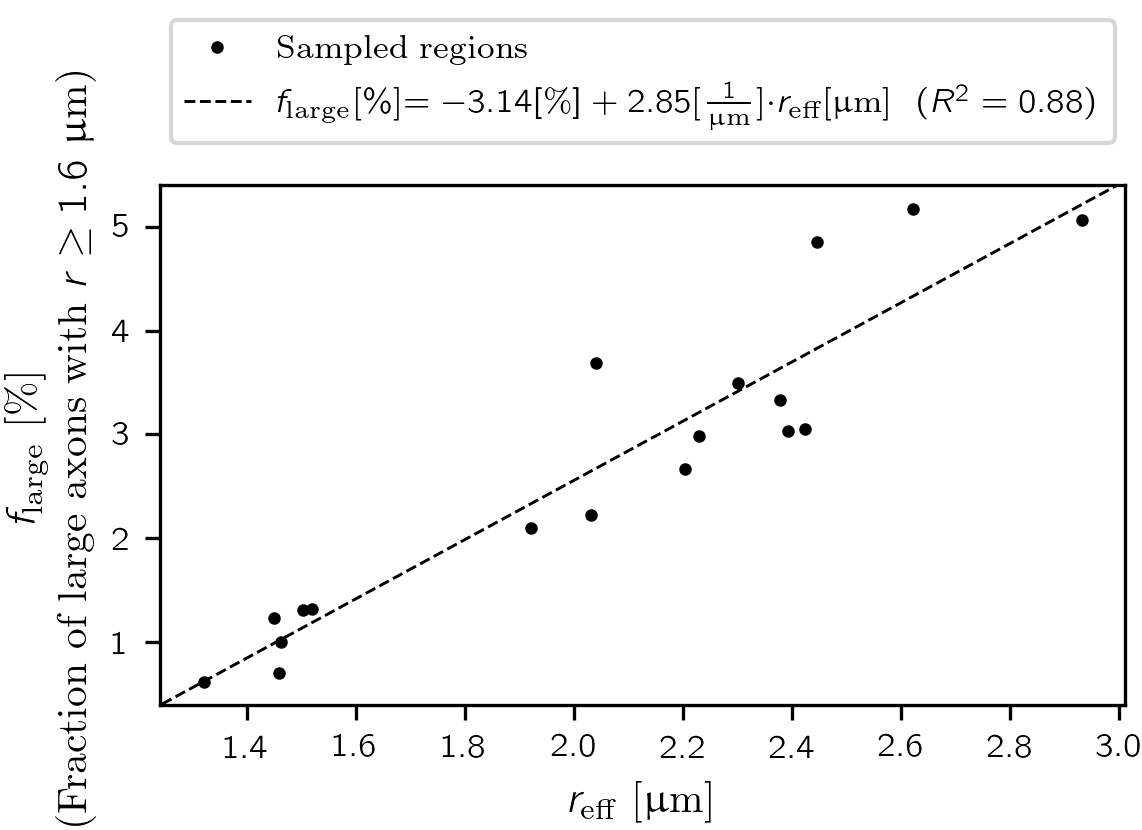
The fraction of large axons $$$f_{\text{large}}$$$ was linearly related to $$$r_{\text{eff}}$$$ ($$$f_{\text{large}}$$$ [%] = -3.14 [%] + 2.85 * [1/µm] * $$$r_{\text{eff}}$$$ [µm], R² = 0.88) (see Figure 4).
Discussion
We demonstrated that the estimation of $$$r_{\text{eff}}$$$ from sFoVM is an unsuitable method to generate a robust reference for $$$r_{\text{eff}}$$$ due to underestimation (-22.6 % to -12.3 %), likely because large, sparsely occurring axons are underrepresented. The linear relationship between the fraction of large axons and $$$r_{\text{eff}}$$$ indicated that at the spatial extent of typical MRI voxels (~ 1 mm³), $$$r_{\text{eff}}$$$ scaled with the ensemble of large axons ($$$r >= 1.6$$$ µm) rather than being dominated by individual, very large axons in the investigated corpus callosum sample. Further studies are being conducted to confirm these observations by assessment of the accuracy of the suggested automated segmentation from lsLM and to relate $$$r_{\text{eff}}$$$ to the underlying axon radii distribution in a more meaningful way than the employed histogram split.Conclusion
A robust reference for $$$r_{\text{eff}}$$$ requires a large ensemble of axons at MRI-similar scale and therefore large field of view microscopy combined with an automated approach.Acknowledgements
The Max Planck Institute for Human Cognitive and Brain Sciences has an institutional research agreement with Siemens Healthcare. NW was a speaker at an event organized by Siemens Healthcare and was reimbursed for the travel expenses.
The research leading to these results has received funding from the European Research Council under the European Union's Seventh Framework Programme (FP7/2007-2013) / ERC grant agreement n° 616905.
This work was supported by the German Research Foundation (DFG Priority Program 2041 "Computational Connectomics”, [MO 2397/5-1; MO 2249/3–1], by the Emmy Noether Stipend: MO 2397/4-1) and by the BMBF (01EW1711A and B) in the framework of ERA-NET NEURON and the Forschungszentrums Medizintechnik Hamburg (fmthh; grant 01fmthh2017).
References
1. J. Veraart et al., “Noninvasive quantification of axon radii using diffusion MRI,” eLife, vol. 9, p. e49855, Feb. 2020, doi: 10.7554/eLife.49855
2. M. Paquette, C. Eichner, T. R. Knösche, and A. Anwander, “Axon Diameter Measurements using Diffusion MRI are Infeasible,” Biophysics, preprint, Oct. 2020. doi: 10.1101/2020.10.01.320507
3. D. Liewald, R. Miller, N. Logothetis, H.-J. Wagner, and A. Schüz, “Distribution of axon diameters in cortical white matter: an electron-microscopic study on three human brains and a macaque,” Biol. Cybern., vol. 108, no. 5, pp. 541–557, Oct. 2014, doi: 10.1007/s00422-014-0626-2
4. R. Caminiti, H. Ghaziri, R. Galuske, P. R. Hof, and G. M. Innocenti, “Evolution amplified processing with temporally dispersed slow neuronal connectivity in primates,” Proc. Natl. Acad. Sci. U. S. A., vol. 106, no. 46, pp. 19551–19556, Nov. 2009, doi: 10.1073/pnas.0907655106
5. D. Graf von Keyserlingk and U. Schramm, “Diameter of axons and thickness of myelin sheaths of the pyramidal tract fibres in the adult human medullary pyramid,” Anat. Anz., vol. 157, no. 2, pp. 97–111, 1984
6. F. Aboitiz, A. B. Scheibel, R. S. Fisher, and E. Zaidel, “Fiber composition of the human corpus callosum,” Brain Res., vol. 598, no. 1, pp. 143–153, Dec. 1992, doi: 10.1016/0006-8993(92)90178-C
7. W. Yin et al., “A petascale automated imaging pipeline for mapping neuronal circuits with high-throughput transmission electron microscopy,” Nat. Commun., vol. 11, no. 1, Art. no. 1, Oct. 2020, doi: 10.1038/s41467-020-18659-3.
8. L. Mordhorst et al., “Human Axon Radii Estimation at MRI Scale: Deep Learning Combined with Large-scale Light Microscopy,” Workshop Bildverarbeitung für die Medizin, 2021
9. O. Ronneberger, P. Fischer, and T. Brox, “U-Net: Convolutional Networks for Biomedical Image Segmentation,” in Medical Image Computing and Computer-Assisted Intervention – MICCAI 2015, Cham, 2015, pp. 234–241, doi: 10.1007/978-3-319-24574-4_28
Figures