1840
Measuring inhomogeneous MT (ihMT) in human brain by multi-parameter mapping (MPM)1Medical Radiation Physics, Clinical Sciences Lund, Lund University, Lund, Sweden, 2Neurophysics, Max Planck Institute for Human Cognitive and Brain Sciences, Leipzig, Germany, 3NMR Methods & Development Group, Max Planck Institute for Human Cognitive and Brain Sciences, Leipzig, Germany, 4Felix Bloch Institute for Solid State Physics, Leipzig University, Leipzig, Germany
Synopsis
Inhomogenous Magnetization Transfer (ihMT), the differential response to irradiation at single and dual frequency offsets, is sensitive to myelination. Quantification of ihMT in terms of MT saturation (MTsat), the percent reduction of Mz, corrects for underlying T1 and B1+ and allows comparing different implementations to optimize multi-parameter mapping (MPM) protocols. ihMTsat in white matter is roughly one twentieth of MTsat, merely 0.2 p.u. at 5kHz and 100% SAR at 3T. Noise propagation demands acquisition at 1.5mm resolution, large-array coils, and smaller offsets than suggested previously. Inverse MT ratios are highly correlated to ihMTs but obscure the true effect size.
Introduction
Inhomogenous Magnetization Transfer (ihMT), the differential response to irradiation at single and dual frequency offsets, is sensitive to myelin1. Saturation schemes have been converging on interleaved trains of repeated MT and readout pulses2.We implemented an ihMT scheme into the acquisition of multi-parameter mapping (MPM) at 3T3. We propose to derive ihMT from MT saturation (MTsat) maps, which are corrected or variations in flip angle, B1+, and underlying T1 relaxation4. This ihMTsat permits to compare different saturation schemes to optimize the protocol using the MPM signal equation. Finally, ihMTsat is compared to the inverse ihMT ratio5, the difference of the inverse signals normalized by a T1-weighted reference.
Theory
For small flip angles α<<1 and short TR<<T1, the FLASH signal is well approximated by $$S_{\pm\pm}=S_{0}\frac{\alpha TR/T_{1}}{TR/T_{1}+\alpha ^{2}/2 +\delta_{\pm\pm}}. ....[1]$$ The subscripts indicate the four ihMT experiments: S++ and S–– indicate solely positive and negative offsets and S+– and S–+ alternating signs, with corresponding MT saturations: δ++, δ––, δ+– and δ–+. These represent the effect of the MT-pulses on free water by additional fractional saturations in percent units [p.u.]. δ++ and δ––differ slightly due to a shifted absorption lineshape6. This and contributions from direct saturation are eliminated by calculating the ihMT saturation . $$\delta_{ihMT}=\frac{1}{2}(\delta_{+-}+\delta_{-+})-\frac{1}{2}(\delta_{++}+\delta_{--})=(\frac{1}{S_{+-}}+\frac{1}{S_{-+}}-\frac{1}{S_{++}}-\frac{1}{S_{--}})\frac{S_{0}\alpha TR}{2T_{1}} ....[2]$$ This is an inverse MTratio, but normalized by maps of the signal amplitude (S0) and apparent T1, which renders ihMTsat independent of underlying T1 and B1+4. The change in signal S±± by differences in δ±±=δ+Δδ±±$$\frac{dS}{d\delta} \Delta\delta_{\pm\pm}=S(\delta)\frac{-\Delta\delta_{\pm\pm}}{TR/T_{1}+\alpha ^{2}/2 +\delta} ....[3]$$ is optimized by short TR and α=0.82*sqrt(TR/T1+δ) for given TR and MTsat7.
Experiments
Four healthy adult subjects were scanned at 3T (Siemens PrismaFit) with written informed consent. In an MT-FLASH sequence for MPM, the Gaussian MT-pulse was replaced by a power-equivalent pair of Gaussian pulses with half of the duration (2ms) and flip angle allowing four combinations of the sign of the frequency offset sign (++, --) (+-, -+) and up to 8 repetitions.Sagittal 3D volumes were acquired at 1.5 mm resolution, 160x140x120 matrix, 6/8 partial Fourier in phase and slice. The final protocol featured TR=24.2ms (4min per volume), and 10°, 6° and 21° readout for T1-, PD- and ihMT-weighting by one MT-pulse pair of 160° at ±4kHz,. Multiple gradient echoes were averaged to increase SNR8 prior to coregistration. Maps of T1, S0 and MTsat for each saturation scheme yielded ihMTsat, visualized by pseudocolor-overlays and whole-brain histograms.
Experiment 1: To determine the frequency offset dependence, eight MT-pulses (90°, 93% SAR) were applied at offsets of ±2kHz, ±5kHz, ±8kHz, and ±11kHz.
Experiment 2: To corroborate the increase of MTsat with MT-pulse train length, 2 to 8 MT-pulses were applied (90°, ±8kHz offset, 22.4 to 5.6ms preparation) thus increasing TR from 13.2ms to 30ms to and SAR levels from 54% to 93%.
Experiment 3: To improve SNR, six gradient echoes (equidistant TE=2.3 to 13.8ms) were acquired and averaged. A single MT-pulse pair of 160° (99% SAR) was applied at ±3kHz, ±5kHz, ±7kHz, ±9kHz.
Experiment 4: Using a 32-channel coil for improved SNR the MT readout was increased to 10°.
Results
MTsat was lowest for positive offsets and highest for dual frequency saturation. These latter schemes showed only small signal differences, however, using both to calculate ihMTsat [2] reduces noise. In WM, ihMTsat scaled with MTsat, being about 5% of MTsat notwithstanding regional variation.Experiment 1/Figure 1: MTsat and ihMTsat decreased strongly with frequency offset. MTsat at ±2kHz was higher than observed in conventional MPM due to applying four MT-pulse pairs close to the SAR limit. The low SNR in ihMT at ±2kHz may be explained by direct saturation and lower signal.
Experiment 2/Figure 2: MTsat increased sub-linearly with pulse train length as predicted by theory9. The derived ihMTsat increased correspondingly. Thus, a single pulse pair is slightly more efficient in creating MT contrast. This suggests that pulse train lengths could be shortened and the saved time be used for multi-echo readouts to improve SNR at constant TR, while increasing the power of the MT pulse to create a stronger MT saturation (as done via offset in Exp. 1).
Experiment 3/Figure 3: Over the narrowed range of offsets the highest SNR of ihMTsat was observed at ±5 kHz. The pseudo-color overlay of ihMTsat reveals tract specific contrast with WM, particularly in the pyramidal tracts. Averaging the two ihMT maps shows the potential of the method with improved SNR.
Experiment 4/Figure 3: Improved SNR and higher ihMTsat at ±4kHz were obtained with this optimized protocol.
Discussion
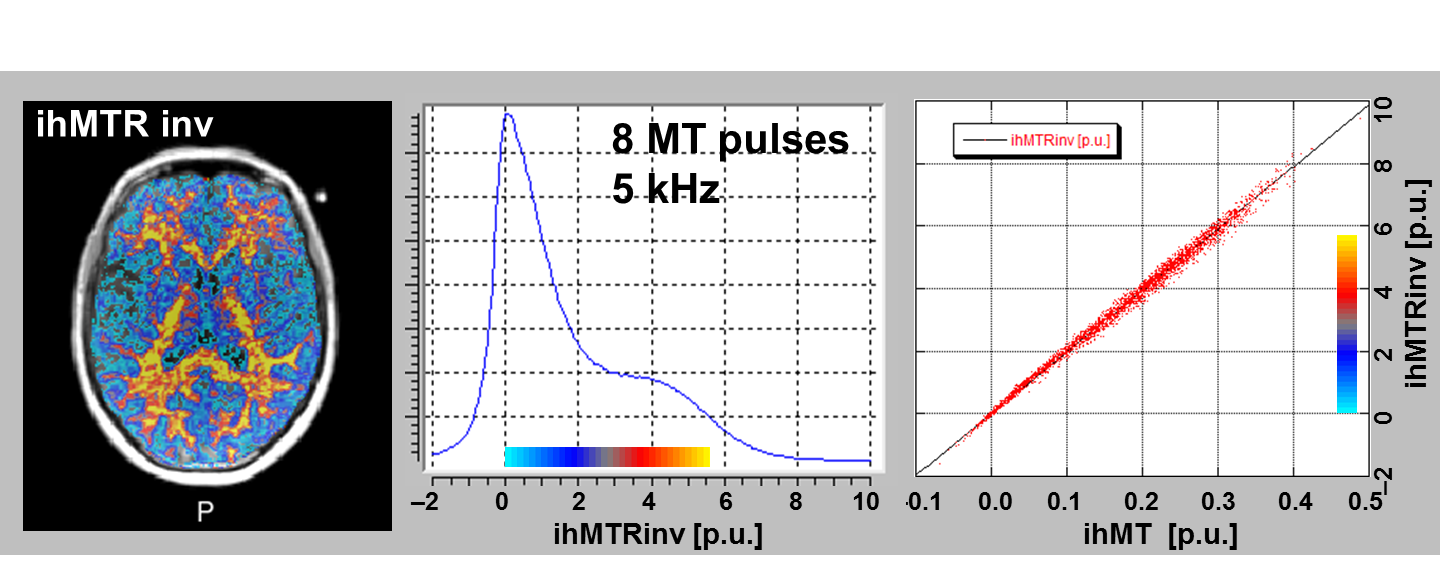
By implementing ihMT into MPM measurements, the entire framework of MTsat becomes applicable, including a toolbox10 and analytical solutions for noise propagation. Calculating ihMT from MTsat provided insight into the differential changes on Mz expressed ihMTsat for optimization of technique. With just two MT-pulses the highest ihMT was observed at smaller offsets than in MP schemes.2 The ihMT achievable under SAR constraints at 3T was <0.3 p.u. and is thus sensitive to propagation of noise from the primary images, which limited the resolution to 1.5mm. The inverse ihMT ratio was highly correlated with ihMTsat (Figure 4), but may overestimate the effect size of ihMT.Acknowledgements
GH was funded by the Swedish Research Council (NT2014-6193).
The research leading to these results has received funding from the European Research Council under the European Union's Seventh Framework Programme (FP7/2007-2013) / ERC grant agreement n° 616905. This project has received funding from the European Union's Horizon 2020 research and innovation programme under the grant agreement No 681094, and is supported by the Swiss State Secretariat for Education, Research and Innovation (SERI) under contract number 15.0137. This project has received funding from the BMBF (01EW1711A & B) in the framework of ERA-NET NEURON.
References
1) Duhamel G, Prevost VH, Cayre M, Hertanu A, Mchinda S, Carvalho VN, Varma G, Durbec P, Alsop DC, Girard OM (2019) Validating the sensitivity of inhomogeneous magnetization transfer (ihMT) MRI to myelin with fluorescence microscopy. NeuroImage 199:289–303.
2) Geeraert BL, Lebel RM, Mah AC, et al. (2018) A comparison of inhomogeneous magnetization transfer, myelin volume fraction, and diffusion tensor imaging measures in healthy children. Neuroimage 182:343-350.
3) Leutritz T, Seif M, Helms G, Samson RS, Curt A, Freund P, Weiskopf N (2020) Multi-parameter mapping (MPM) of relaxation (R1, R2*), proton density (PD) and magnetization transfer saturation (MT) at 3T: a multi-center dual-vendor reproducibility and repeatability study. Hum Brain Mapping in press DOI: 10.1002/hbm.25122
4) Helms G, Dathe H, Kallenberg K, Dechent P (2008) High-resolution maps of magnetisation transfer with inherent correction for RF inhomogeneity and T1 relaxation obtained from 3D FLASH MRI. Magn Res Med. 60:1396–1407.
5) Varma G, Munsch F, Girard OM, Duhamel G, Alsop DC (2019) An inhomogeneous magnetization transfer (ihMT) quantification method robust to B1 and T1 variation in magnetization prepared acquisitions. Proc. ISMRM Annual Meeting 2019; Montréal, QC.
6) Hua J, Jones CK, Blakeley J, Smith SA, van Zijl PCM, Zhou J (2007) Quantitative description of the asymmetry in magnetization transfer effects around the water resonance in the human brain. Magn Res Med. 58:786–793.
7) Gringel T, Schulz-Schaeffer WJ, Elolf E, Froelich A, Dechent P, Helms G (2009) Optimized high-resolution mapping of magnetization transfer (MT) at 3 Tesla for direct visualization of substructures of the human thalamus in clinically feasible measurement time. J Magn Reson Imaging 29:1285-1292.
8) Helms G, Dechent P (2009) Increased SNR and reduced distortions by averaging multiple gradient echo signals in 3D FLASH imaging of the human brain at 3 Tesla.J Magn Reson Imaging 29:198-204.
9) Helms G, Dathe H, Hagberg GE (2004) Pulsed saturation of the standard two-pool model for magnetization transfer - Part II: The transition to steady state. Concepts Magn Reson A 21A:50-62.
10) Tabelow K, Balteau E, Ashburner J, Callaghan MF, Draganski B, Helms G, Kherif F, Leutritz T, Lutti A, Phillips C, Reimer E, Ruthotto L, Seif M, Weiskopf N, Ziegler G, Mohammadi S (2019) hMRI - A toolbox for quantitative MRI in neuroscience and clinical research. Neuroimage 194:191-210.
Figures
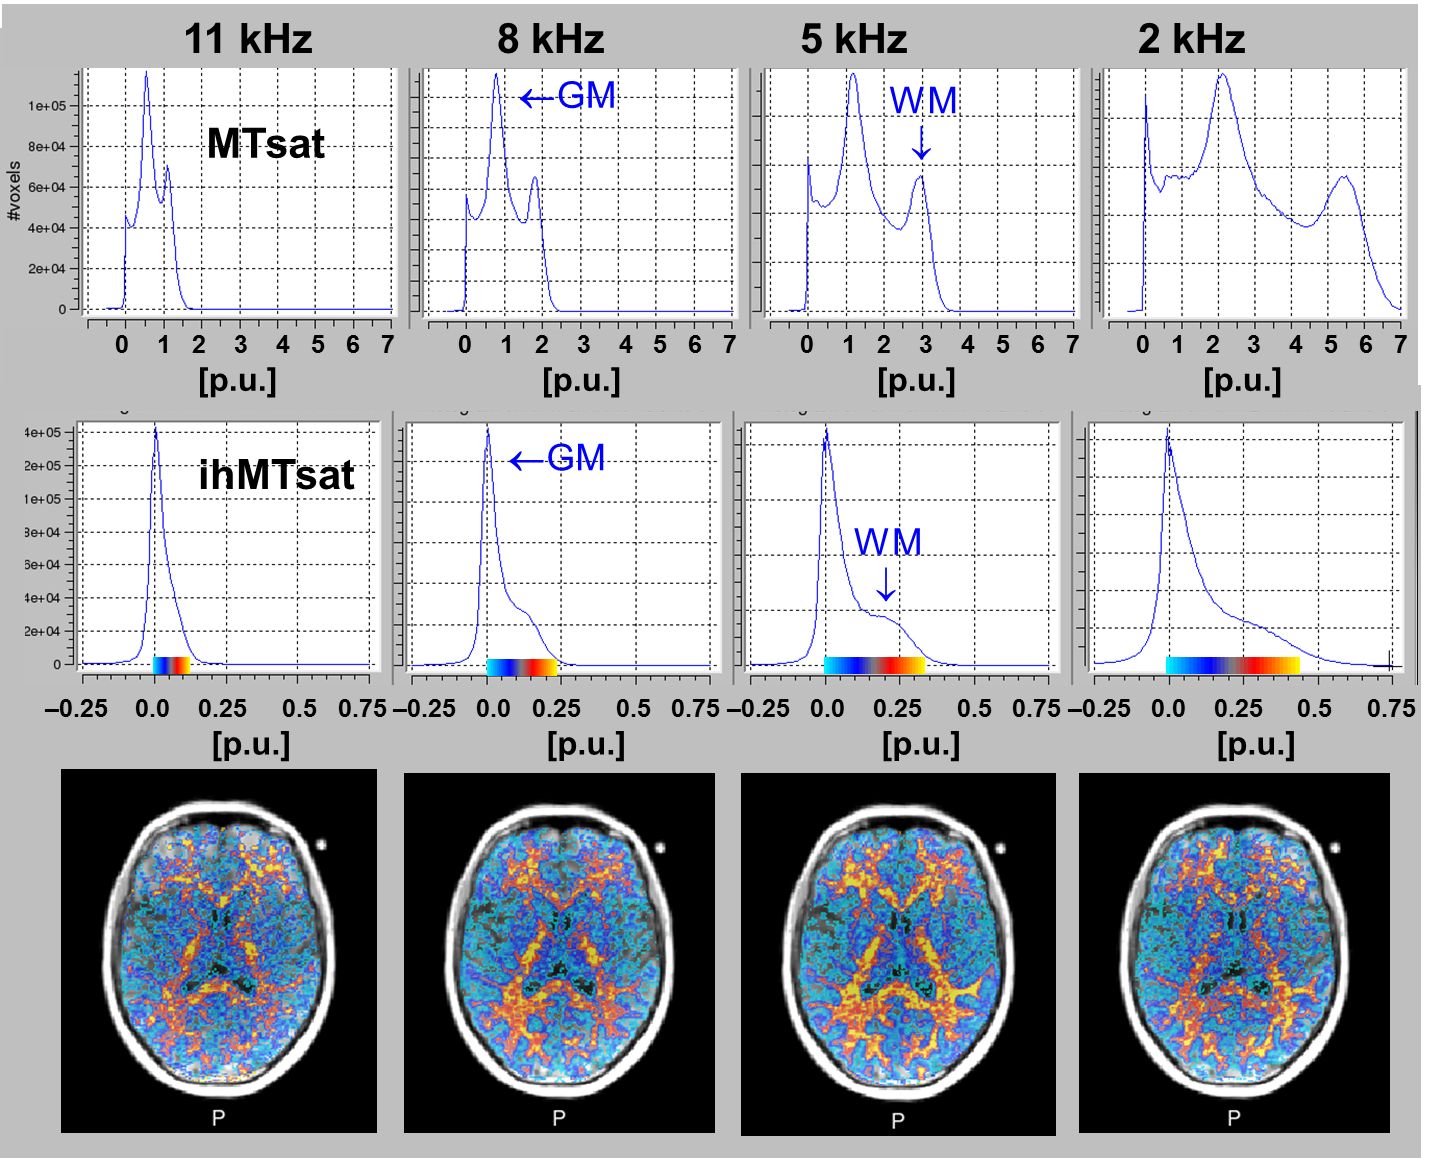
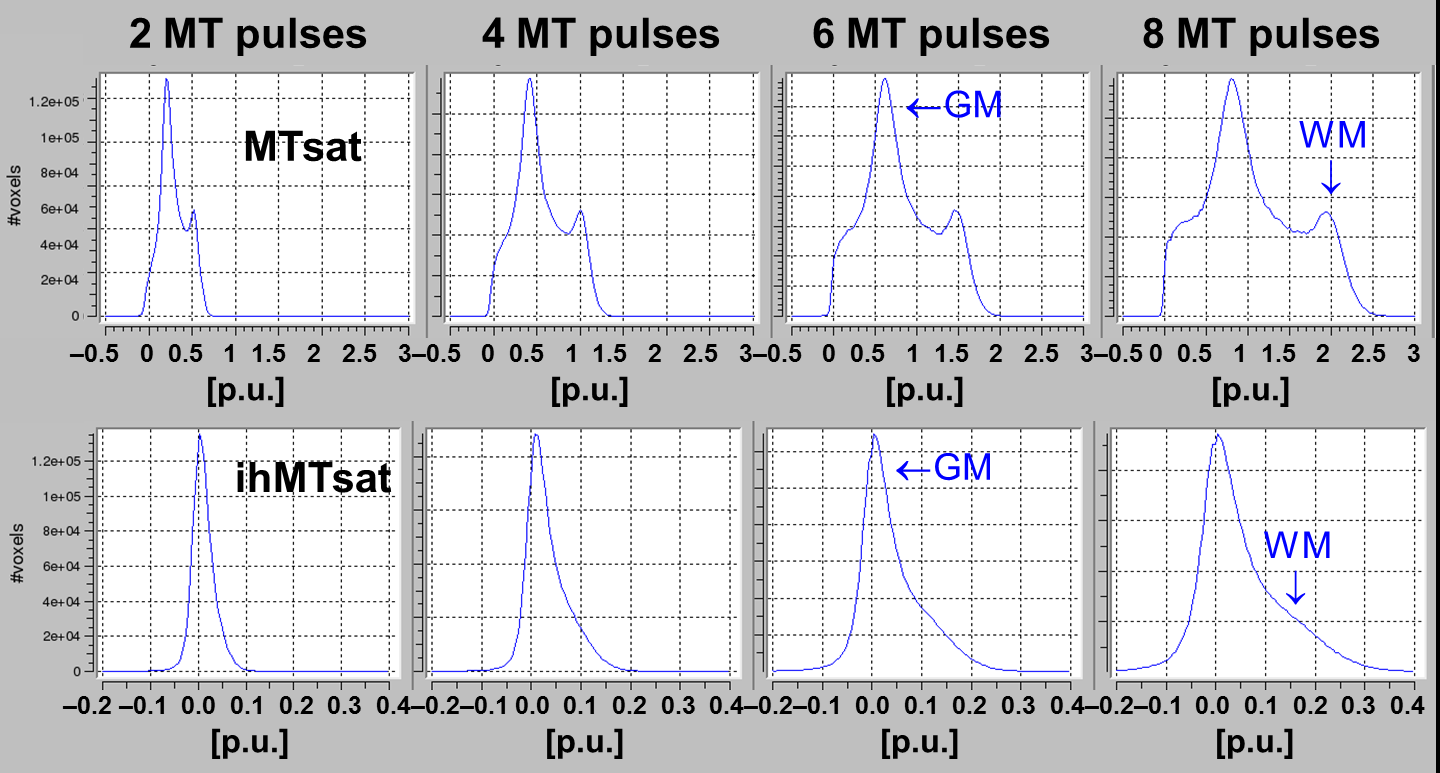
Figure 2: Increase of MTsat (top row) and ihMTsat (bottom row) with number of MT-pulses.
MTsat increased (slightly less than) linearly as predicted by a two-pool model. ihMTsat of WM increased approximately in parallel. Note that the negative ihMT values are due to noise propagation. Their frequency increased with the number of MT-pulses due to increased MTsat and longer TR, as predicted by the empirical signal equation [1]. Hence, TR was kept short by using just one MT pulse pair.
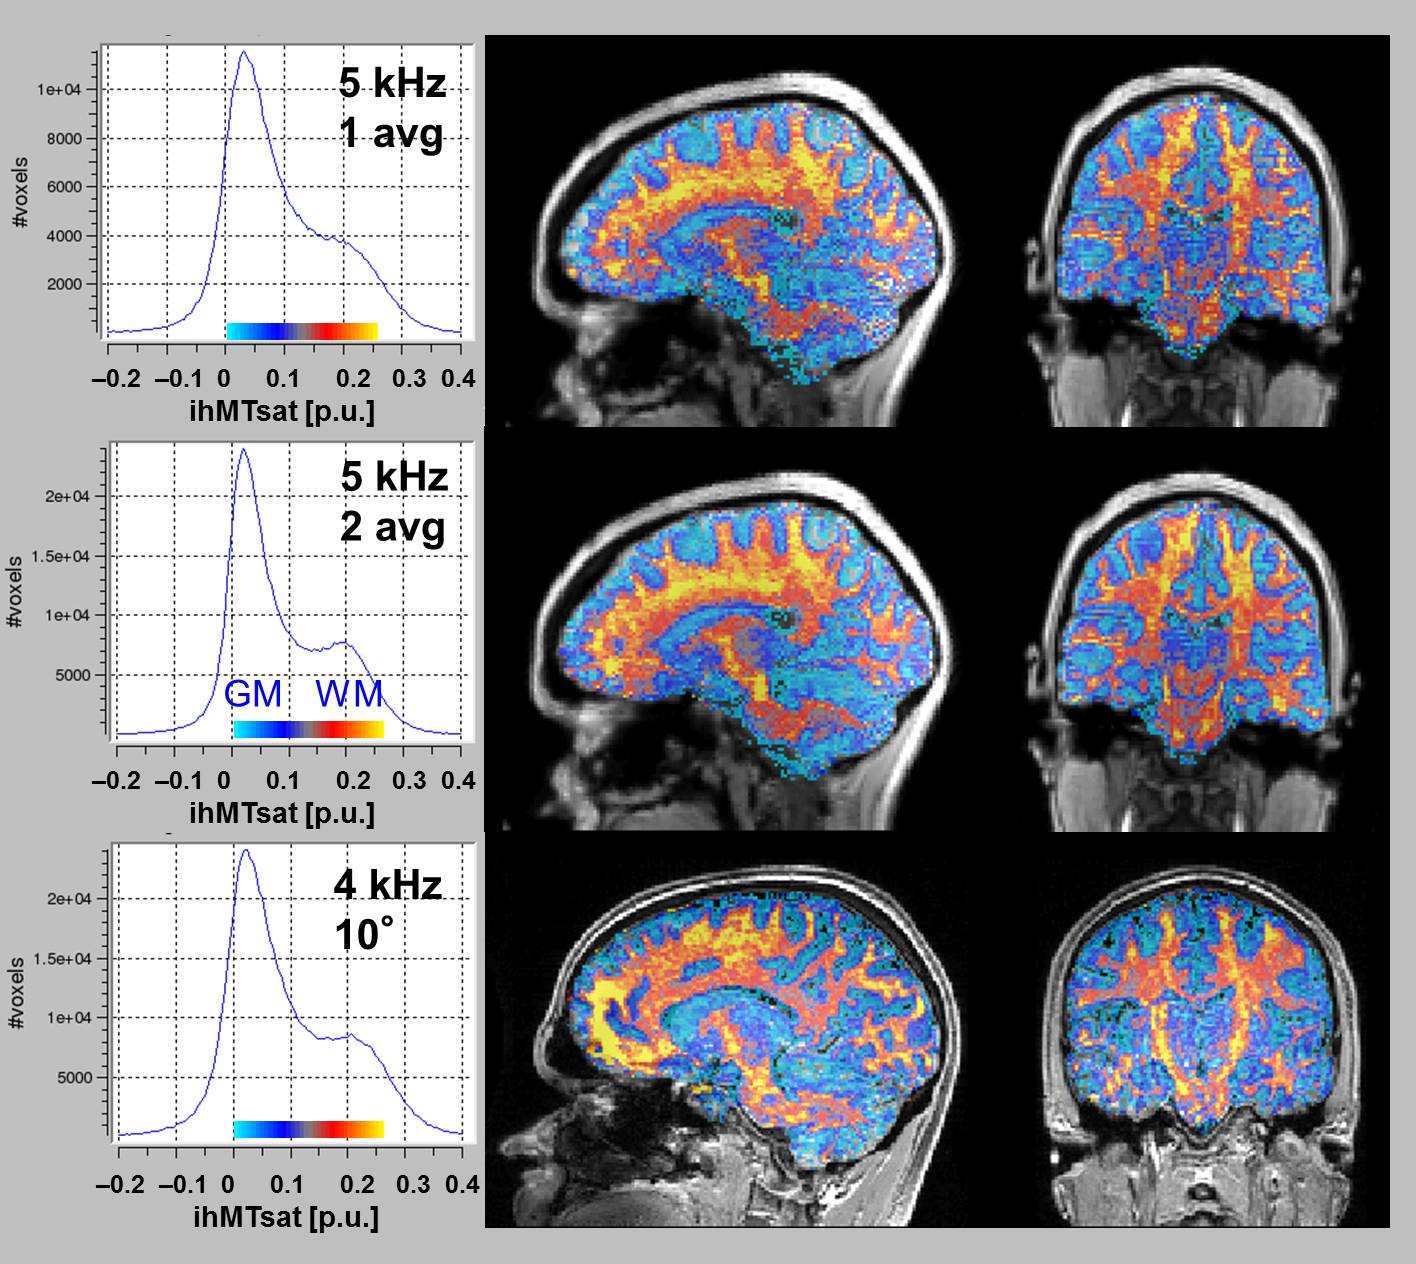
Figure 3: Increasing the SNR of ihMTsat maps.
Top row: ihMTsat calculated from averaged gradient echoes reveals regional differences in WM.
Middle row: These are corroborated by averaging two acquisitions with a 20-channel head coil. The histogram reveals a distinct WM mode around 0.2 p.u..
Bottom row: SNR is further improved by a 32-channel head coil, ±4kHz frequency offset and 10° readout. A distinct WM mode at slightly higher ihMTsat is seen despite minor motion artifacts.