1838
New method of estimating static field inhomogeneity for MR susceptometry-based oximetry1Department of Radiology, University of Pennsylvania, Philadelphia, PA, United States
Synopsis
Large vein blood oxygenation level can be estimated by magnetic susceptibility-based oximetry. Calculation of the local field shift between intravascular blood and surrounding tissue using measurement of signal phase is done with field mapping. Measurement is confounded by background static field inhomogeneity. Correction by either high-pass filtering to remove spatially slow-varying inhomogeneity, or polynomial fitting of inhomogeneity to be subtracted-out require measuring reference tissue phase, imparting bias and constraining signal-to-noise ratio considerations to tissue, not lumen. An objective approach based on inhomogeneity estimation using a smoothness criterion is proposed. Tissue phase is eliminated, allowing measurement of intravascular phase alone.
Introduction
Magnetic resonance (MR) susceptometry provides rapid quantification of venous oxygen saturation (SvO2) (1,2), a key physiological parameter. The magnetic susceptibility difference (Δχ) between blood and tissue varies linearly with SvO2 and hematocrit (Hct) (3),$$∆χ=Hct∙∆χ_0∙(1-SvO_2)\hspace{2.54cm}(1)$$
Δχ0 is the susceptibility difference between fully deoxygenated and fully oxygenated erythrocytes. Experimentally, Δχ is determined from the local field shift (ΔB) between blood, containing paramagnetic deoxyhemoglobin within erythrocytes, and the surrounding diamagnetic tissue. For a large vein tilted by angle θ to the main field (B0),
$$∆B=\frac{2π}{3} B_0 ∆χ∙(3cos^2 θ-1)\hspace{2.54cm}(2)$$
ΔB is obtained from a multi-echo gradient-recalled echo (mGRE) pulse sequence by computing the phase difference (Δφmap) between two echoes separated by ΔTE,
$$∆φ_{map}=γ∆B∆TE\hspace{2.54cm}(3)$$
The proton gyromagnetic ratio is γ. SvO2 is derived, where Δφ is measured in Δφmap as the absolute difference between averages of intravascular phase and that of surrounding tissue (Δφ = |Δφvessel - Δφtissue|).
$$SvO_2=\left[1-\frac{2∆φ/∆TE}{γ∆χ_{do} Hct∙B_0 (cos^2 θ-\frac{1}{3})}\right]×100\hspace{2.54cm}(4)$$
The superior sagittal sinus (SSS) is ideal for quantifying SvO2 in the brain, but static field inhomogeneity needs to be removed before extracting Δφ. An efficient and rapid approach to retrospective correction is to perform a weighted least-squares fit of the magnetic field distribution within the brain parenchyma to a second-order polynomial, with interpolation to estimate the inhomogeneity across a vessel, since field inhomogeneity is characterized by a low spatial frequency across the field-of-view (FOV) (4). The primary limitations are that precision is limited by the signal-to-noise ratio (SNR) of the brain tissue signal instead of blood and defining a region-of-interest (ROI) used to measure Δφtissue is subjective.
Ideally, background-field correction would leave zero average Δφtissue because it serves as a reference. We propose a method for removal of background field inhomogeneity that accomplishes this, based on two assumptions: (1) the static field varies smoothly over the FOV; (2) perfect field homogeneity results in zero average Δφtissue in regions like those surrounding the SSS. Estimation of the background field inhomogeneity contribution to intravascular phase (Δφinhomo) requires that assumption (1) be satisfied across the vessel ROI, while assumption (2) implies that the tissue field in Δφmap is due only to background field inhomogeneity. A corrected map is generated by subtraction (Δφcor = Δφmap - Δφinhomo).
Methods
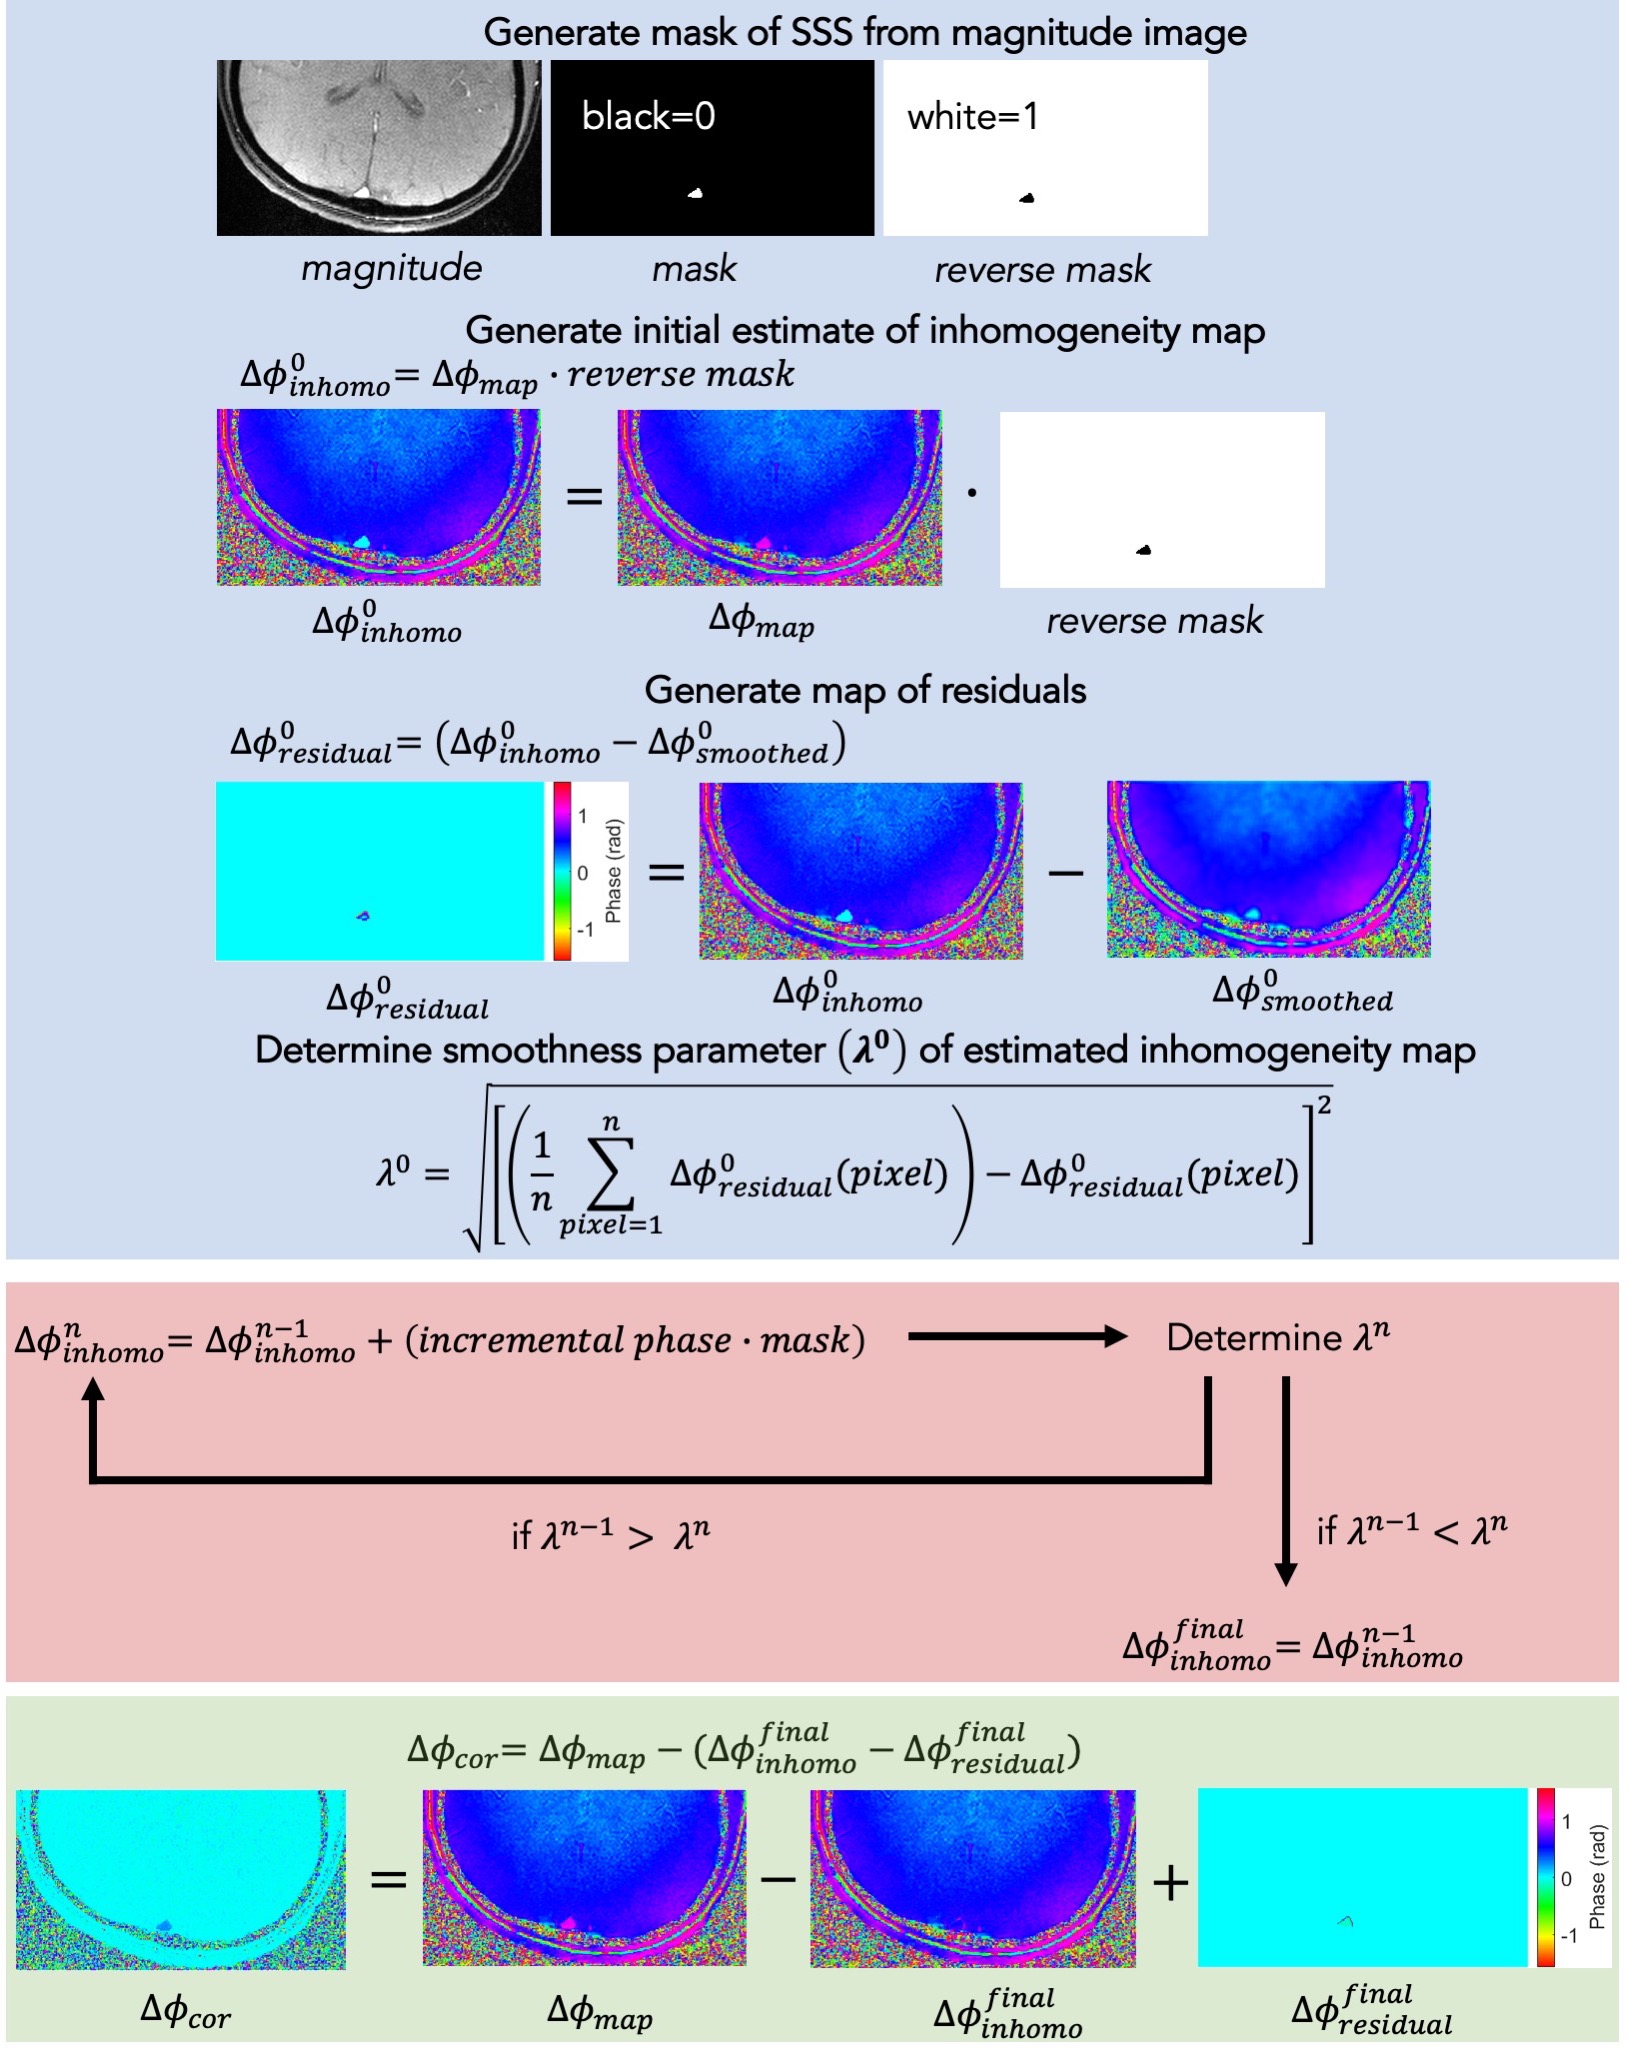
Field maps were acquired from five healthy volunteers using data from a dual-band OxFlow experiment (5) at 3 T. Two sets of Δφcor were generated: one by weighted least-squares fit as described by Langham et al. (4), and another by the smoothness-optimization for estimation of background field inhomogeneity, described here. The algorithm was implemented in MATLAB (The MathWorks, Inc., Natick, MA, USA) and outlined in Figure 1. A binary pixel mask is generated for the SSS. An initial estimate of the background field inhomogeneity map ($$$Δφ_{inhomo}^0$$$) is set to Δφmap, with masked pixels zeroed. The initial $$$Δφ_{inhomo}^0$$$ is smoothed using a Wiener filter ($$$Δφ_{smoothed}^0$$$), and a convergence metric (λ0) computed as the root-mean-square deviation (rmsd) of the pixelwise differences between $$$Δφ_{inhomo}^0$$$ and $$$Δφ_{smoothed}^0$$$, yielding a residual phase map ($$$Δφ_{residual}^0$$$). An incremental phase offset is iteratively added to masked pixels in $$$Δφ_{inhomo}^0$$$, yielding an intermediate map ($$$Δφ_{inhomo}^n$$$, n corresponding to iteration number), the Wiener filter reapplied ($$$Δφ_{smoothed}^n$$$), and λn of $$$Δφ_{residual}^n$$$ recalculated, until minimized. The residual phase distribution from the final subtraction ($$$Δφ_{residual}^{final}$$$ = $$$Δφ_{inhomo}^{final}$$$ - $$$Δφ_{smoothed}^{final}$$$) is not due to background field inhomogeneity, but the source requires further investigation. The corrected map is calculated as Δφcor = Δφmap – ($$$Δφ_{inhomo}^{final}$$$ - $$$Δφ_{residual}^{final}$$$). It was empirically determined that subtraction of the final residual map results in optimal λfinal.Results
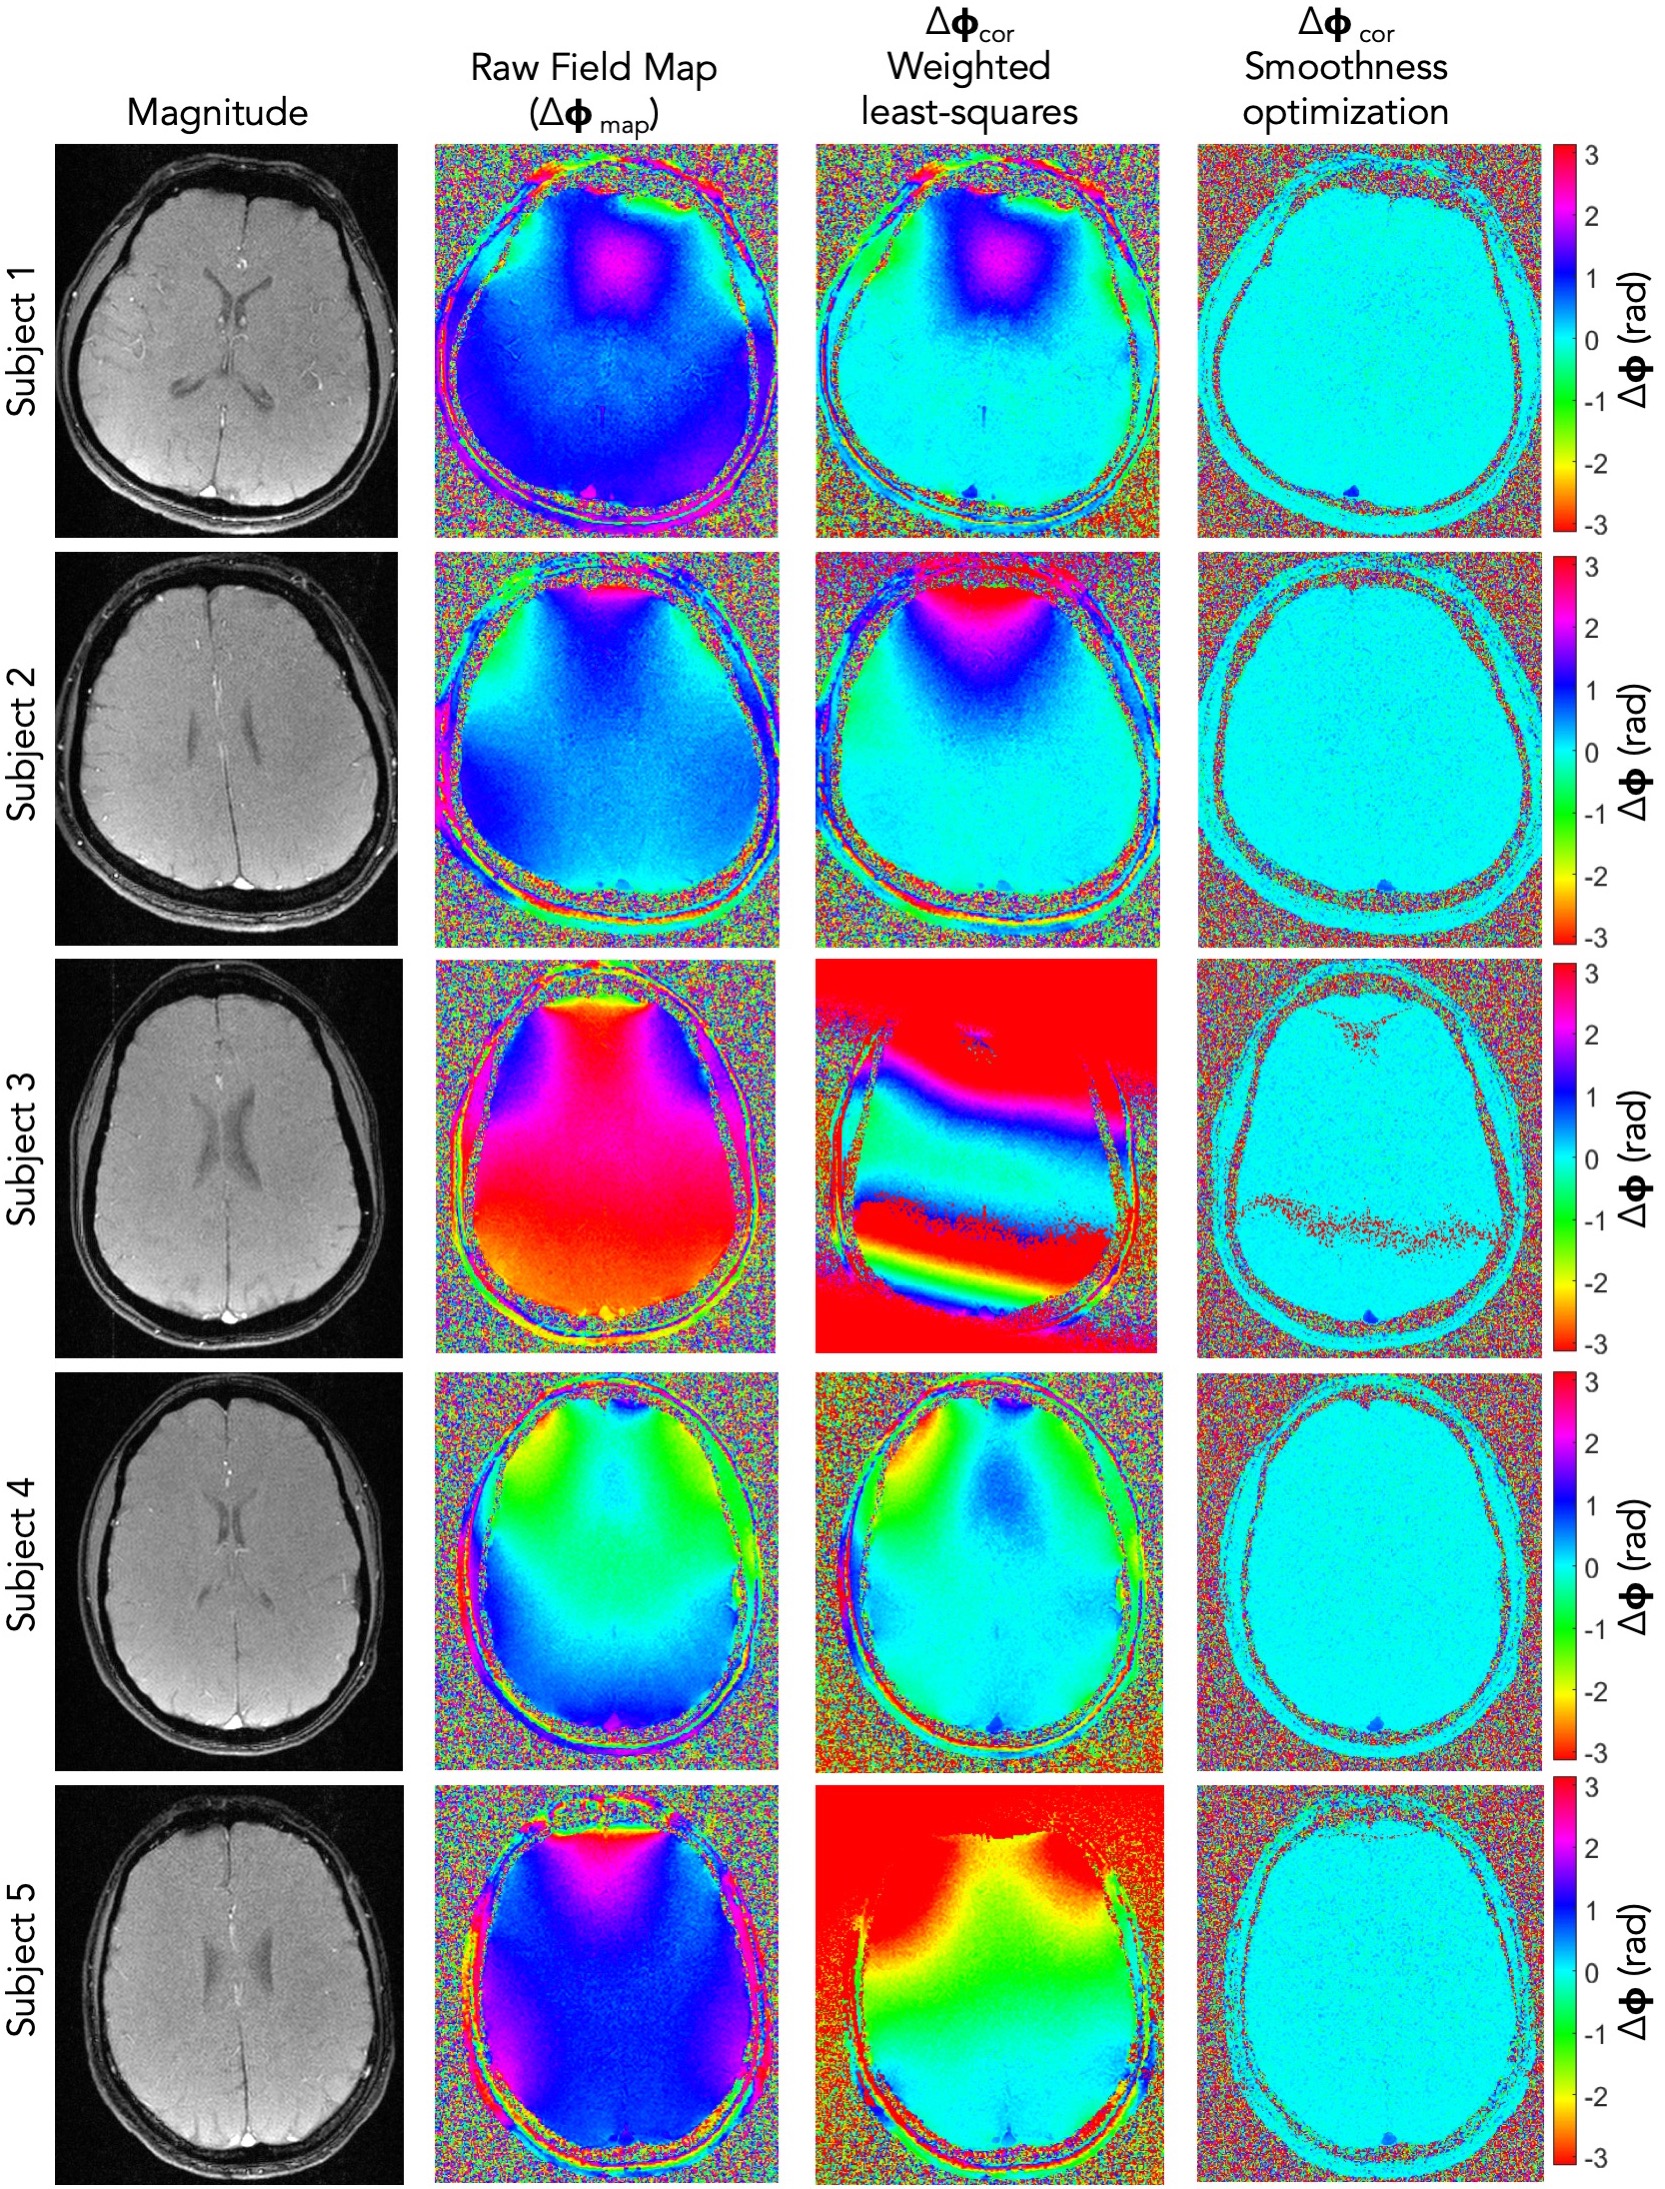
Figure 2 shows a comparison between field maps corrected by each method. SvO2 was computed for each case and reported as the mean ± one standard deviation for six repetitions from one scan. The SvO2 for subject 1 was comparable between the two methods (67 ± 2% vs. 66 ± 1%). The SvO2 for subject 2 was non-physiological when correction was done by weighted least-squares fit (88 ± 2%) but within normal range when done by smoothness-optimization (70 ± 2%). The field map for subject 3 exhibited phase-wrapping, so weighted least-squares fit failed, but smoothness-optimization led to a reasonable value (66 ± 1%). The agreement was excellent for subject 4 (67 ± 1% vs. 67 ± 1%). Subject 5 also had a non-physiological measurement by weighted least-squares fit correction (85 ± 1%) but a reasonable value by the new method (74 ± 2%).Discussion and Conclusion
SvO2 measurement by susceptometry-based oximetry provides high temporal resolution but requires correction for background field inhomogeneity. The weighted least-squares fit (4) requires measurement of Δφtissue, adding subjectivity and limiting measurement precision. The smoothness-optimization uses an objective parameter λ to determine goodness-of-fit, and does not require measurement of Δφtissue, theoretically enhancing precision since lumen SNR is higher. Results demonstrate reasonable agreement in SvO2 measured by the two methods for two data sets, and a significant improvement for the other three when using the new method. Future work will focus on validating the new method on a susceptibility phantom, as well as on a larger subject cohort. Robustness of the new method to severe inhomogeneity prevalent at longer ΔTE and higher B0 will also be evaluated.Acknowledgements
This work is supported by the National Institutes of Health (NIH) under award number T32EB020087.References
1. Haacke EM, Lai S, Reichenbach JR, et al. In vivo measurement of blood oxygen saturation using magnetic resonance imaging: A direct validation of the blood oxygen level-dependent concept in functional brain imaging. Hum. Brain Mapp. 1997;5:341–346 doi: 10.1002/(SICI)1097-0193(1997)5:5<341::AID-HBM2>3.0.CO;2-3.
2. Fernández-Seara MA, Techawiboonwong A, Detre JA, Wehrli FW. MR susceptometry for measuring global brain oxygen extraction. Magn. Reson. Med. 2006;55:967–973 doi: 10.1002/mrm.20892.
3. Spees WM, Yablonskiy DA, Oswood MC, Ackerman JJH. Water proton MR properties of human blood at 1.5 Tesla: Magnetic susceptibility, T1, T2*, T2, and non-Lorentzian signal behavior. Magn. Reson. Med. 2001;45:533–542 doi: 10.1002/mrm.1072.
4. Langham MC, Magland JF, Floyd TF, Wehrli FW. Retrospective correction for induced magnetic field inhomogeneity in measurements of large-vessel hemoglobin oxygen saturation by MR susceptometry. Magn. Reson. Med. 2009;61:626–633 doi: 10.1002/mrm.21499.
5. Lee H, Langham MC, Rodriguez-Soto AE, Wehrli FW. Multiplexed MRI methods for rapid estimation of global cerebral metabolic rate of oxygen consumption. Neuroimage 2017;149:393–403 doi: 10.1016/j.neuroimage.2017.02.011.
Figures