1835
Software for T1ρ Mapping in the Knee: Addressing the Critical Role of Motion Correction1Department of Radiology, New York University School of Medicine, New York, NY, United States
Synopsis
T1ρ mapping enables detecting early changes in the knee cartilage associated with osteoarthritis. Reproducible T1ρ measurements are challenging because of the motion artifacts arising from a long acquisition time of images at multiple spin-lock times. We implemented a new elastic motion correction method and applied it to T1ρ-weighted acquisitions in 20 subjects with normal knees and early osteoarthritis. The T1ρ voxel maps in articular cartilage generated from motion-corrected images showed significantly lower variability compared to maps derived from uncorrected images. The finding underscores the importance of motion correction in T1ρ mapping of the knee.
Introduction
It is well recognized that quantification of T1ρ relaxation times of articular knee cartilage enables early assessment of osteoarthritis (OA). The biochemical changes due to OA reflect greater mobility of water that results in prolonged T1ρ.1,2 Precise and reproducible measurements of T1ρ are needed for detection, prevention, and monitoring treatment of OA. However, reliable T1ρ mapping is challenging. The long acquisition time required to collect high-resolution 3D data at several spin-lock times (TSLs) makes these images prone to motion artifacts. Motion is particularly important for the articular cartilage, because of its complex shape and thickness of only a few millimeters. Furthermore, the lack of TSL encoding in the DICOM standard impedes the incorporation of T1ρ analysis into common image processing software in an automated manner for fast and efficient voxel-based fitting. As a result of these challenges, there is no accepted processing workflow and different groups apply diverse methods.Methods
This retrospective study was approved by the institutional review board. Consecutive subjects (n=20; 11 women and 9 men; age range, 46-73 years, mean±stdev=59.9±7.7 years) with normal knees to early OA (Kellgren-Lawrence (KL) grades KL0 (“none”, n=10) and KL1-2 (“doubtful-minimal”, n=10) who underwent knee MRI with T1ρ-mapping between April 2019 and February 2020 were selected. Within each subgroup, the subject characteristics were as follows: patients (n=10; 4 men and 6 women; age range, 46-69 years, mean±stdev = 60.9±7.2 years) and controls (n=10; 5 men and 5 women; age range, 47-73 years age, mean±stdev =58.9±8.5 years).T1ρ MRI was performed at 3T (Siemens MAGNETOM Prisma) with a 15-channel Tx/Rx knee coil using a spin-lock-based 3D GRE sequence. The acquisition parameters were as follows: sagittal orientation, GRASP parallel imaging, TR/TE=5 ms/2 ms, flip angle 12 deg, pixel bandwidth 450 Hz/pixel, matrix 128x128, 36-64 slices; in-plane resolution 1.02-1.25 mm; 2.0 mm slice thickness; FOV 130-160 mm; 9 spin-lock times (TSLs): 2, 4, 6, 8, 10, 15, 25, 35, 50 ms (except one patient and one control image set acquired with 8 TSLs); total acquisition time, 20 min 50 s.
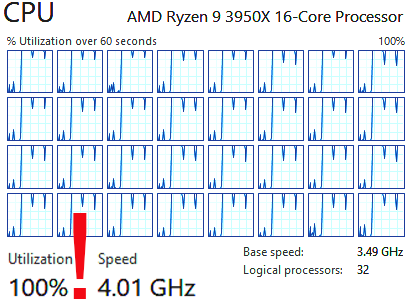
Image analysis was performed in freely available FireVoxel software (The Bernard and Irene Schwartz Center for Biomedical Imaging, NYU School of Medicine, firevoxel.org). Images were coregistered for motion on a workstation with a 16-core 3.5GHz CPU (AMD Ryzen 9 3950X). For all subjects, motion correction was performed using a newly developed elastic registration method based on keypoint matching with discrete optimization.3 The original method was expanded to include the local cross-correlation measure. The final field calculation was done using Gaussian radial basis functions.4 For each subject, volumes with TSL=4-50 ms were coregistered to the first volume (TSL=2 ms). Segmentation of the femoral cartilage was performed on TSL=2 ms volume using a combination of thresholding and morphology operations.
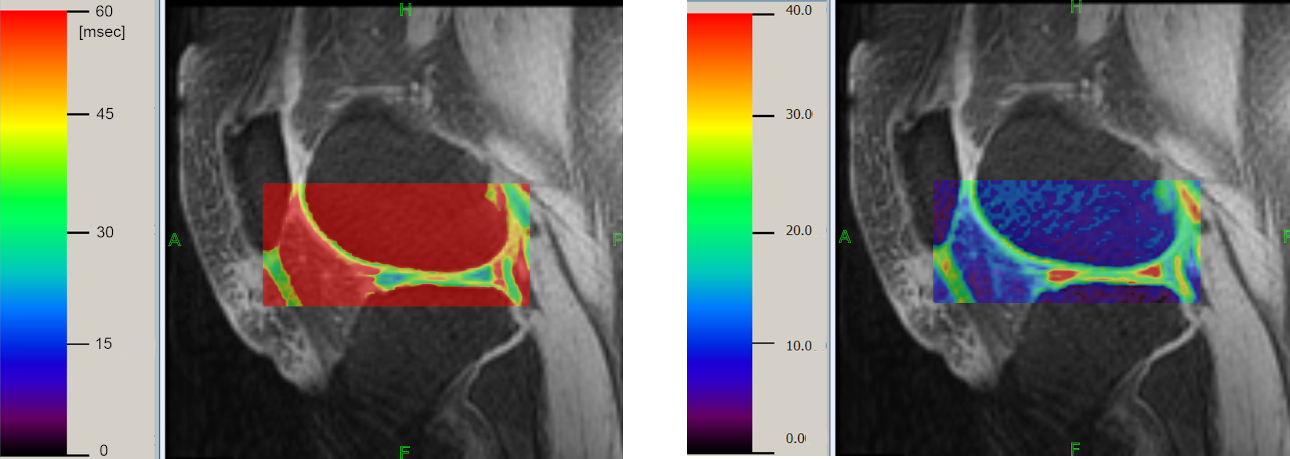
In all subjects, T1ρ and R1ρ voxel maps were generated from motion-corrected (MC) images. The maps were computed within a rectangular region enclosing distal femur with the monoexponential model fitting using global optimization method.5 Segmentation masks were then applied to the maps to obtain the parameter values in the cartilage.
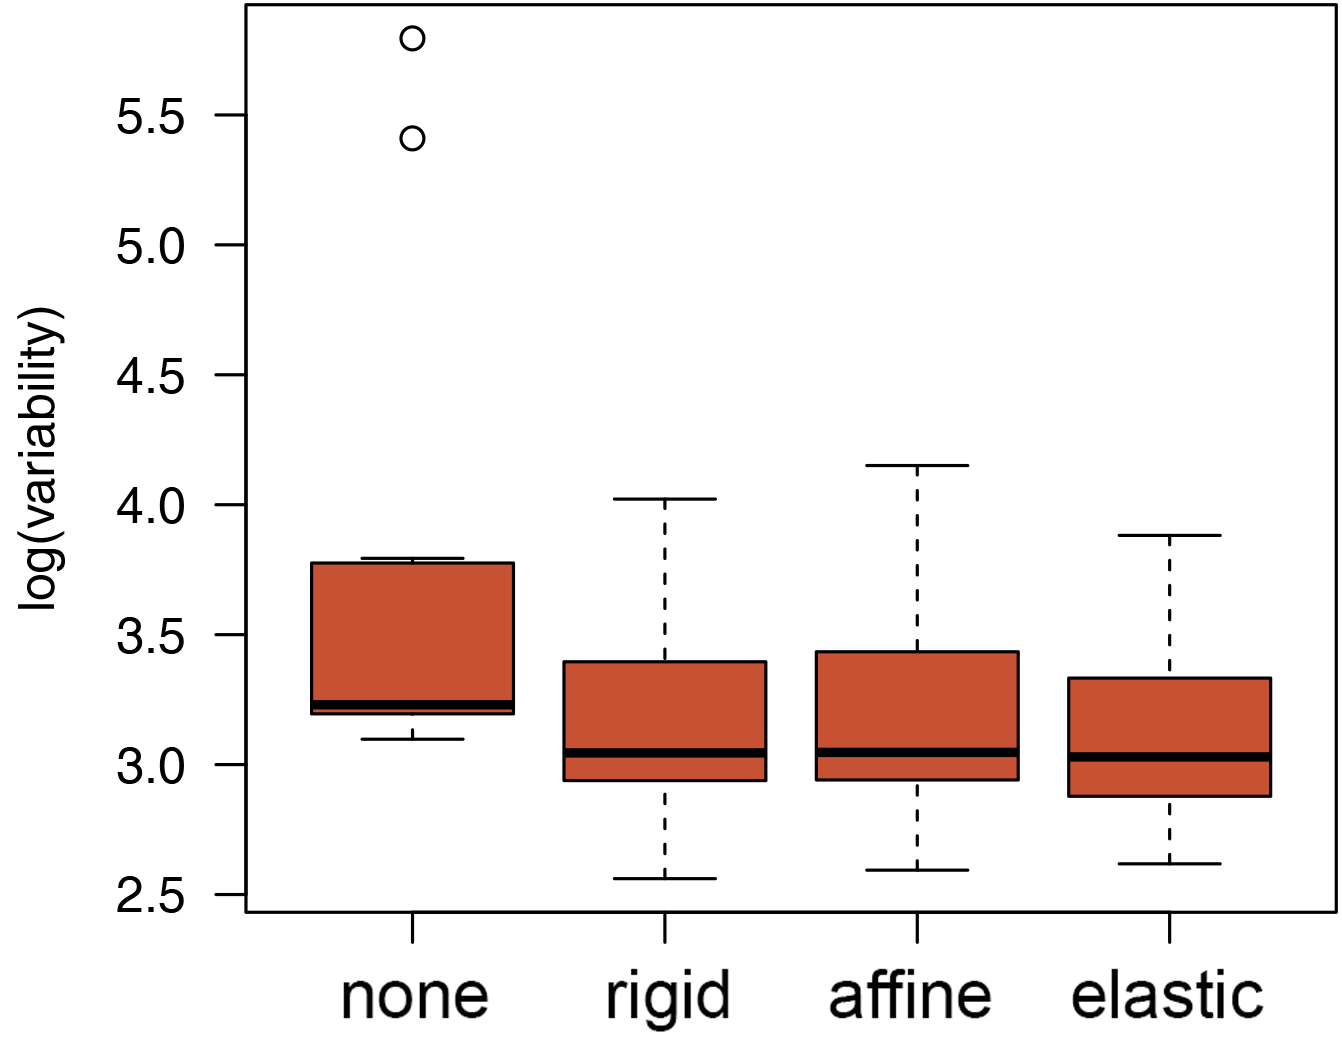
For comparison, in a subset of 11 subjects (10 controls and 1 patient), T1ρ maps were also generated from uncorrected images and images coregistered using two additional methods, rigid and affine registration models computed using mutual information similarity measure.
The distributions of T1ρ and R1ρ voxel values within the cartilage were assessed by histogram analysis to derive the mean, variance, and higher order moments. The influence of motion correction was assessed by comparing the standard deviation of the T1ρ maps in the cartilage derived from uncorrected images and MC images. The standard deviations obtained with and without motion correction were compared using two-tailed, paired t-test. The comparison between patients and controls was done using two-tailed Mann-Whitney U-test.
Results
The new elastic motion correction method maximized the utilization of the CPU power through parallel processing (Fig. 1). Each T1ρ map required <5 s per exam (Fig. 2). For all 20 subjects, the mean±stdev T1ρ was 46±5 ms and R1ρ was 22.7±3.1 s-1. These parameters were not significantly different between patients and controls (p~0.8). Motion correction reduced the standard deviation of the T1ρ maps (Fig. 3). The standard deviation of T1ρ within the cartilage region of interest decreased from 75±103 ms for uncorrected images to 24±10 ms after elastic motion correction (p=0.13). Similar trend for decreased variability was found for rigid (p=0.12) and affine (p=0.11) methods. When two cases with the largest motion artifacts were excluded, the standard deviation of T1ρ in uncorrected images dropped to 30±9 ms and the decrease in variability after motion correction became significant for all three methods (rigid: 22±7 ms, p=0.002; affine: 22±6 ms, p=0.001; elastic: 22±7 ms, p=0.001).Conclusion
Motion correction appears to be critical for accurate measurements of T1ρ in the articular cartilage of the knee. This is particularly important when the T1ρ values are used for monitoring disease progression or treatment. Motion correction can be incorporated into a semi- or fully-automatic processing workflow of the T1ρ imaging.Acknowledgements
NIH/NIBIB U24 EB028980References
1. Regatte RR, Akella SV, Lonner JH, Kneeland JB, Reddy R. T1rho relaxation mapping in human osteoarthritis (OA) cartilage: comparison of T1rho with T2. J Magn Reson Imaging. 2006;23(4):547-53.
2. Wang L, Chang G, Bencardino J, Babb JS, Krasnokutsky S, Abramson S, Regatte RR. T1rho MRI of menisci in patients with osteoarthritis at 3 Tesla: a preliminary study. J Magn Reson Imaging. 2014;40(3):588-95.
3. Heinrich MP, Handels H, Simpson IJA. Estimating Large Lung Motion in COPD Patients by Symmetric Regularised Correspondence Fields. In: Medical Image Computing and Computer-Assisted Intervention -- MICCAI 2015. Pp 338-345.
4. Shusharina N, Sharp G. Image registration using radial basis functions with adaptive radius. Med Phys. 2012; 39(11): 6542–6549.
5. Hansen ER. Global Optimization Using Interval Analysis. Marcel Dekker, New York (1992).
Figures