1834
Development of a simulation method to evaluate T2* shortening due to susceptibility of fat in the liver using the finite element method1Department of Radiology, University of Yamanashi, Chuo, Japan, 2MRIsimulations Inc., Tokyo, Japan, 3Department of Radiology, Kofu-Kyoritsu Hospital, Kofu, Japan
Synopsis
A method to simulate T2* shortening by the susceptibility of fat in the liver using FEM and simple modeling was developed. The model consisting of water and lipid droplets (LD) placed randomly. Simulation and in vivo studies indicated the feasibility of our method. The results suggested the microscopic field inhomogeneity by LDs leads to non-neglectable T2* decay. Besides, the result of in vivo study was fairly agreed with the simulation.
INTRODUCTION
R2* measurement has been attracting attention as a non-invasive possible alternative to biopsy to assess iron overload in the liver. Chemical shift-encoded MRI (CSEMRI), which is often used for R2* estimation in the liver, enables fast and reliable R2* estimation along with fat quantification using spectral modeling of fat.However, several studies indicated that fat fraction is a confounding factor of R2* estimation(1) (2). Bashir et al. demonstrated retrospective analysis of NAFLD and NASH patients, which suggested a strong correlation between R2* and fat fraction(2). They also indicated the R2* estimation using CSEMRI is affected by susceptibility effects of intrahepatocellular triglycerides stored in lipid droplets (LD) rather than iron deposition in their cohort. Therefore, understanding the relationship between R2* and fat fraction could contribute to further improvement of R2*.
In this study, we developed a simulation method to evaluate fat's susceptibility effect on R2* using the finite element method (FEM) using a simple model. Simulation and in vivo studies were included.
METHODS
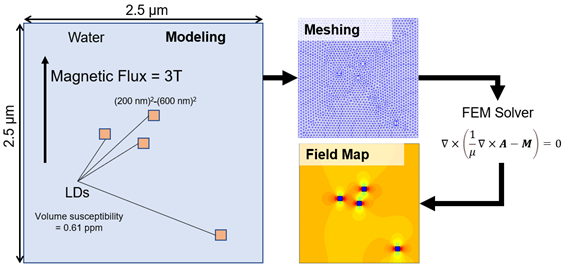
1. Calculation of microscopic field inhomogeneity using FEMA microscopic field induced by LD filled with triglycerides was calculated using FEM, as shown in Figure 1. The simple model consists of water, and small LD placed randomly was used. 1. For the simplicity of meshing processing in FEM, we assumed a rectangle shape for modeling of LD. A field distribution within the model was calculated by solving the differential equation as below.
$$\nabla \times (\frac{1}{\mu} \nabla \times \bf{A} - \bf{M}) = \bf{0},$$
where A is the magnetic vector potential, M denotes the magnetization corresponding to water and LD components. We assumed the magnetic flux density of 3.0 T and LD's magnetic susceptibility of 0.61 ppm(3). The equation was solved using MATLAB with FEATool Multiphysics. The field distribution was calculated from the solved A vector.
2. T2* decay simulation
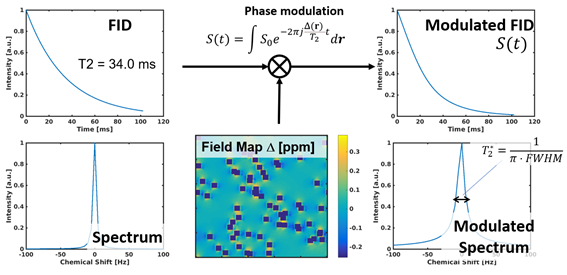
T2* decay was simulated based on water spectra (0 ppm) modulated by the calculated field distribution(4). The NMR signal can be expressed as the summation of the modulated signal within the model as below.
$$S(t) = \int S_0 e^{-2 \pi j \frac{\Delta (r)}{T_2} t} d \bf{r}$$
where S0 is the signal intensity at t = 0, Δ is the field map calculated using FEM, t is the elapsed time of the acquisition, and r is the spatial coordinate. T2 (34.0 ms (5)) of the liver was assumed in this study. T2* was calculated by obtaining full width at half maximum (FWHM) as shown in Figure 2. R2* values were simulated with varying fat fraction (0-40 %) and size of LD ((200nm)2-(600 nm)2) to analyze the relationship between R2* and fat fraction.
3. In vivo analysis
Also, retrospective analysis of R2* and PDFF using acquired patient data (from January to August 2019) was performed to compare with simulation results. Fat fraction and R2* of the right lobe of the liver were measured using acquired quantitative maps. The quantitative mapping was imaged using IDEAL-IQ (GE Healthcare) on a clinical 3T MR system (Discovery MR750, GE Healthcare). Patients with hemochromatosis were excluded from the analysis. We included 91 patients in total.
Results
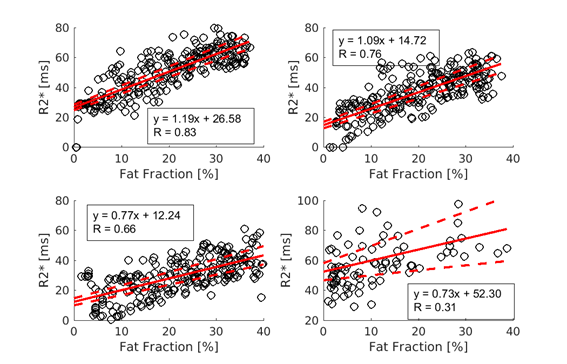
Figure 3a-c shows the relationship between fat fraction and R2* with different size of LD. The slopes of the linear regression for the plots with LD size of (200 nm)2, (400 nm)2, (600 nm)2 were 1.20 (95% CI = 1.11-1.29), 0.931 (95% CI = 0.841-1.01), and 0.761 (95% CI = 0.67-0.85) while the intercepts for them were 18.2 (95% CI = 16.3-20.1), 10.1 (95% CI = 8.20-11.9), and 5.81 (95% CI = 3.60-8.02), respectively. Moderate to strong correlations were observed in all simulations. The plots indicated the R2* increases as the fat fraction increases. LD size was also suggested to be an important factor, with small LD size inducing large R2*.Figure 3d shows the R2* plotted against fat fraction, measured from patient data retrospectively. The slopes and intercepts of the linear regression were 0.734 (95% CI = 0.330-1.14) and 52.3 (95% CI = 46.6-58.0). As in the simulation results, the plot suggested high fat fraction results in short T2* decay, although the correlation was relatively weak (R = 0.31).
Discussion
In this study, we developed a method to simulate T2* shortening by the susceptibility of fat in the liver using FEM and simple modeling, consisting of water and LDs placed randomly. The results suggested the microscopic field inhomogeneity by LD leads to non-neglectable T2* decay. Besides, the result of in vivo study was fairly agreed with the simulation.It is already known that R2* measurement is confounded by hepatic steatosis with NAFLD/NASH patients(2). In this paper, the authors insisted R2* measurement is not suitable for evaluating liver iron with the population since R2* is strongly correlated with fat fraction rather than liver iron score. The proposed simulation method may enable accurate correction of bias by fat fraction.
A major limitation of this simulation method is the lack of biological accuracy of the model used for FEM. It is required to include pathological structure to improve the results.
In conclusion, a new simulation method evaluates the effect of fat fraction on R2* using FEM. Simulation and in vivo studies indicated the feasibility of our method.
Acknowledgements
This research was partially supported by Nakatani Foundation for Advancement of Measuring Technologies in Biomedical Engineering.References
1. Chebrolu VV, Hines CD, Yu H, Pineda AR, Shimakawa A, McKenzie CA, Samsonov A, Brittain JH, Reeder SB. Independent estimation of T* 2 for water and fat for improved accuracy of fat quantification. Magnetic Resonance in Medicine: An Official Journal of the International Society for Magnetic Resonance in Medicine 2010;63(4):849-857.
2. Bashir MR, Wolfson T, Gamst AC, Fowler KJ, Ohliger M, Shah SN, Alazraki A, Trout AT, Behling C, Allende DS. Hepatic R2* is more strongly associated with proton density fat fraction than histologic liver iron scores in patients with nonalcoholic fatty liver disease. Journal of Magnetic Resonance Imaging 2019;49(5):1456-1466.
3. Ruetten PP, Cluroe AD, Usman A, Priest AN, Gillard JH, Graves MJ. Simultaneous MRI water‐fat separation and quantitative susceptibility mapping of carotid artery plaque pre‐and post‐ultrasmall superparamagnetic iron oxide‐uptake. Magnetic Resonance in Medicine 2020;84(2):686-697.
4. Kose R, Kose K, Terada Y, Tamada D, Motosugi U. Development of a method for the Bloch image simulation of biological tissues. Magnetic Resonance Imaging 2020;74:250-257.
5. De Bazelaire CM, Duhamel GD, Rofsky NM, Alsop DC. MR imaging relaxation times of abdominal and pelvic tissues measured in vivo at 3.0 T: preliminary results. Radiology 2004;230(3):652-659.
Figures