1833
Improvements from local B0 shimming for QSM at 7 Tesla1Division of Medical Physics in Radiology, German Cancer Research Center (DKFZ), Heidelberg, Germany, 2Faculty of Physics and Astronomy, Faculty of Medicine, University of Heidelberg, Heidelberg, Germany, 3MR Shim GmbH, Reutlingen, Germany
Synopsis
A 14-channel local array of shim coils was used to improve B0 homogeneity and reduce artifacts in quantitative susceptibility mapping at 7T. Using the local array of shim coils in addition to the standard 2nd order spherical harmonic shims, the B0 shim quality was improved by an average of 16% across all volunteers. Local inhomogeneities were significantly reduced and could be correlated to reduced artifacts in QSM.
Introduction
Quantitative susceptibility mapping strongly benefits form ultra-high field MRI due to the higher available signal-to-noise ratio allowing for higher resolutions and the larger phase effects providing better contrast-to-noise ratios1. However, also local B0 field inhomogeneities can become too steep to be accounted for during pre-processing of the used gradient echo phase data leading to artifacts in susceptibility maps. Arrays of small local shim coils have been used in multiple MRI applications to reduce B0 inhomogeneity, since they provide more flexibility over spherical harmonics2,3. As of yet, to the best of our knowledge, this method has not been used in QSM. Therefore, in this study, we investigate improving the B0 shim quality for brain QSM at 7T using a 14-channel local array of shim coils.Methods
Data acquisitionData were acquired in accordance with the Declaration of Helsinki from three healthy volunteers (mean age 28.0±7.5 years, one female) who provided written informed consent at a 7 Tesla whole-body system (Magnetom 7 Tesla, Siemens Healthineers) with a 8Tx/32Rx-channel head coil (Nova Medical Inc., Wakefield, MA, USA) using an in-house-constructed butler matrix.
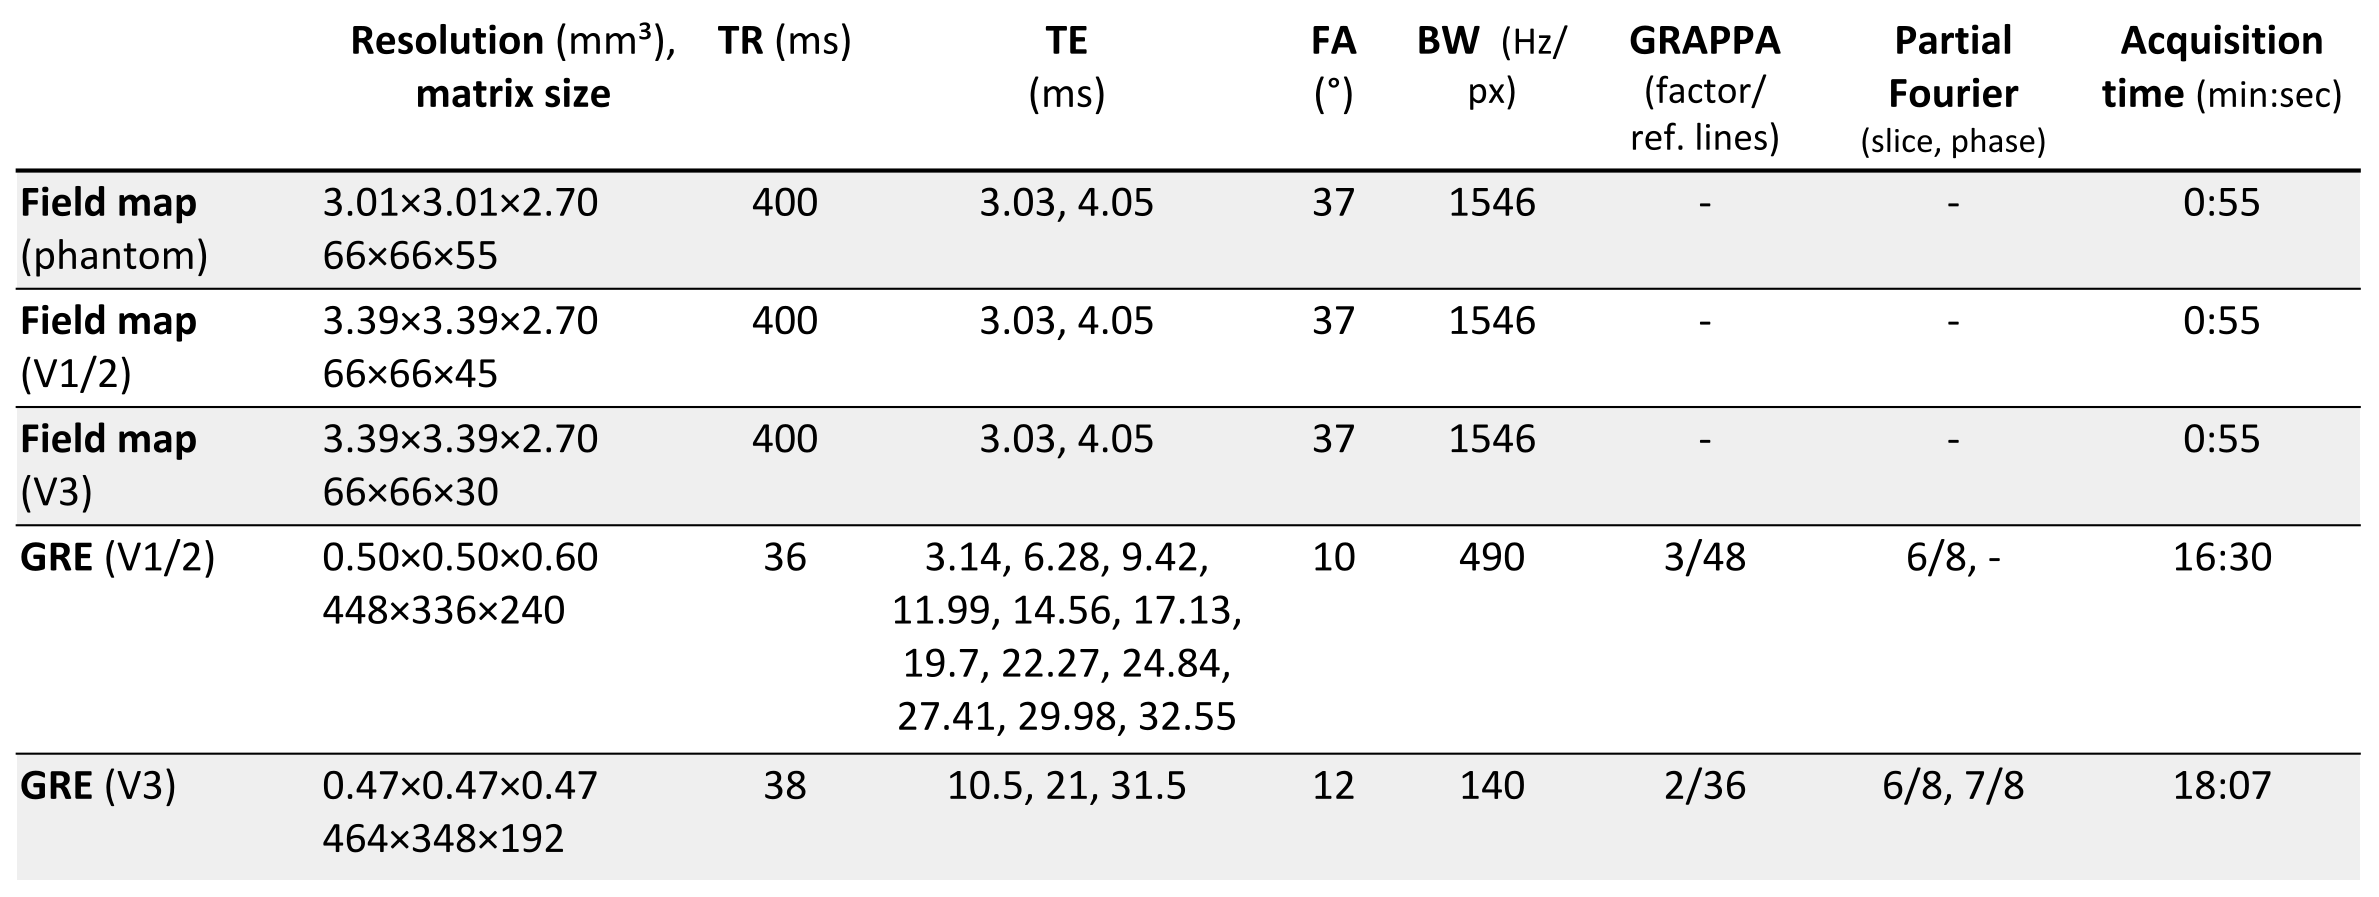
B0 shimming with a local array of shim coils was performed using the system provided by MR Shim GmbH (Reutlingen, Germany) which included: 14 channel local array of shim coils (Elara) driven by shim amplifiers (Jupiter) with maximum currents of +/- 2.5 A per channel connected directly to the control PC over Ethernet. Reference field maps for each shim channel were acquired on a standard Siemens phantom by applying 1.5A to each coil and acquiring a 2D dual-echo gradient echo (GRE) B0 field map (sequence parameters Table 1).
For QSM, three-dimensional multi-echo GRE sequences were acquired with the sequence parameters given in Table 1 using two different shim settings: 1) with 2nd order scanner-only B0 shimming, and 2) with 2nd order and local shim coil B0 shimming.
Data processing and evaluation
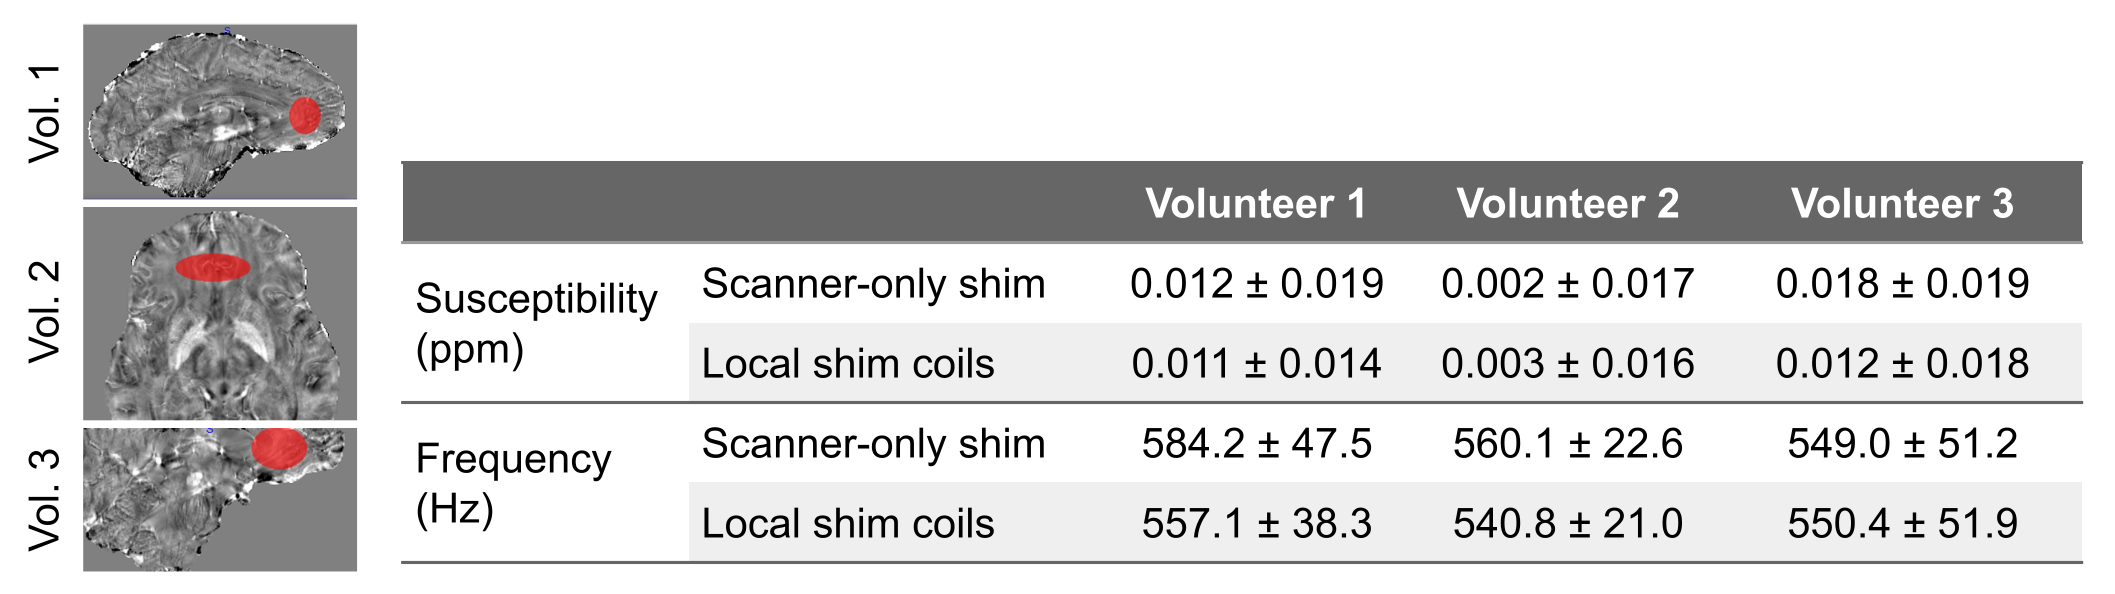
Single-channel data were combined on the scanner using the computationally efficient combination of multi-channel phase data from multi-echo acquisitions (ASPIRE)4, and each echo was unwrapped with Laplacian-based phase unwrapping5-7. For background field removal a brain mask was generated with FSL Brain Extraction Tool8 on each echo of the gradient echo data. Background field removal was performed with the variable-kernel sophisticated harmonic artifact reduction for phase data (V-SHARP)6,7 method with kernel size up to 12 mm, and all echoes were averaged9. The susceptibility maps were calculated from local phase data using the streaking artifact reduction for QSM (STAR-QSM) algorithm10. As subjects had moved between measurements, data was registered to the scan for which the local shimming was performed using FSL-FLIRT11. A small region of interest, in which artifacts were visible in QSM, was drawn for each volunteer using Medical Imaging Interaction Toolkit (MITK)12,13 and mean as well as standard deviations were calculated.
Results
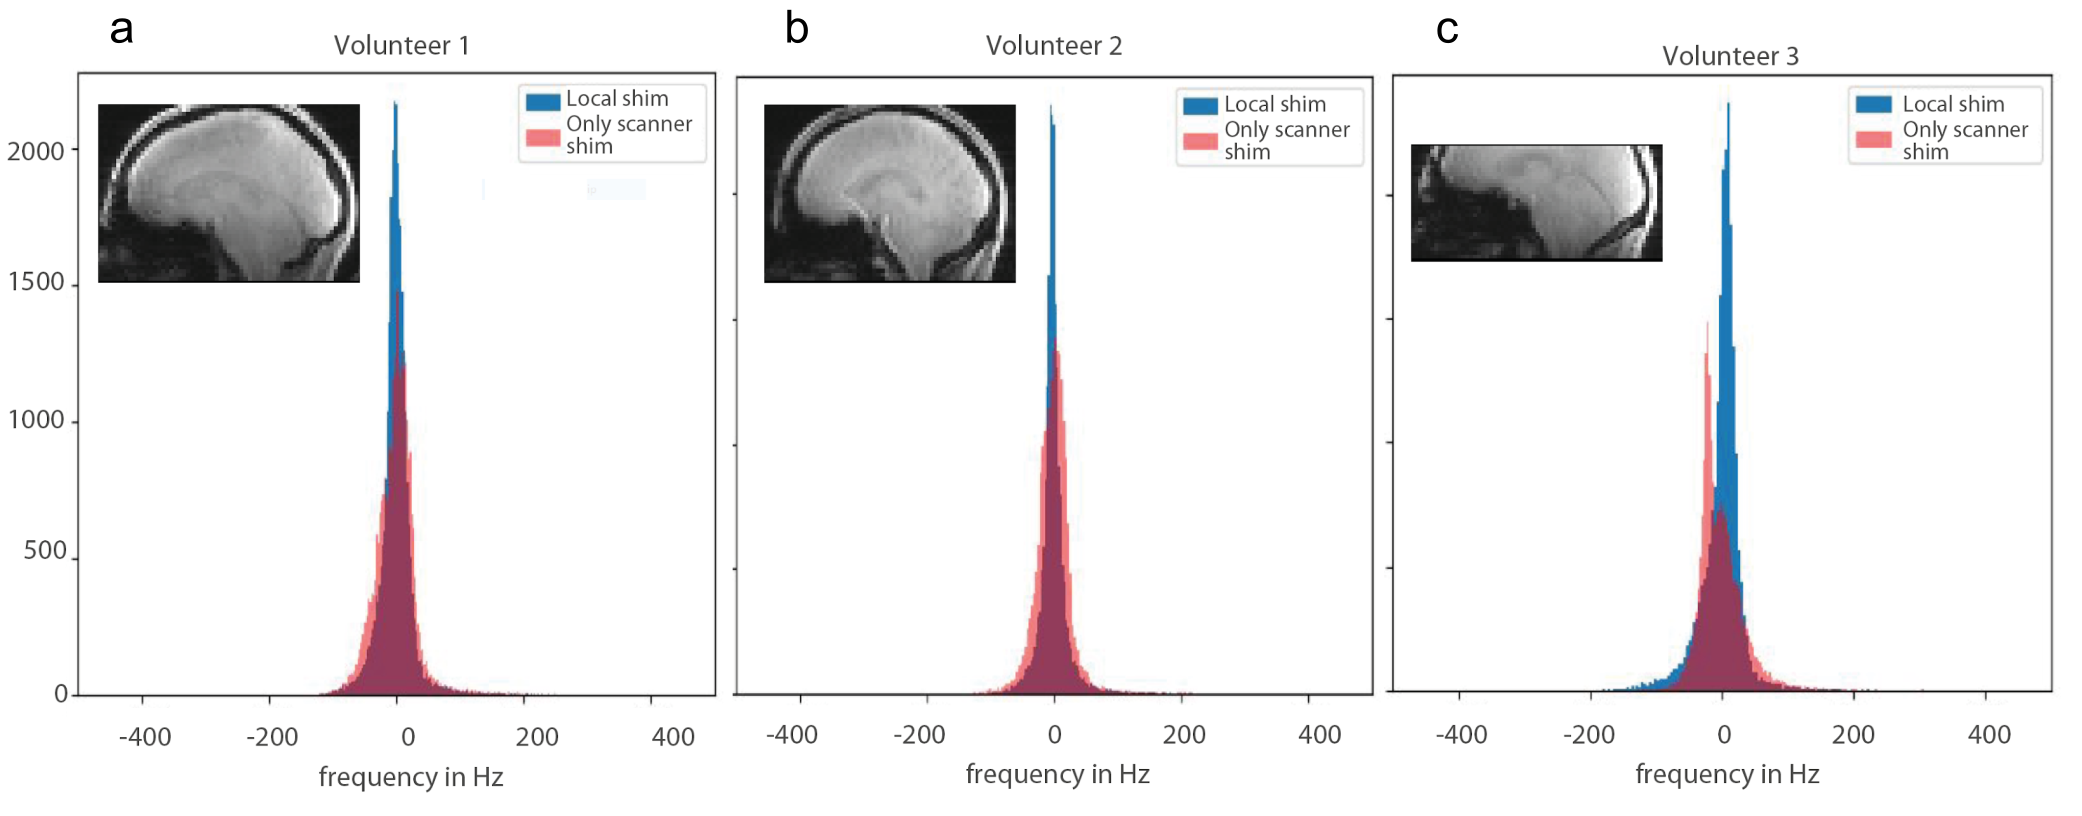
The RMS of the shim currents for the local shim coils were: 1.1A, 1.25A and 1.7A, for Subjects 1, 2 and 3, respectively. The standard deviation of the frequency shifts was 36.65 Hz/ 29.59 Hz for scanner shim only/ for local shimming for Subject 1, 33.82 Hz/ 27.51 Hz for Subject 2, and 40.55 Hz/ 36.50 Hz, respectively for Subject 3.Figure 1 shows that for all volunteers, histograms of the frequency are broader for the scanner-only shim compared to when the local B0 shimming was used.
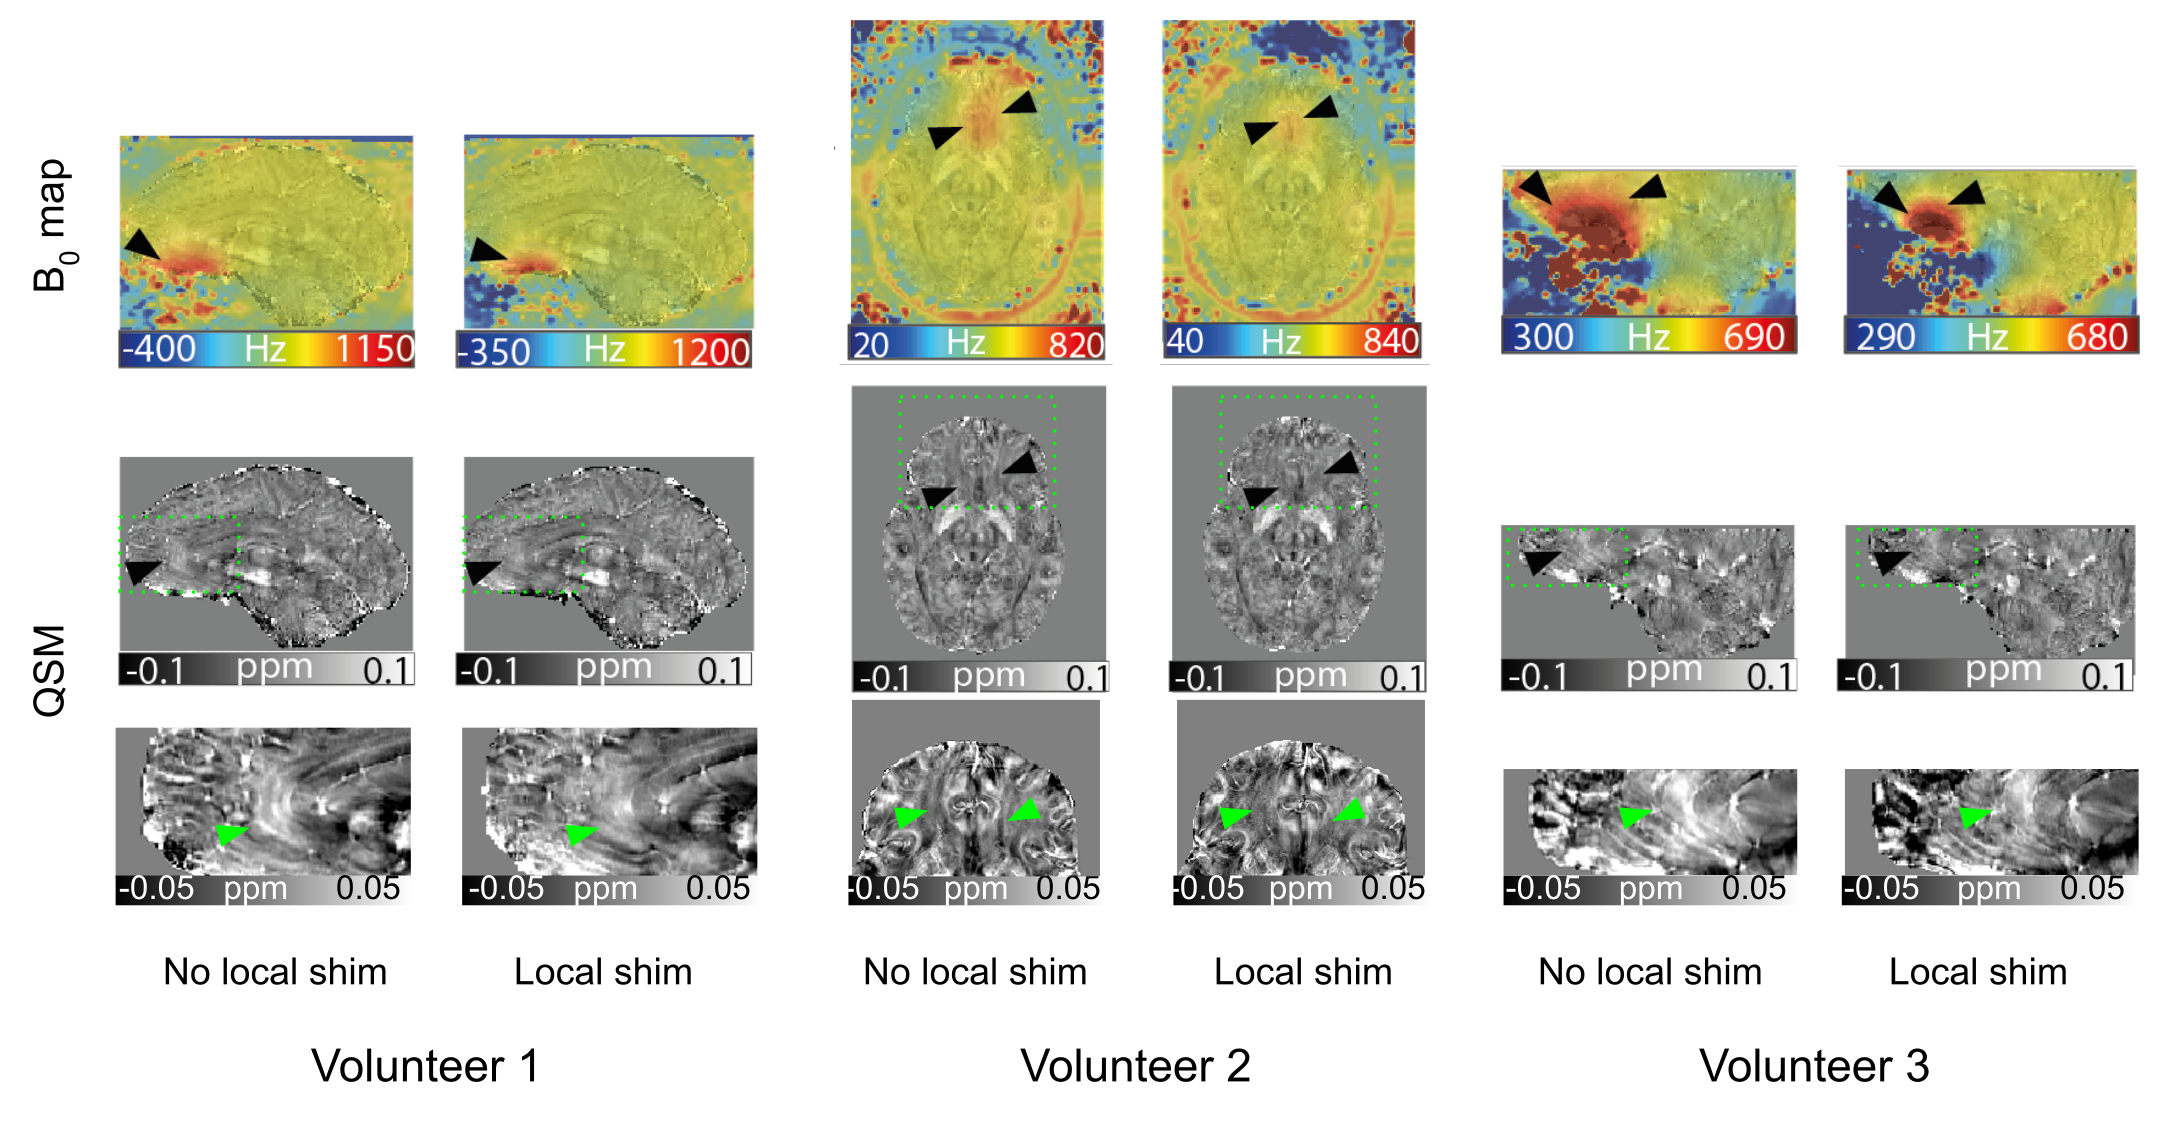
In Figure 2, representative sagittal (Volunteers 1 and 3)/ axial (Volunteer 2) slices of susceptibility maps as well as field map/ susceptibility map overlays are shown. Strong field inhomogeneities can be observed above the sphenoidal sinus (arrow heads) which are mitigated by the applied local shim. For Volunteer 3, for which a smaller slab was acquired, inhomogeneities are more severe. In QSM, artifacts (arrow heads) in the vicinity of these local field inhomogeneities can be observed such as artificially bright regions. This is also depicted in the quantitative results provided in Table 2, e.g. standard deviation of susceptibility values in the depicted region decreases as well as in Volunteer 3, the susceptibility itself is 33% lower.
Discussion
It has been shown that some of the most severe artifacts regularly observed in QSM can be mitigated with improved B0 shimming using a local array of shim coils. In future, it should be highly beneficial to not only use static local shimming but dynamic shimming. Real-time shimming has already been shown to compensate for respiration induced B0 fluctuations and to improve the image quality of gradient echo data14.Acknowledgements
Authors Sahar Nassirpour and Paul Chang are employees of MR Shim GmbH.References
1. Ladd ME, Bachert P, Meyerspeer M, Moser E, Nagel AM, Norris DG, Schmitter S, Speck O, Straub S, Zaiss M. Pros and cons of ultra-high-field MRI/MRS for human application. Prog Nucl Magn Reson Spectrosc. 2018 Dec;109:1-50. doi: 10.1016/j.pnmrs.2018.06.001.
2. Aghaeifar A, Zhou J, Heule R, Tabibian B, Schölkopf B, Feng J, Zaitsev M, Scheffler K. A 32‐channel multi‐coil setup optimized for human brain shimming at 9.4T. Magn. Reson. in Med. 2019. doi:10.1002/mrm.27929.
3. Juchem C, de Graaf RA. B0 magnetic field homogeneity and shimming for in vivo magnetic resonance spectroscopy. Analytical Biochemistry. 2016 Jun; 529:17-29. doi:10.1016/j.ab.2016.06.003
4. Eckstein K, Dymerska B, Bachrata B, Bogner W, Poljanc K, Trattnig S, et al. Computationally Efficient Combination of Multi-channel Phase Data From Multi-echo Acquisitions (ASPIRE). Magnet Reson Med. 2018;79(6):2996-3006.
5. Li W, Wu B, Liu CL. Quantitative susceptibility mapping of human brain reflects spatial variation in tissue composition. Neuroimage. 2011;55(4):1645-56.
6. Li W, Avram AV, Wu B, Xiao X, Liu CL. Integrated Laplacian-based phase unwrapping and background phase removal for quantitative susceptibility mapping. Nmr Biomed. 2014;27(2):219-27.
7. Wu B, Li W, Guidon A, Liu CL. Whole brain susceptibility mapping using compressed sensing. Magnet Reson Med. 2012;67(1):137-47.
8. Smith SM. Fast robust automated brain extraction. Hum Brain Mapp. 2002;17(3):143-55.
9. Wu B, Li W, Avram AV, Gho SM, Liu C. Fast and tissue-optimized mapping of magnetic susceptibility and T2* with multi-echo and multi-shot spirals. Neuroimage. 2012;59(1):297-305.
10. Wei HJ, Dibb R, Zhou Y, Sun YW, Xu JR, Wang N, et al. Streaking artifact reduction for quantitative susceptibility mapping of sources with large dynamic range. Nmr Biomed. 2015;28(10):1294-303.
11. M. Jenkinson, Smith S. Medical Image Analysis 2001;5(2):143-156.
12. Maleike D, Nolden M, Meinzer HP, Wolf I. Interactive segmentation framework of the Medical Imaging Interaction Toolkit. Comput Meth Prog Bio 2009;96(1):72-83.
13. Nolden M, Zelzer S, Seitel A, Wald D, Müller M, Franz AM, Maleike D, Fangerau M, Baumhauer M, Maier-Hein L, Maier-Hein KH, Meinzer HP and Wolf I, The Medical Imaging Interaction Toolkit: challenges and advances, Int J Comput Assist Radiol Surg. 2013;8(4):607-620.
14. van Gelderen P, de Zwart JA,Starewicz P, Hinks RS, Duyn JH. Real-Time Shimming to Compensate for Respiration-Induced B0 Fluctuations. Magnet Reson Med. 2007;57:362–368.
Figures