1831
Pyruvate Infusion Rates for Hyperpolarized Metabolite Imaging of Human Heart1Advanced Imaging Research Center, University of Texas Southwestern Medical Center, Dallas, TX, United States, 2Neurology, University of California, Los Angeles, Los Angeles, CA, United States, 3NeuroSpectroScopics LLC, Sherman Oaks, CA, United States, 4Hura Imaging Inc, Los Angeles, CA, United States, 5GE Healthcare, Toronto, ON, Canada, 6GE Healthcare, Dallas, TX, United States, 7Chemistry, University of Texas at Dallas, Richardson, TX, United States, 8Cardiology, Veterans Affairs North Texas Healthcare System, Dallas, TX, United States
Synopsis
MRI/MRS metabolic tracing in human heart with hyperpolarized 13C-enriched pyruvate is feasible, but there remains a need to define the optimal infusion timing that accommodates both short polarization lifetime and subject comfort. Typical studies have used a 5.0 cm3/sec pyruvate infusion rate. We hypothesized that slower infusion is feasible because of the in vitro versus intravascular T1 difference and because vascular properties limit the rate of pyruvate delivery from the infusion site to the heart. Vascular dynamic simulations and preliminary human investigations suggest that a 2.0 cm3/sec pyruvate infusion rate be effectively used.
Introduction
Recently the feasibility of MRI/MRS metabolic tracing in human heart using hyperpolarized 13C-enriched pyruvate (HP-[1-13C]Pyr) has been demonstrated (1). Despite the very large signal-to-noise ratio enhancement offered by hyperpolarization, the polarization lifetime is short. The in vitro [1-13C]Pyr longitudinal relaxation time (T1) is ~70 sec and the intravascular T1 is ~20 sec. In typical human studies, HP-[1-13C]Pyr produced by dissolution nuclear dynamic polarization (DNP) has been delivered to the venous system at 5.0 cm3/sec. Some subjects report mild discomfort, and sicker patients may have fragile veins or require very small bore catheters. For such subjects, a slower infusion is needed. In the present work, we hypothesized that slower infusions are feasible because the in vitro T1 is longer than the intravascular T1 and because the dynamic properties of the human vascular system limit the rate at which pyruvate is delivered from the antecubital infusion site to the heart. The feasibility of administering pyruvate at rates of less than 5.0 cm3/sec was evaluated by building dynamic simulations of HP-[1-13C]Pyr passage through the vascular system that incorporated in vitro and intravascular T1 relaxation. In addition, preliminary studies of human subjects that used pyruvate infusion rates of 5.0 cm3/sec and 2.0 cm3/sec were performed.Methods
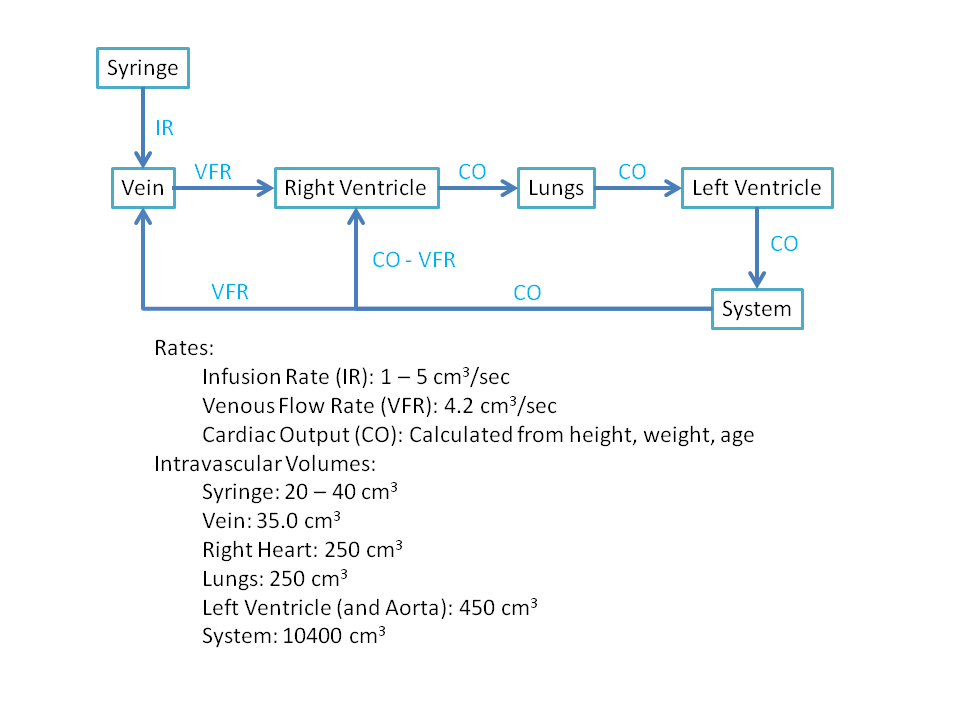
Pharmacokinetic models were previously developed to model conventional iodine intravascular contrast media passage for dynamic CT (2, 3). The model proposed in (2) was modified to simulate pyruvate transit through the human vascular system and account for T1 relaxation (Figure 1). The revised model was used to simulate the bolus passage of HP-[1-13C]Pyr using infusion rates ranging from 1.0 to 5.0 cm3/sec. Human subjects were studied using a GE 3 T MRI unit with RF receive coils and pulse sequences optimized for detecting heart metabolism of HP-[1-13C]Pyr to form HP-[1-13C]Lactate and HP-[13C]Biocarbonate. A clinical SPINlab polarizer (GE Healthcare) was used for DNP. Following dissolution, polarization levels ranged from 36 to 48% and Pyr concentrations ranged from 236 to 245 mM. The time needed for pre-infusion quality control ranged from 58 to 63 sec. Infused volumes were between 25 and 30 cm3. Each subject underwent two studies that used pyruvate infusion rates of 2.0 and 5.0 cm3/sec during a single imaging session.Results
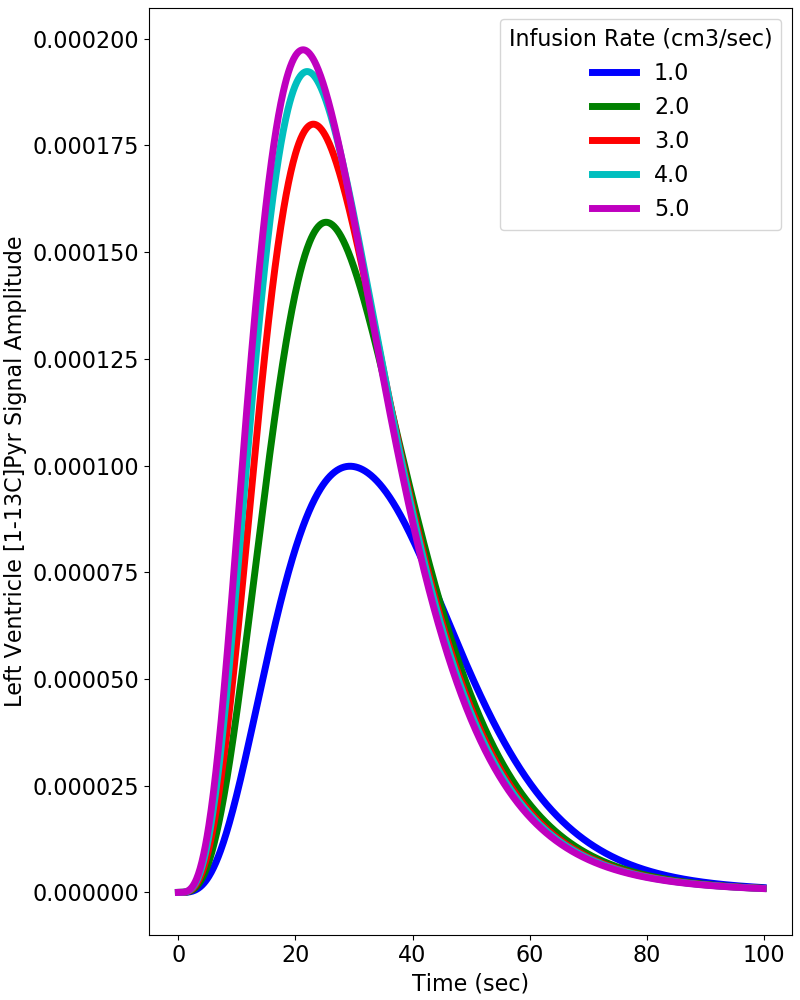
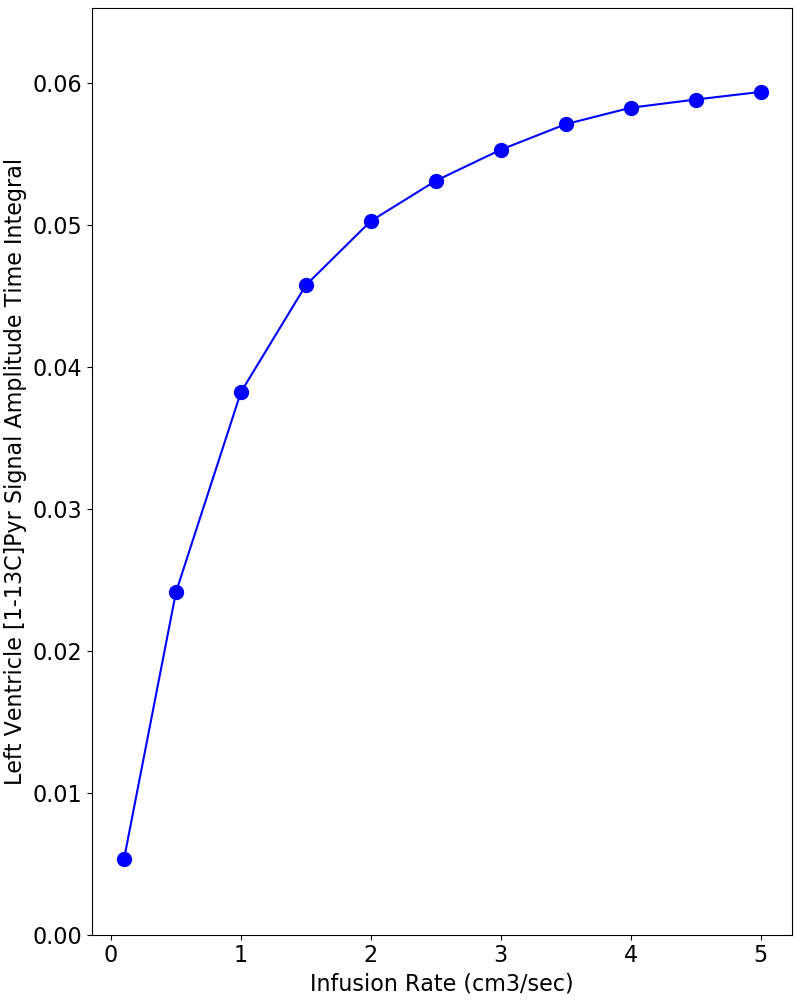
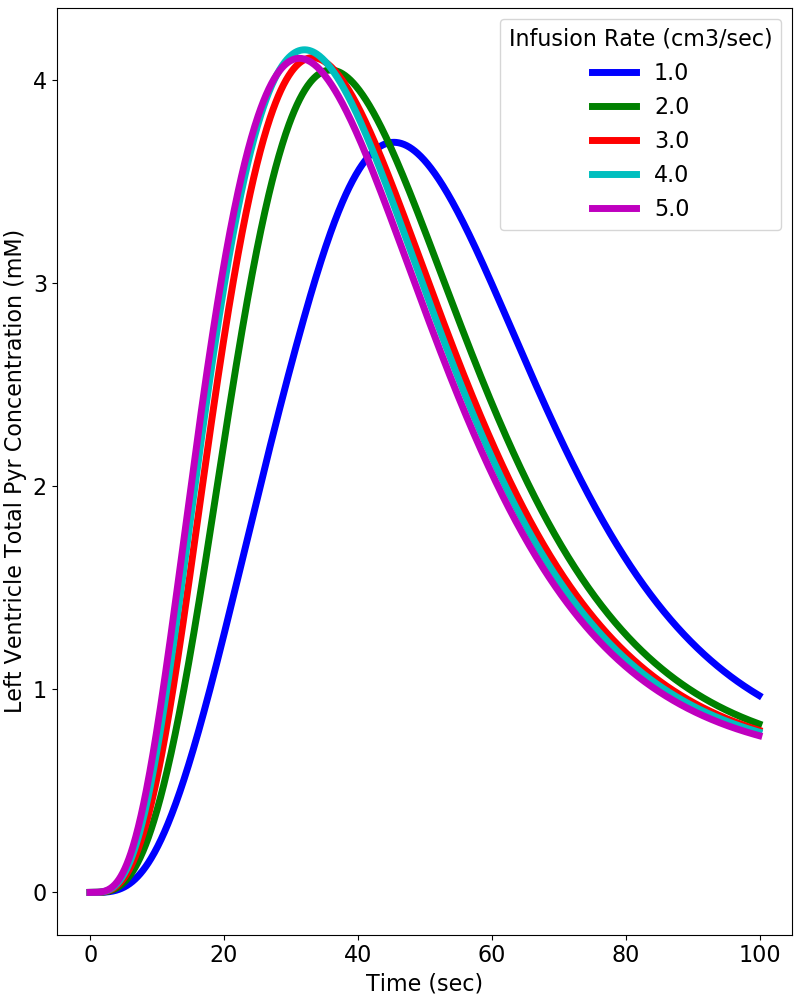
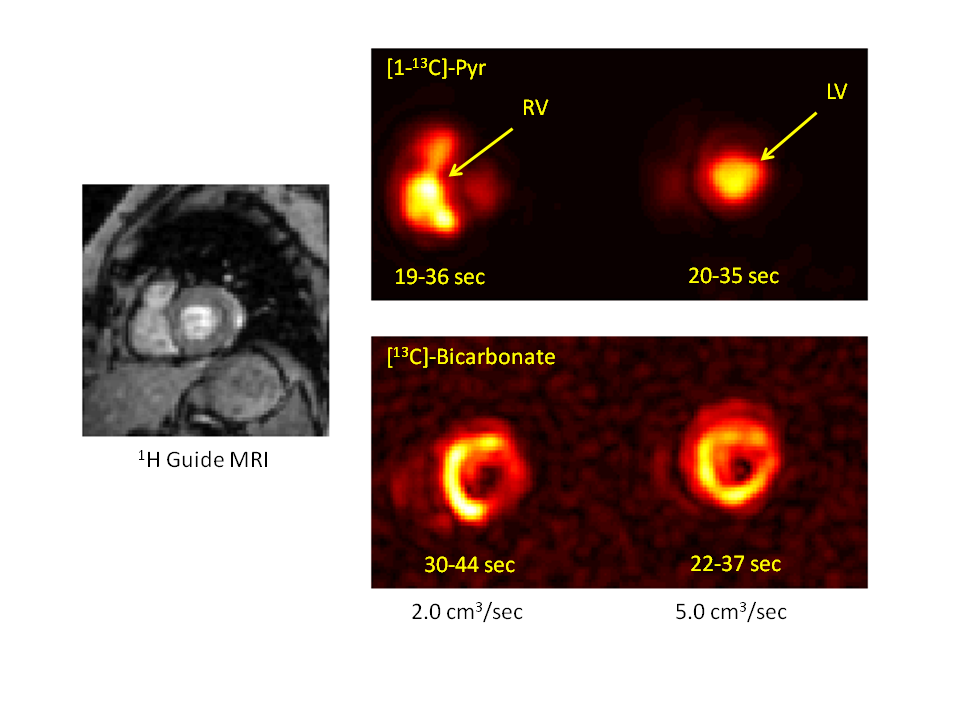
Figure 2 provides simulations of the dynamic HP-[1-13C]Pyr MR signal intensity (= concentration x polarization) that is expected in the left ventricle using infusion rates ranging from 1.0 to 5.0 cm3/sec. These simulations used realistic values of key vascular properties from (2) and the above-stated estimates of in vitro and intravascular T1. The simulations indicate that the maximum HP-[1-13C]Pyr level reached in the left ventricle using an infusion rate of 2.0 cm3/sec is 85% of that reached using an infusion rate of 5.0 cm3/sec. A greater than 2-fold infusion rate reduction results in only ~20% reduction in the peak amount of hyperpolarized pyruvate that is available for metabolism in the left myocardium. Given that metabolism may be dynamically limited by plasma and mitochondrial membrane transport and is not instantaneous (4), it is also important to evaluate the total amount of HP-[1-13C]Pyr that passes through the left ventricle (ie signal intensity time integral) as shown in Figure 3. This figure illustrates a ~25% reduction in the total HP-[1-13C]Pyr delivered during the dynamic passage when the infusion rate is reduced from 5.0 to 2.0 cm3/sec. Figure 4 shows that the total delivered [1-13C]Pyr (HP and relaxed) is almost independent of infusion rate. All infusion rates above 2.0 cm3/sec provide a peak pyruvate concentration above 4.0 mM with nearly identical dynamics. Figure 5 compares HP-[1-13C]Pyr magnetic resonance spectroscopic imaging (MRSI) results for the 2.0 and 5.0 cm3/sec infusion rates for a single human subject. The figure shows that a 2.0 cm3/sec infusion rate produces evaluable HP-[13C]Bicarbonate images, although the peak image intensity is moderately reduced compared with the 5.0 cm3/sec infusion, as predicted by the simulations. The figure further illustrates that use of the slower infusion rate leads to visualization of HP-[1-13C]Pyr in the right ventricle at the earliest feasible image acquisition time (ie ~20-35 sec after infusion start), which does not occur when the faster infusion rate is used.Conclusions
Vascular dynamic simulations and preliminary human investigations suggest that when needed, an infusion rate of 2.0 cm3/sec can be used for HP-[1-13C]Pyr studies of human heart metabolism with relatively little loss of signal. Furthermore, an infusion rate of 2.0 cm3/sec may support study of metabolism in both the left and right myocardium. To our knowledge, this is the first effort to systematically evaluate the feasibility of pyruvate infusion rates of less than 5.0 cm3/sec for human heart studies. However, our results are consistent with a recent study that used infusion rates of 1.0 – 3.0 cm3/sec for investigation of brain tumors in children (5).Acknowledgements
Financial support from NIH/NIBIB P41 EB015908References
1. Cunningham CH, Lau JY, Chen AP, Geraghty BJ, Perks WJ, Roifman I, Wright GA, Connelly KA. Hyperpolarized 13C Metabolic MRI of the Human Heart: Initial Experience. Circ Res. 2016 Nov 11;119(11):1177-1182. PMID: 27635086
2. Violon D. Kinetics of intravenous radiographic contrast medium injections as used on CT: simulation with time delay differential equations in a basic human cardiovascular multicompartment model. Br J Radiol. 2012 Dec;85(1020):e1212-8. PMID: 23175487
3. Bae KT. Intravenous contrast medium administration and scan timing at CT: considerations and approaches. Radiology. 2010 Jul;256(1):32-61. PMID: 20574084
4. Rao Y, Gammon S, Zacharias NM, Liu T, Salzillo T, Xi Y, Wang J, Bhattacharya P, Piwnica-Worms D. Hyperpolarized [1-13C]pyruvate-to-[1-13C]lactate conversion is rate-limited by monocarboxylate transporter-1 in the plasma membrane. Proc Natl Acad Sci U S A. 2020 Sep 8;117(36):22378-22389. PMID: 32839325
5. Autry AW, Park I, Kline C, Chen HY, Gordon JW, Raber S, Hoffman C, Kim Y, Okamoto K, Vigneron DB, Lupo JM, Prados M, Li Y, Xu D, Mueller S. Pilot Study of Hyperpolarized 13C Metabolic Imaging in Pediatric Patients with Diffuse Intrinsic Pontine Glioma and Other CNS Cancers. AJNR Am J Neuroradiol. 2020 Dec 3. Online ahead of print. PMID: 33272950
Figures