1828
3D Silent Parameter Mapping: Further refinements & quantitative assessment
Florian Wiesinger1,2, Graeme McKinnon3, Sandeep Kaushik1, Ana Beatriz Solana1, Emil Ljungberg2, Mika Vogel1, Naoyuki Takei4, Rolf Schulte1, Carolin Pirkl1, Cristina Cozzini1, Laura Nuñez-Gonzalez5, Juan A. Hernandez Tamames5, and Mathias Engström6
1GE Healthcare, Munich, Germany, 2IoPPN, Department of Neuroimaging, King's College London, London, United Kingdom, 3GE Healthcare, Waukesha, WI, United States, 4GE Healthcare, Hino, Japan, 5Erasmus MC, Rotterdam, Netherlands, 6GE Healthcare, Stockholm, Sweden
1GE Healthcare, Munich, Germany, 2IoPPN, Department of Neuroimaging, King's College London, London, United Kingdom, 3GE Healthcare, Waukesha, WI, United States, 4GE Healthcare, Hino, Japan, 5Erasmus MC, Rotterdam, Netherlands, 6GE Healthcare, Stockholm, Sweden
Synopsis
Here we present further improvements of a 3D Silent Parameter Mapping method in terms of Deep Learning image reconstruction and synthetic CT image conversion. We evaluated its quantitative accuracy using the NIST/ISMRM phantom and illustrate healthy volunteer results at 1.5T and 3T.
Introduction
One major thrust in radiology today is image standardization with rapidly-acquired, quantitative, multi-contrast information. This is critical for multi-center trials, for the collection of big data and the use of artificial intelligence in evaluating the data. In the past few years new quantitative, multi-parametric MR imaging methods have been presented addressing this need1-3. Here we present further improvements of a novel 3D Silent Parameter Mapping4 method in terms of image reconstruction and synthetic CT image conversion9. We also assessed the accuracy of the obtained parameter maps using the quantitative NIST/ISMRM phantom and illustrate healthy volunteer scans acquired at 1.5T and 3T.Methods
The 3D Silent Parameter Mapping method is based on T1 and T2 magnetization preparation combined with a segmented Zero TE (ZTE) readout to acquire interleaved T1 and T2 weighted images similar to the QALAS method (cf. Fig. 1). The PD map is measured upfront using ZTE with a low ~1deg flip angle (FA) resulting in negligible T1 saturation4, which simplifies the parameter estimation to two parameter fitting (i.e. T1, T2) and reduces crosstalk artifacts. The 3D radial ZTE images are acquired and reconstructed with 2x radial oversampling, which doesn’t require extra scan time but permits depiction of the anatomy beyond the nominal field-of-view (FOV). The images were reconstructed using a Deep Learning framework similar to as described by Lebel5. Dictionary based parameter fitting was implemented using orthogonal matching-pursuit, with the {T1, T2} dictionary entries calculated based on spoiled-gradient-echo (SPGR) signal equations4. The 2xFOV reconstructed PD images were tested for synthetic CT image conversion using a 2D multi-task network6 trained on N=140 pairs of registered ZTE and CT head&neck images obtained from independent studies. The 3D Silent Parameter Mapping was implemented and tested on a 1.5T MR450w and a 3T MR750w scanner using a GEM HNU head array coil (GE Healthcare, Chicago, IL). Its accuracy was assessed using a quantitative NIST/ISMRM phantom (CaliberMRI, Boulder, CO, USA) and compared to two alternative 3D parameter mapping methods including MAGiC2,7 and QTI8. All volunteer experiments were performed with written informed consent and approval by local ethics commission.Results
Figure 2 summarizes the quantitative T1 (left) and T2 (right) assessment of 3D Silent Parameter Mapping (without DL image reconstruction, green), 3D MAGiC (blue) and QTI (orange) using the NIST/ISMRM phantom at 3T. The 3D Silent Parameter Mapping demonstrates accurate and precise quantitation in the relevant range of T1 and T2 values found in-vivo. Its T2 values show increasing standard deviation for values very far distant from the echo time of the T2 preparation pulse used (i.e. 80ms in this case) . Figures 3 and 4 illustrate quantitative PD, T1 and T2 parameter maps obtained without (top) and with (bottom) Deep Learning image reconstruction in healthy volunteers at 1.5T (res=1.2mm, 6min05s) and 3T (res=1.0mm, 8min44s). Apparently, Deep Learning significantly reduces image noise and to a lesser extend also improves image sharpness resulting in excellent T1 and T2 quantitative parameter maps clean of cross-talk artifacts. Figure 5 illustrates 2xFOV extended reconstructions of the PD image (top) obtained from the 1.5T volunteer shown in Fig. 3 together with the Deep Learning derived synthetic CT (bottom).Discussion
The presented improvements boost the performance of 3D Silent Parameter Mapping in terms of SNR, image sharpness and field-of-view coverage, allowing robust, high resolution 3D parameter mapping of the whole head in acceptable scan times. The obtained PD images are perfectly suited as input for Deep Learning based synthetic CT image conversion9. Together this forms a powerful package for silent, quantitative neuroimaging and also MR-only radiation therapy planning in terms of synthetic CT conversion and organ-at-risk (OAR) segmentation. The presented 3D Silent Parameter Mapping is available as work-in-progress package for GE MR and PET/MR scanners.Acknowledgements
This research is part of the Deep MR-only Radiation Therapy activity (project numbers: 19037, 20648) that has received funding from EIT Health. EIT Health is supported by the European Institute of Innovation and Technology (EIT), a body of the European Union and receives support from the European Union´s Horizon 2020 Research and innovation program.References
- Blystad et al (2012). Synthetic MRI of the brain in a clinical setting. Acta radiologica 53.10: 1158-1163.
- Kvernby et al (2014). Simultaneous three-dimensional myocardial T1 and T2 mapping in one breath hold with 3D-QALAS. JCMR 16.1: 1-14
- Ma et al (2013). Magnetic resonance fingerprinting." Nature 495.7440: 187-192.
- Wiesinger et al (2020). PSST … Parameter mapping in a Swift and SilenT manner. ISMRM 2020: p. 882.
- Lebel (2020). Performance characterization of a novel deep learning-based MR image reconstruction pipeline. arXiv preprint arXiv:2008.06559.
- Kaushik et al (2018). Deep Learning based pseudo-CT computation and its application for PET/MR attenuation correction and MR-guided radiation therapy planning. ISMRM 2018: p.1253.
- Fujita et al (2020). Accelerated Isotropic Multiparametric Imaging by High Spatial Resolution 3D-QALAS With Compressed Sensing: A Phantom, Volunteer, and Patient Study." Investigative radiology.
- Gómez et al (2020). Rapid three-dimensional multiparametric MRI with
quantitative transient-state imaging. Scientific reports 10.1: 1-17.
- Wiesinger et al (2018). Zero TE‐based pseudo‐CT
image conversion in the head and its application in PET/MR attenuation
correction and MR‐guided radiation therapy planning. MRM, 80(4), 1440-1451.
Figures
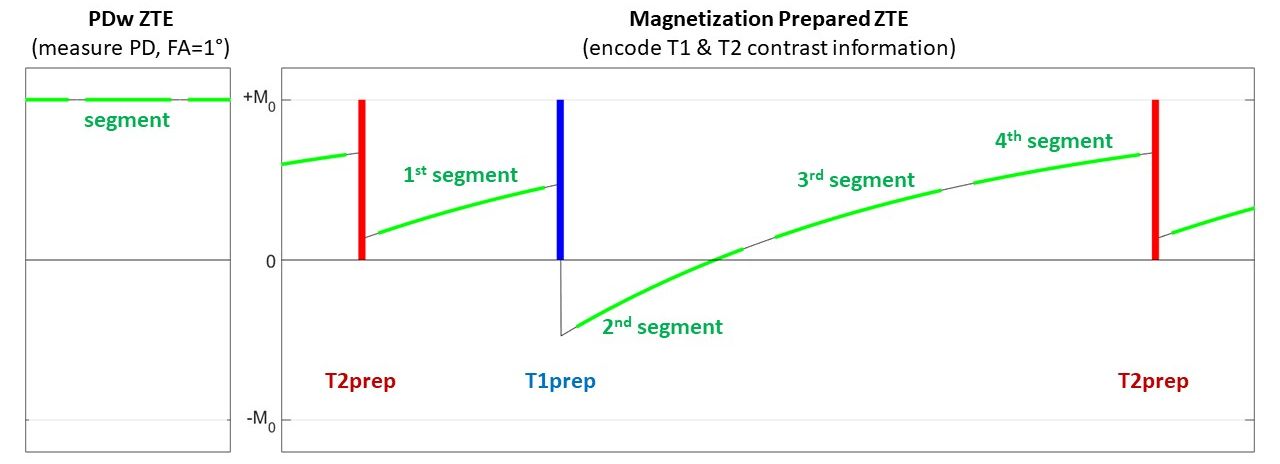
Figure 1: 3D Silent Parameter Mapping starts with a low FA~1° PD measurement (left) followed by a magnetization prepared segmented ZTE acquisition (FA=3°) to encode T1 and T2 contrast weighted information (right).
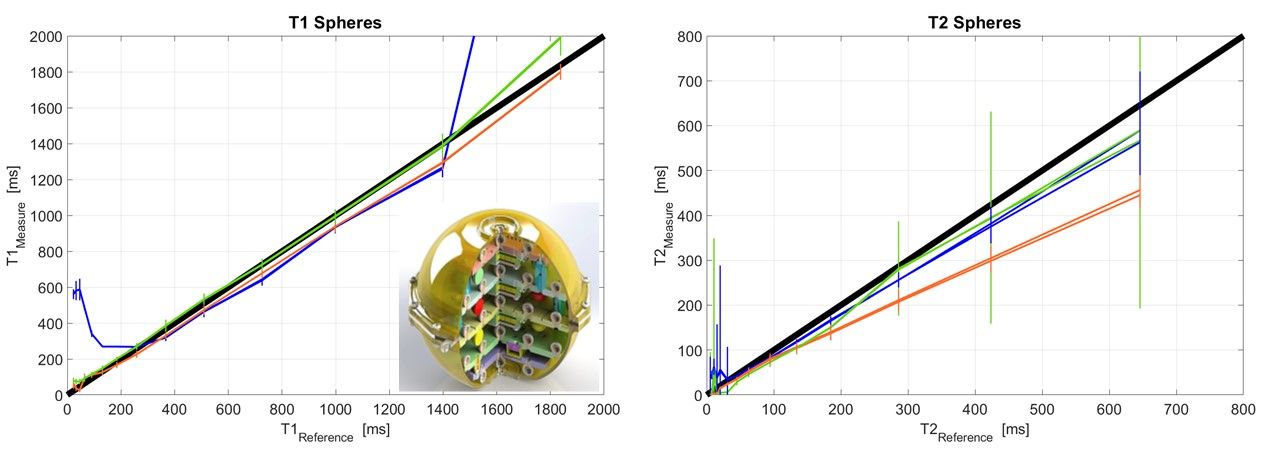
Figure 2: Quantitative assessment
of T1 and T2 accuracy of 3D Silent Parameter Mapping in comparison
to 3D MAGiC and QTI (FOV=20cm, res=1mm) using the NIST/ISMRM phantom.
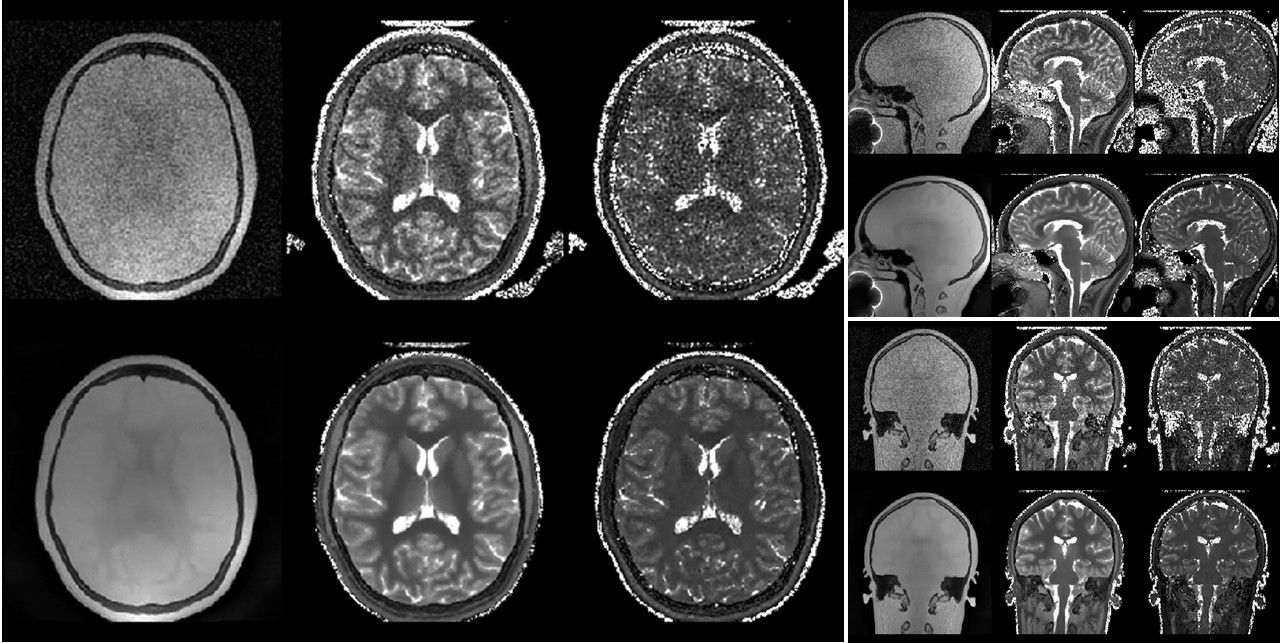
Figure 3: 3D Silent Parameter Mapping (FOV=19.2cm, res=1.2mm, BW=±31.25kHz, 1.5 averages, 6min05sec) at 1.5T showing PD (left), T1 (0…2s, middle) and T2 (0…1.6s,
right) parameter maps.
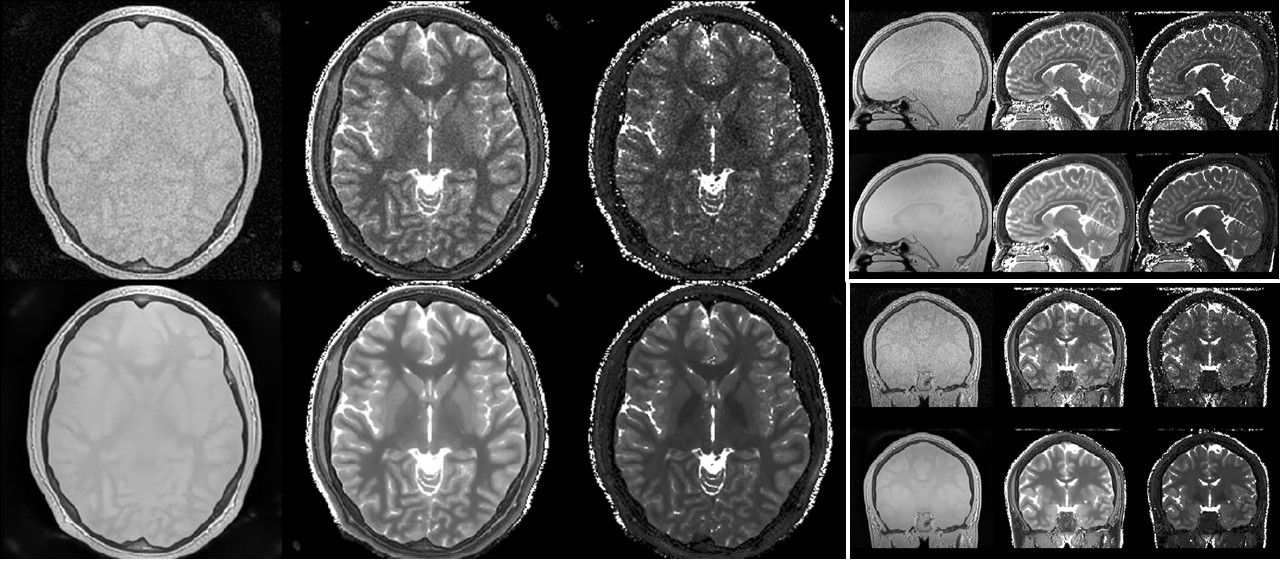
Figure 4: 3D Silent Parameter Mapping (FOV=19.2cm, res=1.0mm, BW=±31.25kHz, 1.5 averages, 8min44sec) at 3T showing PD (left), T1 (0…2s, middle) and T2 (0…1.6s,
right) parameter maps.
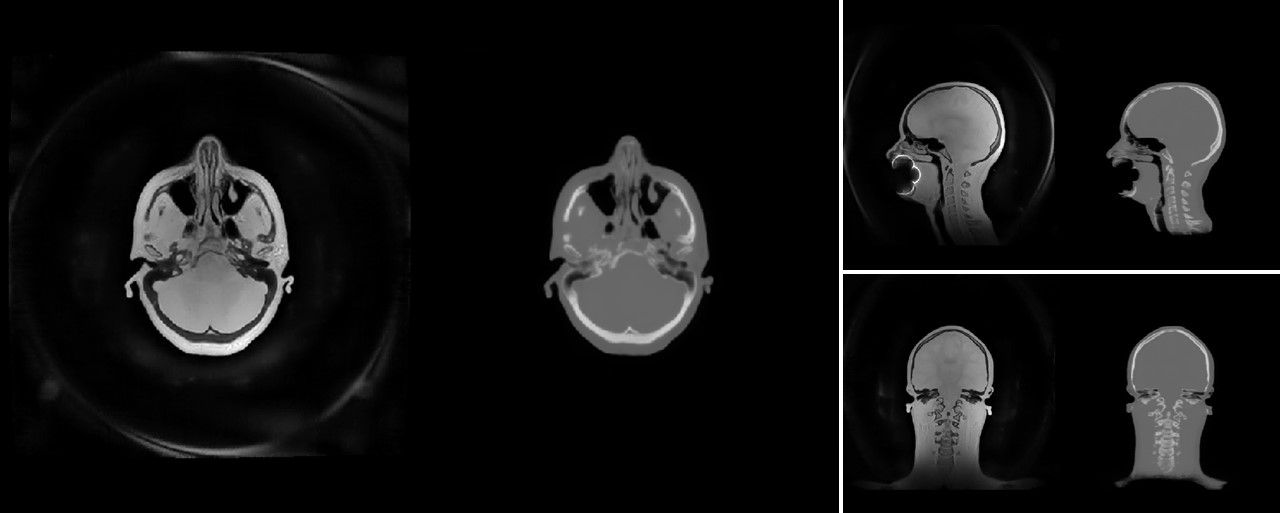
Figure 5: Extended 2x FOV reconstructed PD image
(left) and corresponding synthetic CT (right) for the same volunteer as shown in Fig. 2 (1.5T,
res=1.2mm). The dental
implant generates a signal void in the mouth region.