1827
In Vivo Mapping of Non-heme Iron Using Time-dependent R2* Relaxation Measured with MGRE1Center for Advanced Imaging Innovation and Research (CAI2R), Department of Radiology, New York University Grossman School of Medicine, New York, NY, United States, 2Bernard and Irene Schwartz Center for Biomedical Imaging, New York University Grossman School of Medicine, New York, NY, United States
Synopsis
Identification and quantification of imaging biomarkers sensitive to iron are important in understanding neurodegenerative disorders and aging. In this study, we introduce a microstructural parameter, $$$\delta\Omega^{2}$$$, the Larmor frequency variance, measured from the curvature in the logarithm of the signal from a 3D multiecho gradient echo sequence. Non-monoexponential relaxation originates from magnetic field perturbations due to the presence of mesoscopic susceptibility sources such as cellular-level iron. Our results in 26 healthy subjects show a strong linear correlation between $$$\delta\Omega^{2}$$$ and published values for iron concentration in deep gray matter regions, suggesting its potential as an imaging biomarker for iron.
INTRODUCTION
Altered brain iron is associated with a number of neurodegenerative diseases.1,2 However, characterizing cellular-level iron in vivo is a challenge. Mesoscopic sources such as iron clusters are primarily responsible for the magnetic field perturbations that give rise to non-monoexponential transverse relaxation.3,4 Previous work with microbead phantoms has demonstrated that the mesoscopic contribution to transverse relaxation can be measured using a 3D multiecho gradient echo (MGRE) sequence.5 Here we measure $$$\delta\Omega^{2}$$$, the Larmor frequency variance, in deep gray matter nuclei of the normal human brain, including the globus pallidum (GP), putamen (Pt), caudate (Cd) and thalamus (Th). We correlate the results with reference values for non-heme iron in normal brain, obtained from histology.THEORY
In the weak field limit (the Gaussian phase approximation), the MGRE signal is expressed as a truncated cumulant expansion: $$$\ln S(t) ≈ \ln S_{0}-R_{2}t-\frac{1}{2}\langle \varphi^{2}(t) \rangle$$$, where the mesoscopic contribution to the phase $$$\varphi(t)=\int_{0}^{t}dt'\Omega(t')$$$ equals the integral of the local Larmor frequency $$$\Omega(t) ≡ \Omega(x(t))$$$ experienced by each spin along its Brownian path $$$x(t)$$$.4 Assuming a Gaussian form for the spatial correlation function, $$$\langle \Omega(x) \Omega(0) \rangle = \delta \Omega^{2} \cdot e^{-x^{2}/l_{c}^{2}}$$$, the phase variance can be calculated by averaging over all Brownian paths. This yields:$$ \ln S(t) = \ln S_{0}-R_{2}t-2\alpha^{2}(\frac{t}{t_{c}}-2\sqrt{1+\frac{t}{t_{c}}}+2), [1]$$
where $$$\alpha=\delta\Omega \cdot t_{c}$$$, and $$$t_{c}=l_{c}^{2}/D$$$ is the correlation time to diffuse over a distance equal to the correlation length $$$l_{c}$$$ of the mesoscopic field $$$\Omega(x)$$$.4
In the static dephasing regime $$$t « t_{c}$$$, the Gaussian phase approximation depends only on the variance of the Larmor frequency $$$\delta\Omega^{2}=\langle \Omega(x)^{2} \rangle$$$, and the logarithm of the signal varies quadratically with time, $$$\ln S(t) ≈ \ln S_{0}-R_{2}t-\frac{1}{2}\delta\Omega^{2}·t^{2}$$$. The curvature of $$$\ln S(t)$$$ is a signature of heterogeneity in $$$\Omega(x)$$$ within a voxel. In the opposite, long-time limit $$$t»t_{c}$$$, the decay of $$$\ln S(t)$$$ is asymptotically linear, $$$\ln S(t) ≈ \ln S_{0}-(R_{2}+2\alpha^{2}/t_{c})t$$$.
METHOD
We studied 26 normal subjects (age, 37 ± 12, range 23 - 65 years; 9 male). MR imaging was performed at 3T (Skyra or Prisma, Siemens) using a 3D MGRE sequence with the following imaging parameters: FOV=220x170x75mm3, 1.25mm isotropic resolution, 30 monopolar echoes, TE=1.9-69.18ms, TR=92ms, FA=22°, BW/pixel=840Hz. Segmentation of deep gray matter was performed using FreeSurfer followed by manual correction as needed. Averaged signal values within the regions-of-interest (ROIs) for each individual were fitted to the model described by equation [1] using MATLAB R2019b.The rationale for using a 3D acquisition is that weak macroscopic gradients in Larmor frequency $$$\Omega \sim gx$$$ due to imperfect shimming merely shift the 3D k-space and do not contribute to the signal attenuation.6
RESULTS
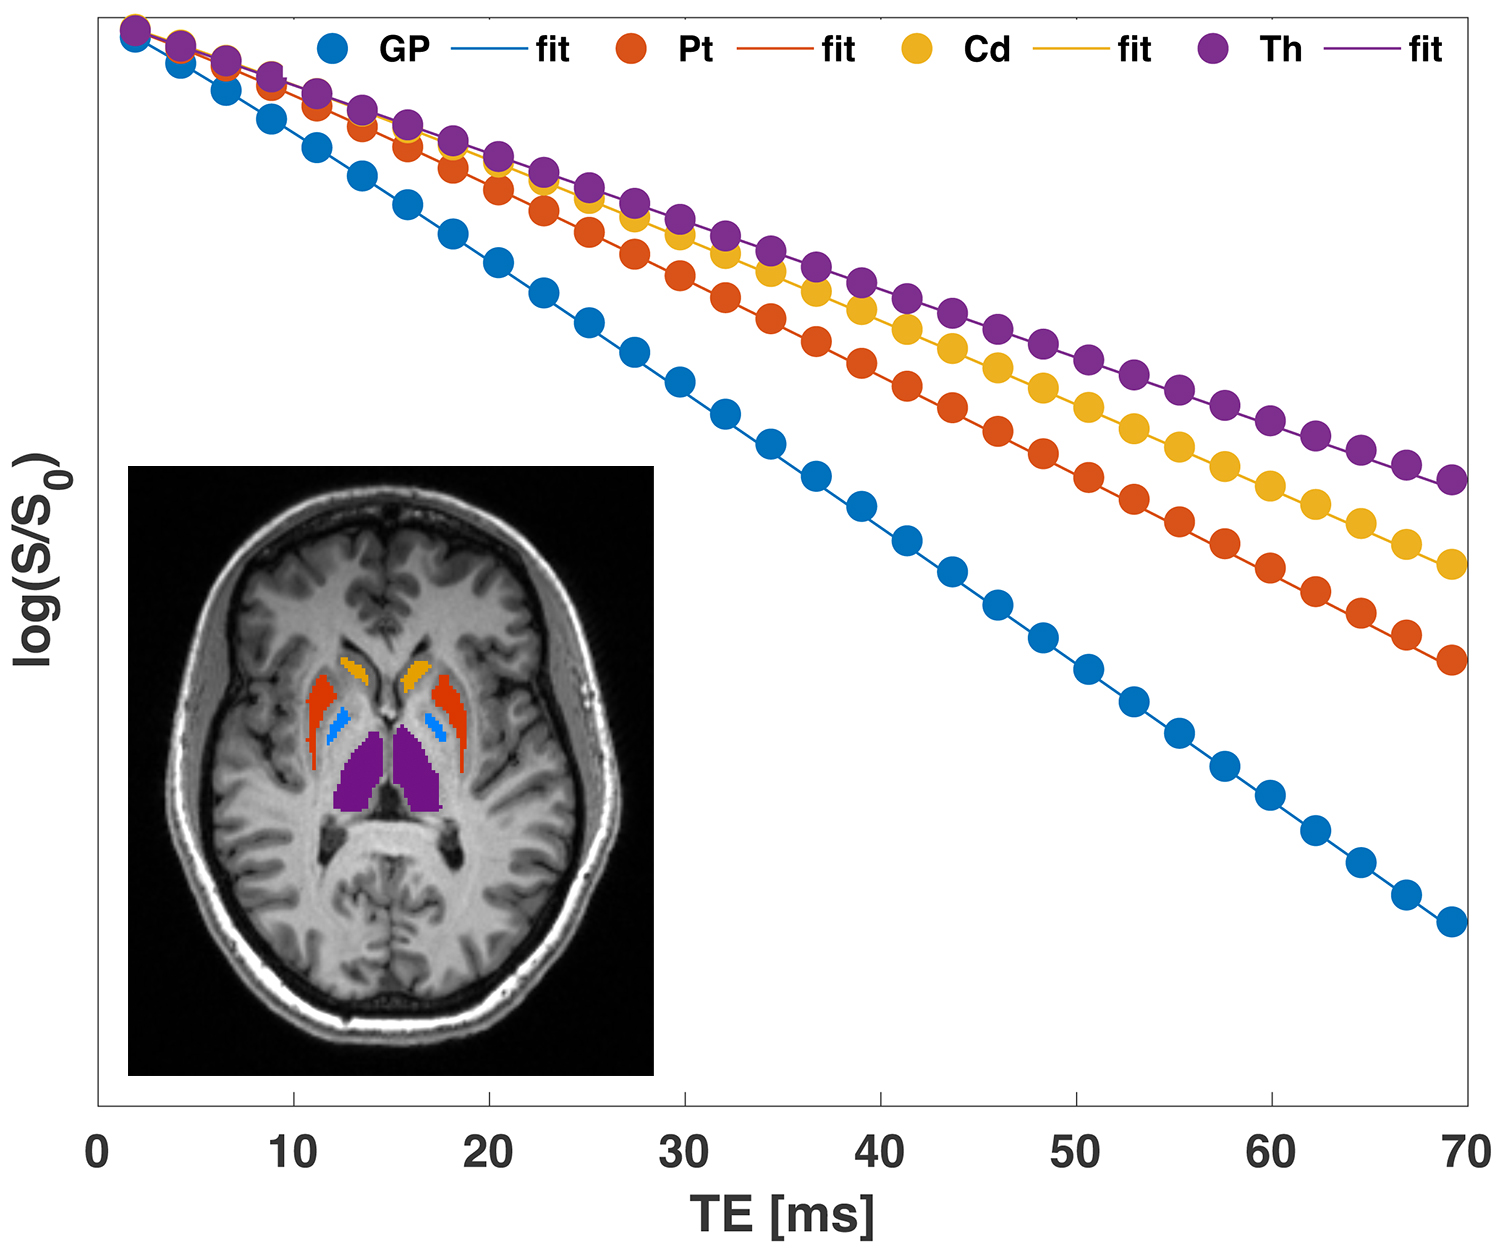
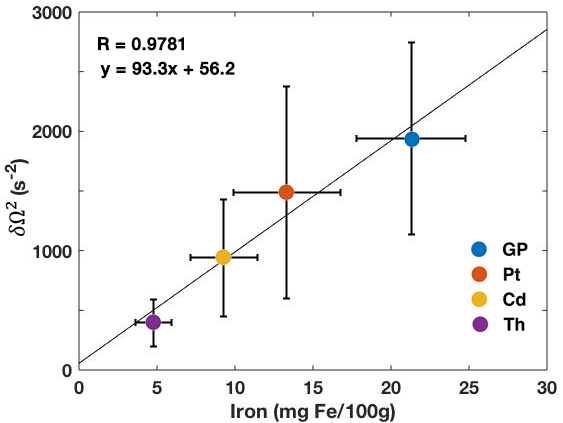
We found that the signal within each of the ROIs exhibited nonmonoexponential decay as a function of TE (Fig.1). The quadratic and linear behaviors at short and long times, respectively, are evident in the data.Fits of the model [1] to MGRE data provided the following estimates of $$$\delta\Omega^{2}$$$: GP:1939.2±802.7; Pt:1488±888.5; Cd:941.3±489.2; Th:394.3±199.3 $$$s^{-2}$$$. Significant linear correlations were observed between the average values of $$$\delta\Omega^{2}$$$ and published non-heme iron concentrations7 in the respective brain regions (Fig.2).
DISCUSSION
The signal from a simple, fast and readily available 3D MGRE sequence contains important biophysical information regarding susceptibility variations in tissue at a mesoscopic level. The microstructural parameter $$$\delta\Omega^{2}$$$ can be readily extracted in addition to the more commonly measured long-time relaxation rate. The high correlation of $$$\delta\Omega^{2}$$$ with documented pathology values from the literature shows that $$$\delta\Omega^{2}$$$ tracks with non-heme iron. This suggests its potential applicability in the study of a broad range of neuropathologies, from Alzheimer’s dementia and Parkinson’s disease to chronic traumatic encephalopathy, all of which have been associated with abnormalities in cellular-level iron metabolism.1,2 The large standard deviation we observed may be due to the wide age range of the subjects studied.CONCLUSIONS
Non-heme iron plays a critical role in brain function and is linked to a variety of neurodegenerative diseases. Using a simple, fast 3D MGRE sequence, our work shows the feasibility of mapping non-heme iron concentration via the mesoscopic contribution to the Larmor frequency variance $$$\delta\Omega^{2}$$$ from microstructural susceptibility variations in tissue.Acknowledgements
This work was supported in part by NIH NNDS R01 NS039135, R21 NS090349, R56 NS119767, DoD PT190013, Lowenstein Foundation.References
- RJ Ward et al. The role of iron in brain ageing and neurogenerative disorders. Lancet Neurol. 2014;13:1045-1060.
- EJ Nisenbaum et al. The presence and role of iron in mild traumatic brain injury: An imaging perspective. J Neurotrauma. 2014;31:301-107.
- DA Yablonskiy and EM Haacke. Theory of NMR signal behavior in magnetically inhomogeneous tissues: the static dephasing regime. MRM. 1994;32:749-763.
- VG Kiselev and DS Novikov. Transverse NMR relaxation in biological tissues. NeuroImage. 2018;182:149-168.
- P Storey et al. Signatures of microstructure in conventional gradient and spin echo signals. ISMRM 2015, p.14.
- P Storey et al. Artifact-free T2* mapping without post hoc corrections. ISMRM 2015, p.442.
- B Hallgren and P Sourander. The effect of age on the non-haemin iron in the human brain. J Neurochem 1958;3:41-51.
Figures