1825
Simultaneous quantification of T2 and T2* by accelerated 10-echo GESE-EPIK sequence for carrageenan-phantoms and in vivo data1Institute of Medicine and Neuroscience 4, Forschungszentrum Juelich GmbH, Jülich, Germany, 2Institute of Medicine and Neuroscience 11, Forschungszentrum Juelich GmbH, Jülich, Germany, 3RWTH Aachen University, Aachen, Germany, 4Department of Neurology, RWTH Aachen University, Aachen, Germany, 5JARA - BRAIN - Translational Medicine, Aachen, Germany
Synopsis
Combining GE and SE signals enables quantification of several pertinent parameters making it useful in various applications. An 10-echo GESE sequence based on EPIK, known as EPI with keyhole, has been presented in our earlier work. This work employs an accelerated sequence implementation and aims to perform quantification of T2/T2* for both phantom and in vivo data. The method was configured to provide improved resolution within feasible TEs for brain scans, i.e. 1 minute. The quantified T2/T2* values were in good agreement with values from reference methods. Moreover, an SNR/tSNR analysis proves the signal and time gain from multi-shot acceleration.
Introduction
Combining GE and SE signals has been shown to be effective for the simultaneous acquisition of T2 and T2* maps1, enabling applications such as vessel-size imaging2, CBV3 and OEF4 analysis. To this ends, several sequence implementations based on EPI-readouts have been published4-6. However, the sequences are limited by the relatively long echo-time (TE), low SNR at later TEs and thus, a reduced number of echoes and lower resolution. In contrast, EPIK-readouts7,8 have been shown to outperform standard EPI-readouts in terms of SNR and slice coverage, and in our previous work9 we introduced a novel 10-echo sequence implementation based on EPIK with an increased matrix-size of 128. The sequence has now been further improved in terms of TE and parameter quantification performance. The improved method was verified on two self-made carrageenan phantoms and in vivo data with GM/WM separation. The achieved sequence speed-up was verified by (t)SNR analysis.Methods
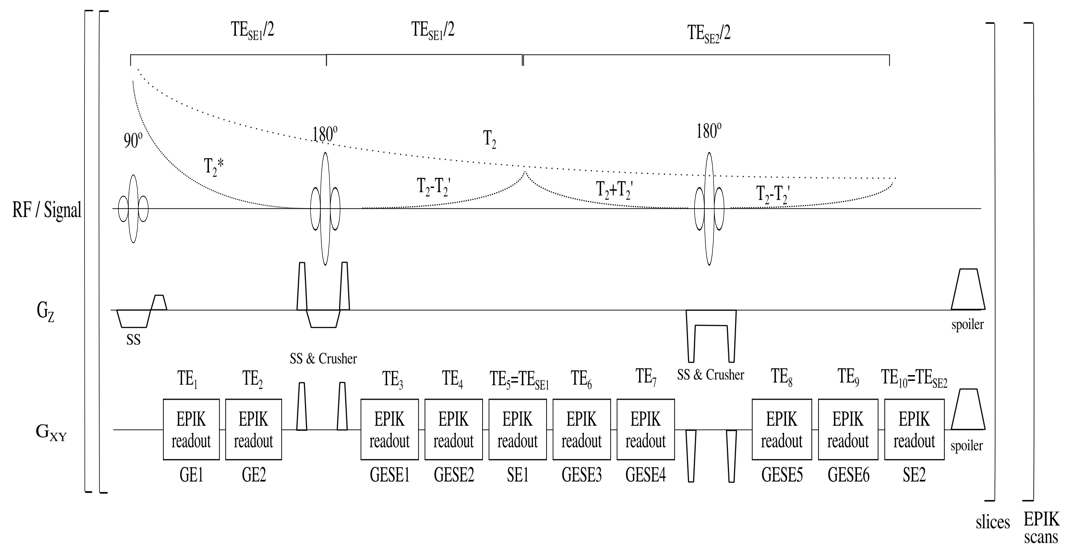
Two spherical phantoms containing a solid carrageenan-agarose mixture10 were produced to facilitate diffusion-free, homogeneous phantom measurements with reduced susceptibility artefacts. The sequence diagram of 10-echo GESE-EPIK is provided in Fig.1. The sequence acquires k-space with a 128x128 matrix-size, yielding to a spatial resolution of 1.9×1.9mm2 with 3mm thickness. Sixteen EPIK keyhole lines, GRAPPA factor 2 and a multi-shot factor (SPARSE) of 14 are implemented, yielding TE=10,20,37,47,57,67,77,94,104,114ms. Phantom data sets were acquired with six slices and TR=1000ms, while in vivo data acquired at 3T (male; 29 years) contained 20 slices with TR=2800ms, leading to TA=59s. T2* reference measurements were acquired with a conventional multi-echo (64) gradient-echo sequence11 with TE starting at 2.9ms in increments of 1.38ms and TR=1200ms for the phantom and 2000ms for in vivo, yielding TA=2:38min and 4:36min, respectively. T2 reference acquisitions were performed using four single spin-echoes with TE=10,35,60,85ms, TR=650ms (TA=4x2:18min) for the phantom and 4500ms (TA=4x7:18min) for the in vivo data. Both methods had the same resolution and slices as GESE-EPIK. All images were coregistered to the 10th multi-GE echo and masked for the brain region. WM/GM ROIs were obtained with SPM12. Reference data were fitted using non-linear least-squares fit for mono-exponential decay to compute T2 and T2*. The GESE-EPIK data can be analysed using two approaches: 1) a fast-fitting approach fits T2* on the first two GE, extrapolating the signal S0=S(t=0) and fitting S0 together with both SE for T2 and 2) a matching pursuit algorithm12 computes the best parameter combination based on all 10 echoes to match the theoretical signal decay, which requires higher computational power and time. SNR analysis was performed by dividing the mean signal in the phantom or brain region by the standard deviation of noise, which was computed from four square ROIs in the image corners to avoid influence from structured noise that may propagate from the subject in phase or frequency direction. Correction for Rician-noise was applied. For temporal-SNR analysis, each voxel’s mean value over the acquired number of repetitions given by the multi-shot factor was divided by its standard deviation.Results
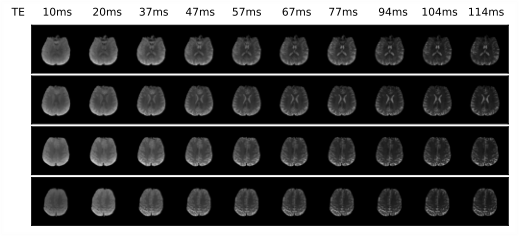
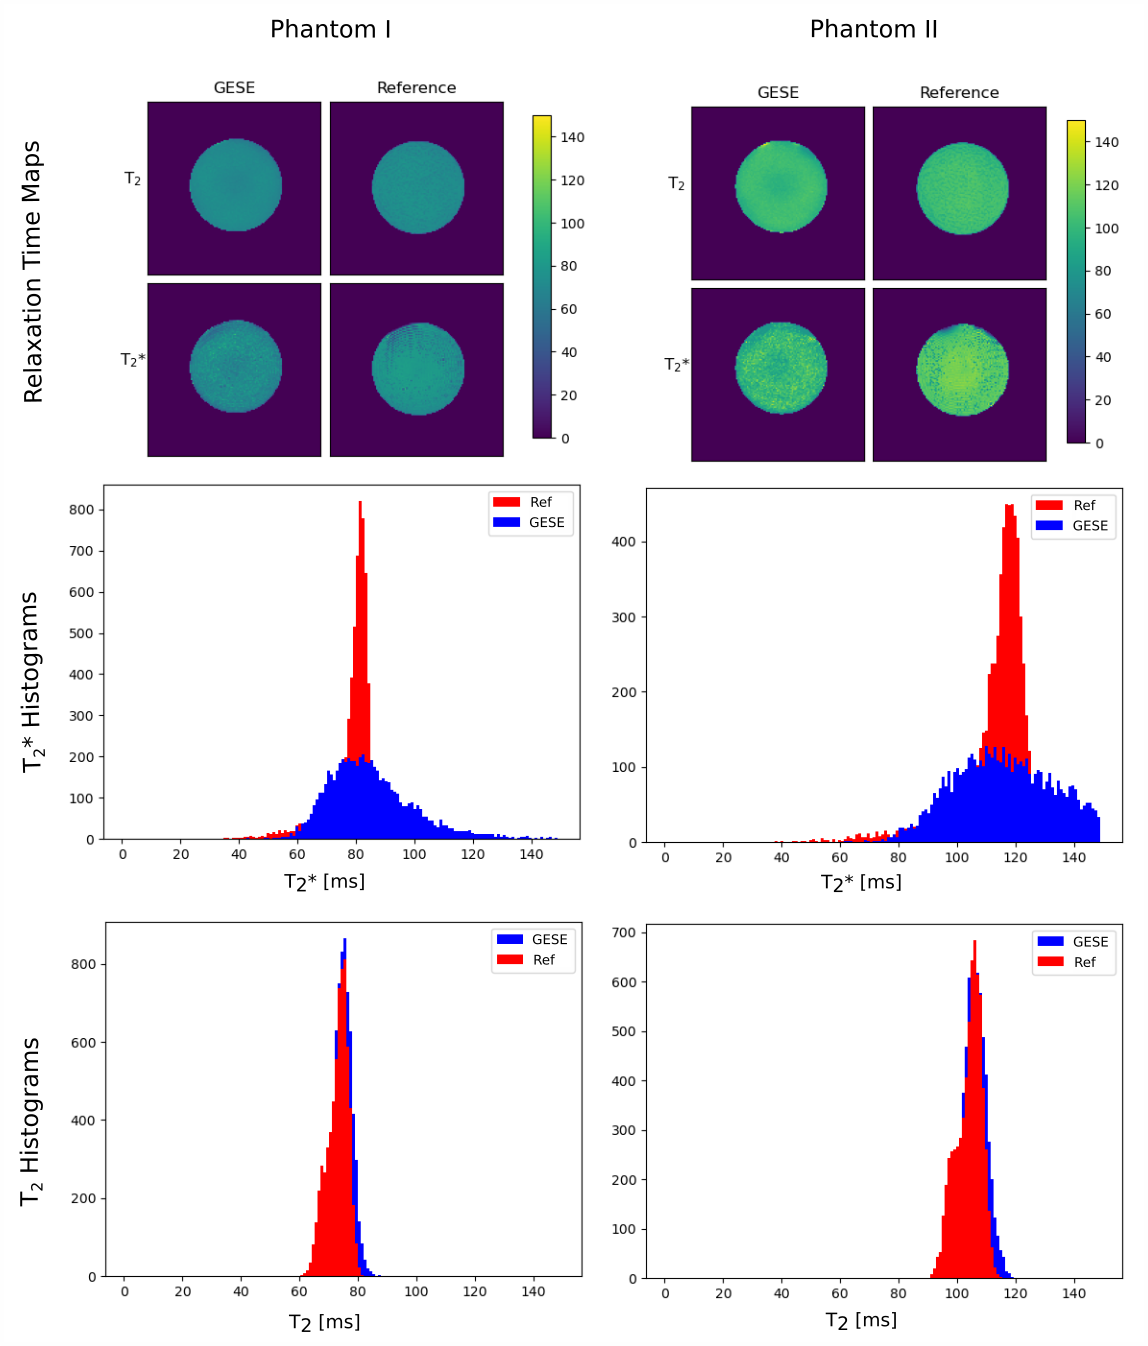
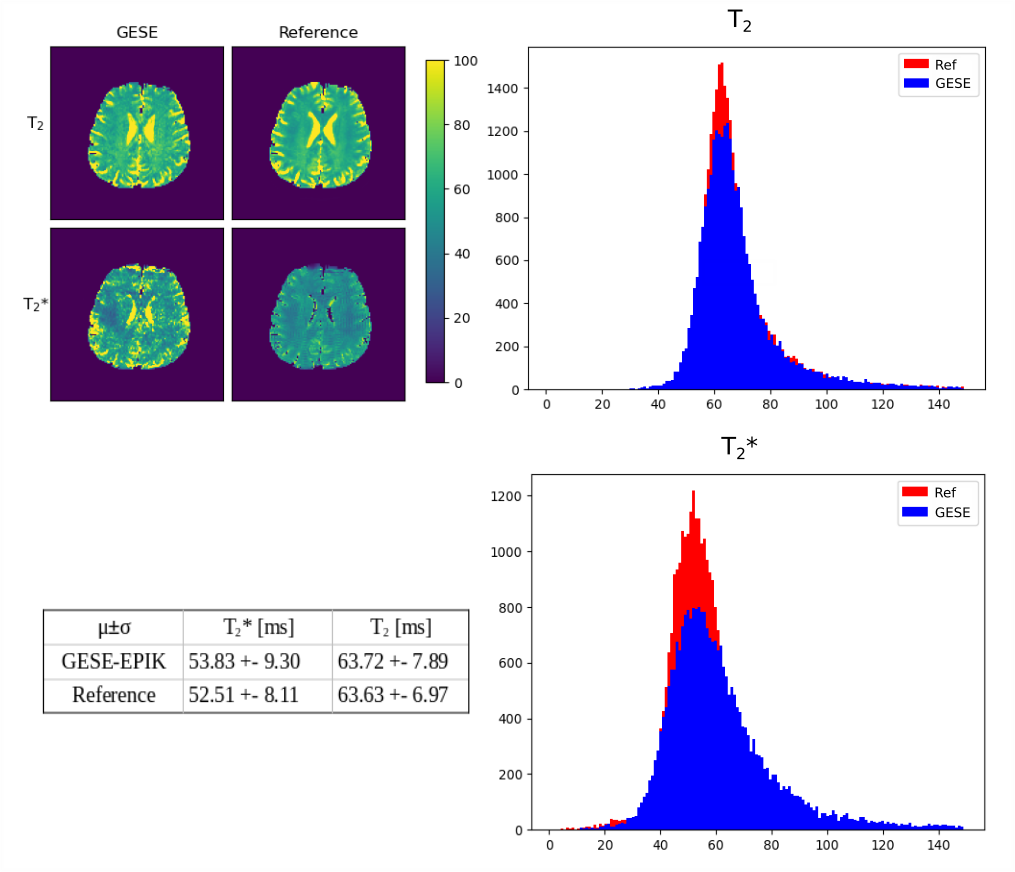
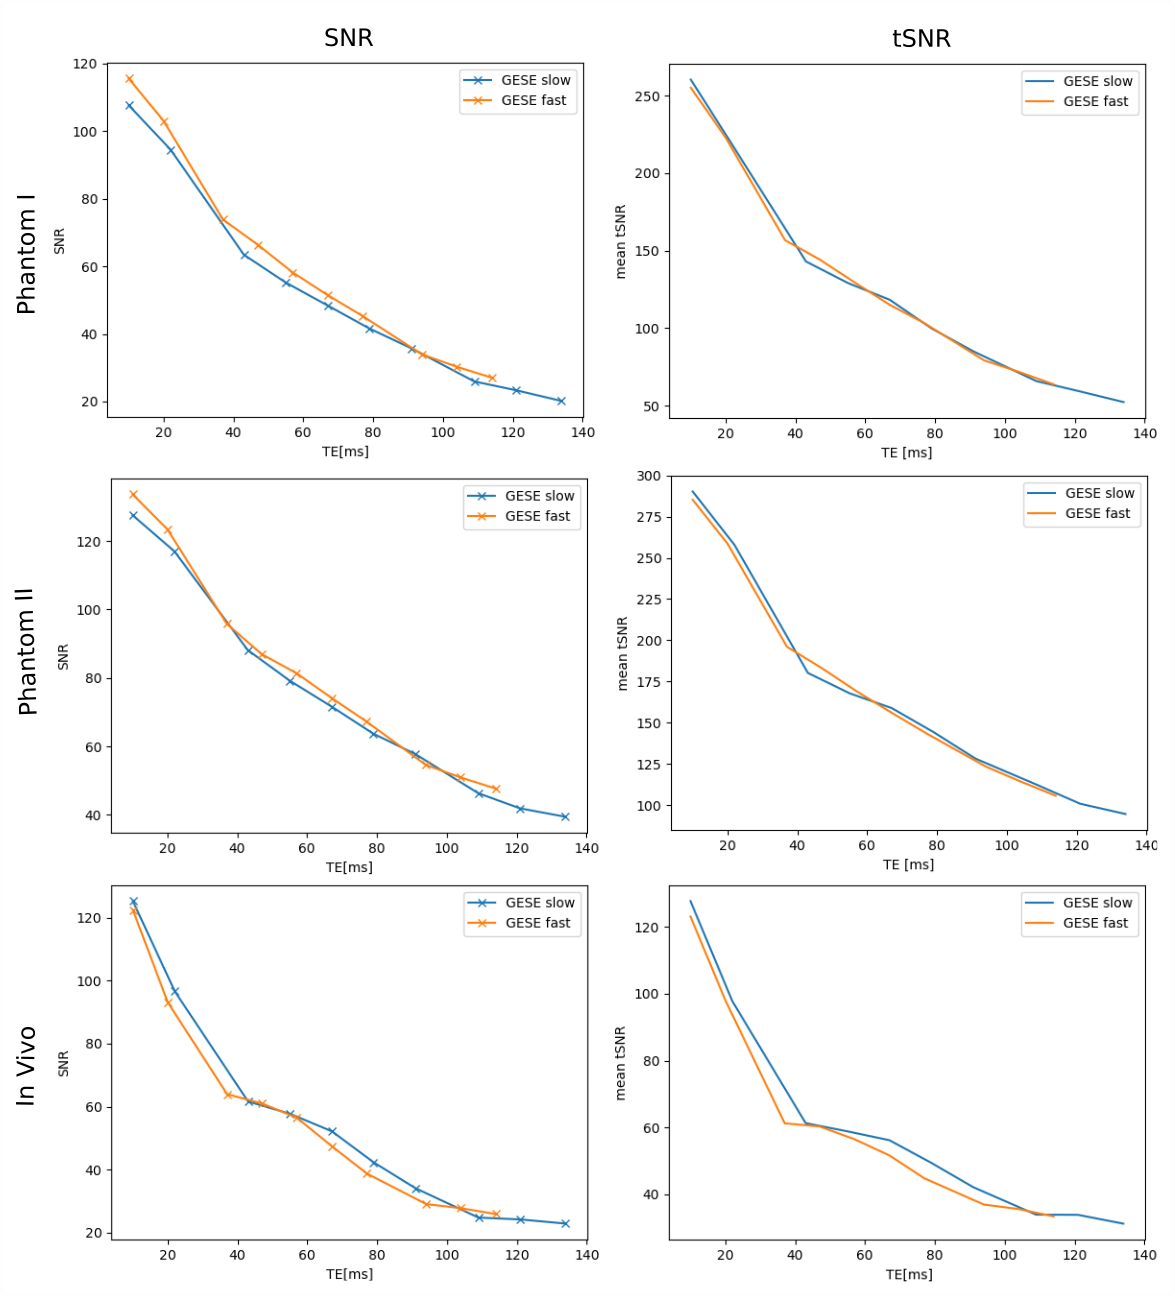
Echoes acquired using GESE-EPIK at different slice locations are depicted in Fig.2. T2/T2* maps from GESE-EPIK and the reference methods for both phantoms are presented in Fig.3 with histograms. While T2*-maps from GESE-EPIK show broader distributions, the mean values of T2/T2* are in good agreement with the reference methods. Fig.4 shows the results for in vivo data. The consistency between GESE-EPIK and the reference methods is shown with good agreement for the mean value and standard deviation. Considering the two different fitting approaches for GESE-EPIK data, it was observed that both approaches show differences smaller than 1ms for the mean values of T2/T2*. WM and GM separation based on SPM masks were successfully performed and yielded T2 values of 69.2+-6.5ms and 63.6+-6.4ms and T2* of 56.2+-9.3ms and 52.0+-9.0ms for GM and WM, respectively. As the TE-range of GESE-EPIK depends on the keyhole and SPARSE factors, the influence of different SPARSE factors on the SNR and tSNR performance was analysed. Results for phantom and in vivo data are presented in Fig.5, showing the mean SNR/tSNR for each echo, acquired using two different implementations with a SPARSE factor of 7 (TEmax=134ms) and 14 (TEmax=114ms).Discussion and Conclusion
A fast imaging technique for simultaneous T2 and T2* quantification within one minute was shown to provide artefact-free images with increased resolution and number of echoes while providing relatively short TEs. SNR analysis underlined the suitability of high SPARSE-factors for TE reduction as no significant loss in SNR or temporal stability was observed in either the phantom or in vivo data. The phantom and in vivo results showed good internal consistency for both relaxation parameters obtained from GESE-EPIK and reference methods while showing distinct differences between WM and GM ROI. Compared to literature T2* values13 of 50.0+-5.6ms and 55.7+-8.72ms, good agreement was observed, while T2 values were found to be below the literature values14 (WM:83.9+-10.6/GM:85.6+-11.1ms). Further in vivo measurements are planned to provide generalised results and application to T2’ and OEF calculation. In conclusion, 10-echo GESE-EPIK is a technique for fast multi-parametric imaging of the human brain, providing T2 and T2* maps with good agreement to reference methods. A variety of parameters and applications can be investigated using the method.Acknowledgements
Hereby, I would like to show my gratitude to my supervisor Prof. N. J. Shah and coauthor Dr. S. Yun for their expertise and assistance. Next to this, we thank our colleagues, the MTAs and the organizational team from the INM-4 institute for their support.References
1 Oshio K, et al. GRASE (Gradient- and Spin-Echo) Imaging: A Novel Fast MRI Technique. Magnetic Resonance in Medicine 1991, 20,344-349.
2 Kiselev VG, et al. Vessel Size Imaging in Humans. Magnetic Resonance in Medicine 2005, 53:553–563.
3 Donahue K, et al. Simultaneous Gradient-Echo/Spin-Echo EPI of Graded Ischemia in Human Skeletal Muscle. JMRI 1998, 8:1106+1113.
4 Yin Y, Zhang Y, and Gao JH. Dynamic Measurement of Oxygen Extraction Fraction Using a Multiecho Asymmetric Spin Echo (MASE) Pulse Sequence. Magnetic Resonance in Medicine 2018, 80:1118–1124.
5 Schmiedeskamp H, et al. Multiple gradient- and spin-echo EPI acquisition technique with z-shimming to compensate for susceptibility-induced off-resonance effects. Proc. Intl. Soc. Mag. Reson. Med. 17, 2009.
6 Schmiedeskamp H, et al. Compensation of Slice Profile Mismatch in Combined Spin- and Gradient-Echo Echo-Planar Imaging Pulse Sequences. Magnetic Resonance in Medicine 2012, 67:378–388.
7 Zaitsev M, Zilles K, Shah NJ. Shared k-space echo planar imaging with keyhole. Magnetic Resonance in Medicine 2001, 45(1):109-17.
8 Shah NJ, da Silva NA, Yun S. Perfusion weighted imaging using combined gradient/spin echo EPIK: Brain tumour applications in hybrid MR-PET. Hum Brain Map 2019.
9 Kueppers F, Yun S, Shah NJ. A Novel 10-echo GESE multi-parametric sequence based on the EPIK readout for simultaneous quantification of T2 and T2*. Proc. Intl. Soc. Mag. Reson. Med. 28 (2020) – 3158.
10 Stoecker T and Shah NJ. MP-SAGE: A New MP-RAGE Sequence With Enhanced SNR and CNR for Brain Imaging Utilizing Square-Spiral Phase Encoding and Variable Flip Angles. Magnetic Resonance in Medicine 2006, 56:824 – 834.
11 Dierkes T, Neeb H, Shah NJ.Distortion correction in echo-planar imaging and quantitative T2* mapping. International Congress Series 2004, 1265:181-185.
12 Mallat SG and Zhang Z. Matching Pursuits With Time-Frequency Dictionaries. IEEE Transactions On Signal Processing Vol 41, No 12, 1993.
13 Oros-Peusquens AM, et al. A Single-Scan, Rapid Whole-Brain Protocol for Quantitative Water Content Mapping With Neurobiological Implications. Applied Neuroimaging – Frontiers in Neurology 2019.
14 Oros-Peusquens AM, et al. Magnetic field dependence of the distribution of NMR relaxation times in the living human brain. Magn Reson Mater Phy 2008, 21:131–147.
Figures