1824
The Effect of Transmit B1 Inhomogeneity on Hyperpolarized [1-13C]-Pyruvate Metabolic MR Imaging Biomarkers1Department of Imaging Physics, The University of Texas M.D. Anderson Cancer Center, Houston, TX, United States, 2GE Healthcare, Dallas, TX, United States, 3The University of Texas M.D. Anderson Cancer Center UT Health Graduate School of Biomedical Sciences, Houston, TX, United States
Synopsis
Accurate signal excitation is imperative when conducting hyperpolarized 13C MRI studies. It has been determined from previous work that greater than ±10% deviation in excitation angle can lead to significant excitation angle dependent errors in kinetic analysis of HP [1-13C] pyruvate to lactate conversion. This work was conducted to characterize the B1+ field homogeneity of a 13C volume transmit clamshell coil. Furthermore, an assessment of the impact of potential B1+ inhomogeneities on semi-quantitative and quantitative hyperpolarized metabolic MR imaging biomarkers was conducted.
Introduction
A specialized Helmholtz-style 13C volume transmit coil1,2 was originally designed to support the acquisition of clinical hyperpolarized [1-13C]-pyruvate magnetic resonance imaging (HP MRI) data in the setting of prostate cancer3 and has been used for acquisitions in other anatomical regions, such as the heart, brain, and kidneys.4-7 Due to the widespread use of this 13C clamshell coil design in both pre-clinical and clinical HP [1-13C]-pyruvate MRI studies, it is critical that the B1+ field inhomogeneity present in the coil is fully characterized. The goal of this study was to characterize the B1+ field of the 13C clamshell coil and assess the impact of inhomogeneities on semi-quantitative and quantitative imaging biomarkers of metabolism.Methods
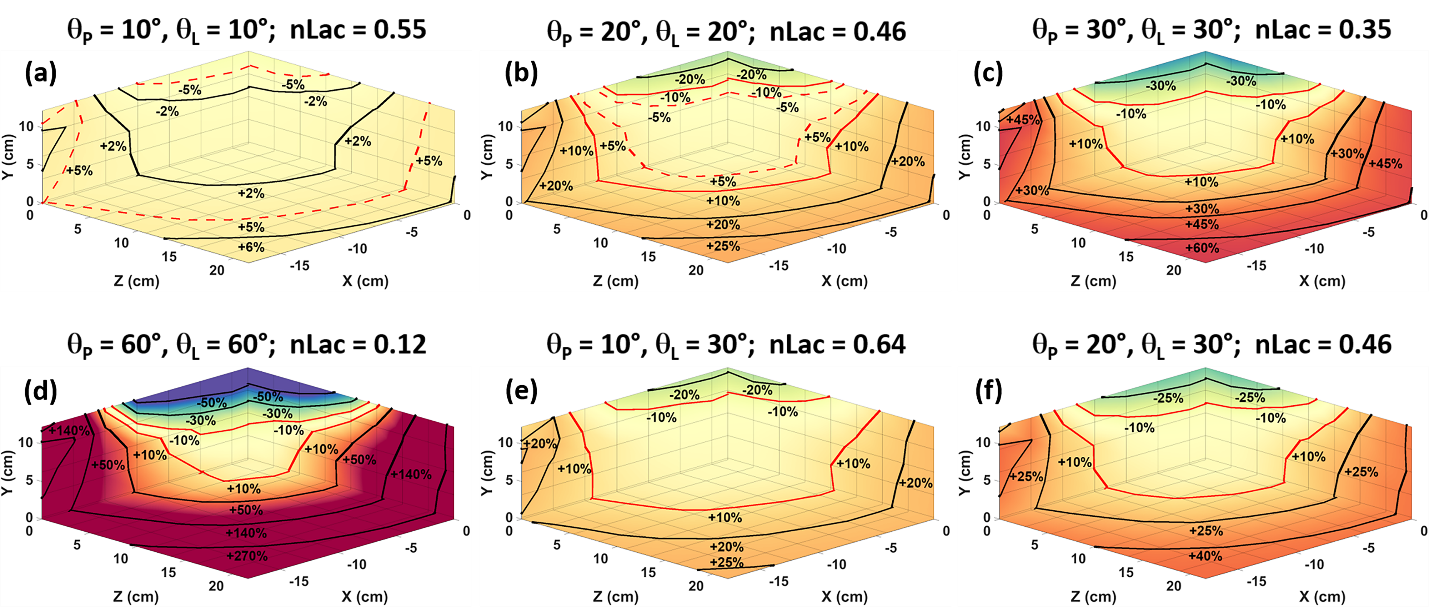
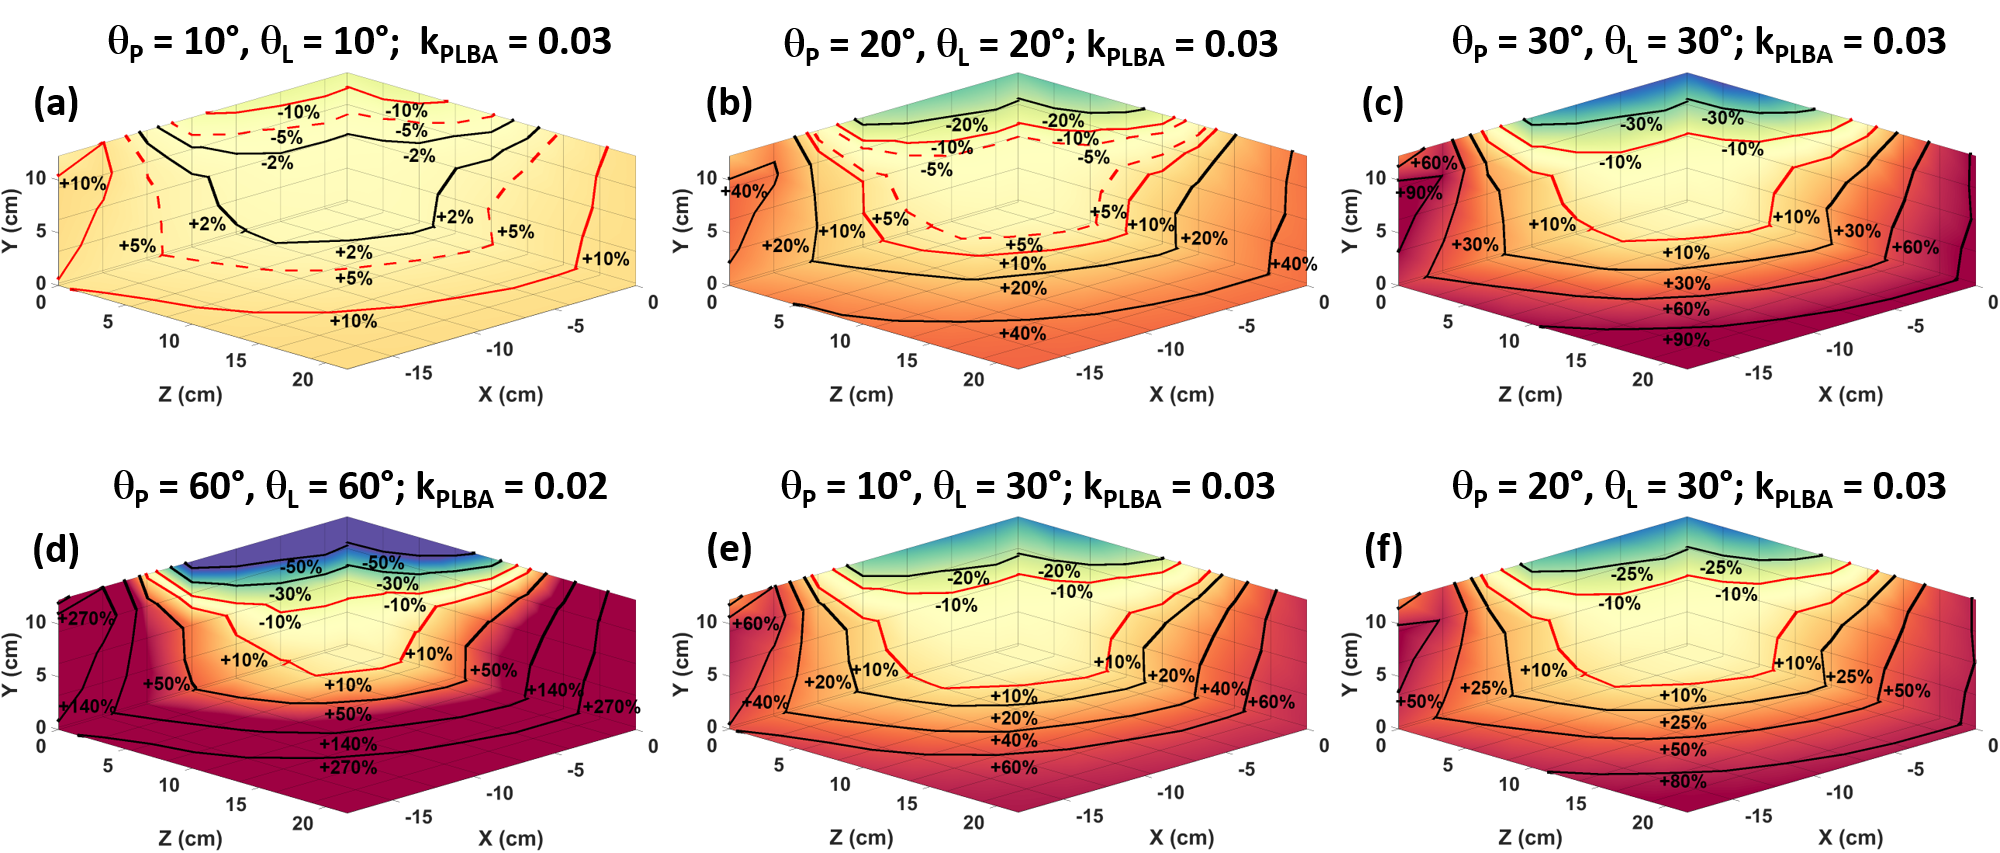
The B1+ field of the 13C volume transmit clamshell coil was mapped by hand using a network analyzer (4395A, Agilent) equipped with a S-parameter test set (87511A, Agilent) and supported by natural abundance 13C dimethyl silicone phantom based double angle B1+ maps acquired on a GE 3T MRI scanner.8 A 2-compartment pharmacokinetic (PK) model9 was then used to simulate signal evolution as a function of measured local excitation angles, for various nominal excitation angle strategies, which were assumed to be accurately calibrated at isocenter. These signals were quantified according to the normalized lactate ratio (nLac) and the apparent rate constant for the conversion of pyruvate into lactate (kPL) using a simple precursor-product model and assuming that the nominal excitation calibration was globally accurate. Throughout the remainder of this work, kPLBA refers to synthetic data generated using model B (with two physical compartments) and fit using model A (a simpler single compartment, precursor-product relationship). The percent difference between these metabolic imaging biomarker maps and the true value observed at the center of the homogeneous central region of the clamshell coil was calculated to estimate the potential for error due to position within the clamshell coil. Finally, we identified acceptable regions within the 13C clamshell coil where deviations in B1+ field inhomogeneity and imaging biomarkers imparted by the B1+ field were within ±10%.Results
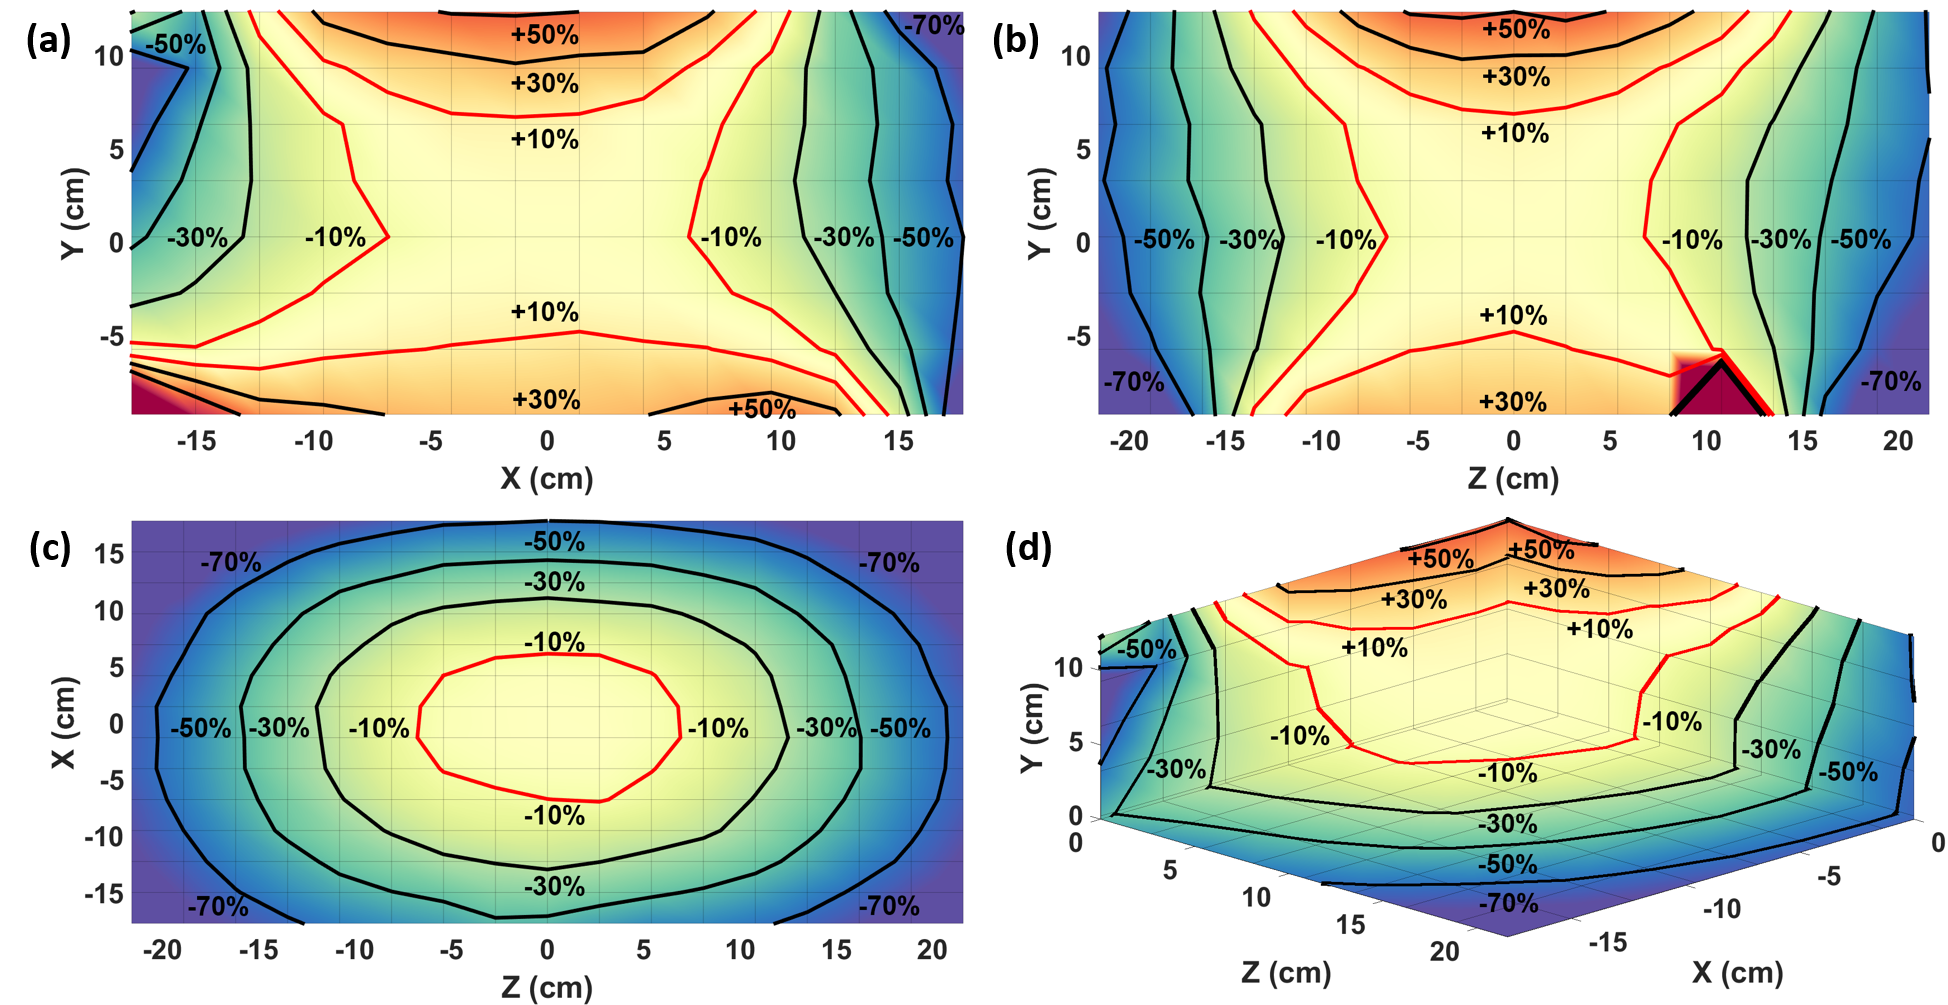
It has been determined from previous work10 that greater than ±10% deviation in excitation angle can lead to significant errors in kinetic analysis and kPL. Hand measured B1+ field maps (Figure 1) of the clamshell coil show that a limited volume encompassed by a rectangular region measuring approximately 12.9 x 11.5 x 13.4 cm (X-direction, Y-direction, Z-direction) centered in the coil will produce deviations in the B1+ field within ±10% (Figure 1) of that at isocenter. The axial and sagittal views (Figure 1a-b) of the hand measured B1+ field maps show increased B1+ field sensitivity in the Y-direction as the B1+ field approaches the coil elements of the clamshell coil. These views also show a distinct hourglass shape, originating at coil isocenter, that extends in the X-direction and Y-direction in the axial view (Figure 1a) and the Z-direction and Y-direction in the sagittal view (Figure 1b).The normalized lactate ratio (nLac) was calculated from synthetic data for six excitation angle schemes (Figure 2). The case when θP = 10° and θL = 10° (Figure 2a) produced the largest volumetric region with deviations within ±10% nLac. kPLBA values were derived by PK analysis of data from the same six excitation angle schemes (Figure 3). The case when θP = 10° and θL = 10° (Figure 3a) produced the largest volumetric region with measured kPLBA deviations within ±10%.
Discussion and Conclusion
This work shows that using an excitation angle scheme of θP = 10° and θL = 10° produces the largest volumetric region with errors in nLac (Figure 2a) and kPLBA (Figure 3a) within ±10%. However, in HP 13C MRI there is always a tradeoff between excitation angle and the signal-to-noise ratio (SNR). Lower excitation angles may produce better B1+ uniformity, but that will come at the expense of a reduction in SNR. Lower excitation angles could also promote a temporal averaging effect that will reduce sensitivity to dynamic content with a higher temporal frequency.11 Therefore, it could be beneficial to utilize acquisition strategies in which the excitation angle for lactate is higher than the excitation angle for pyruvate. Therefore, for the nLac and kPLBA cases highlighted in this work, the data suggests employing an excitation angle strategy of θP = 10° and θL = 30° (Figure 2e, 3e), which would minimize B1+ errors in metabolic analysis of hyperpolarized pyruvate when utilizing the clamshell coil and maximize the volumetric region available for target anatomy placement.Positioning of target anatomy in an inhomogeneous field can lead to errors in kinetic analysis. Therefore, it is of the utmost importance to precisely place target anatomy in the central region of the coil. This work identifies the region of the clamshell coil where excitation angles will be reproducible and well calibrated throughout the field-of-view.
Acknowledgements
This work was supported by funding from the National Cancer Institute of the National Institutes of Health (R01CA211150). The content is solely the responsibility of the authors and does not necessarily represent the official views of the National Institutes of Health.References
1. Tropp J, Lupo JM, Chen A, et al. Multi-channel metabolic imaging, with SENSE reconstruction, of hyperpolarized [1-(13)C] pyruvate in a live rat at 3.0 tesla on a clinical MR scanner. J Magn Reson. 2011;208(1):171–177. doi:10.1016/j.jmr.2010.10.007
2. Autry AW, Gordon JW, Carvajal L, et al. Comparison between 8- and 32-channel phased-array receive coils for in vivo hyperpolarized (13) C imaging of the human brain. Magn Reson Med. 2019;82(2):833-841.
3. Nelson SJ, Kurhanewicz J, Vigneron DB, et al. Metabolic imaging of patients with prostate cancer using hyperpolarized [1-(1)(3)C]pyruvate. Sci Transl Med. 2013;5(198):198ra108.
4. Cunningham CH, Lau JY, Chen AP, et al. Hyperpolarized 13C Metabolic MRI of the Human Heart: Initial Experience. Circ Res. 2016;119(11):1177-1182.
5. Miloushev VZ, Granlund KL, Boltyanskiy R, et al. Metabolic Imaging of the Human Brain with Hyperpolarized (13)C Pyruvate Demonstrates (13)C Lactate Production in Brain Tumor Patients. Cancer Res. 2018;78(14):3755-3760.
6. Park I, Larson PEZ, Gordon JW, et al. Development of methods and feasibility of using hyperpolarized carbon-13 imaging data for evaluating brain metabolism in patient studies. Magn Reson Med. 2018;80(3):864-873.
7. Tran M, Latifoltojar A, Neves JB, et al. First-in-human in vivo non-invasive assessment of intra-tumoral metabolic heterogeneity in renal cell carcinoma. BJR Case Rep. 2019;5(3).
8. Reed GD, Schulte RF, Park JM, Malloy CR, Hansen RB, Chen AP. Protocol for multi-site quantitative evaluation of 13C radio frequency coils. Abstract from ISMRM 27th Annual Meeting & Exhibition, Montréal, Canada. 2019.
9. Bankson JA, Walker CM, Ramirez MS, et al. Kinetic Modeling and Constrained Reconstruction of Hyperpolarized [1-13C]-Pyruvate Offers Improved Metabolic Imaging of Tumors. Cancer Res. 2015;75(22):4708-4717.
10. Sun CY, Walker CM, Michel KA, Venkatesan AM, Lai SY, Bankson JA. Influence of parameter accuracy on pharmacokinetic analysis of hyperpolarized pyruvate. Magn Reson Med. 2018;79(6):3239–3248. doi:10.1002/mrm.26992
11. Bankson, J.A., Michel, K.A., Xu, Z., Harlan, C.J., Martinez, G., & Walker, C.M. The Filtering Effect of Signal Excitations on Hyperpolarized Imaging Agents. Abstract from ISMRM 28th Annual Meeting & Exhibition, Virtual. 2020.
Figures