1822
Glycogen Synthesis and Glucose Utilization at 3T using Localized Spectroscopy and Chemical Shift Imaging1NIH/NCI, Bethesda,, MD, United States, 2NIH/NINDS, Bethesda,, MD, United States
Synopsis
Aberrant glycogen metabolism has been implicated in vitro as a possible causative factor in multiple disorders. Progress has been stymied due to the rapid degradation of glycogen post mortem and the lack of methods for measuring glycogen metabolism in vivo. We show here that glucose metabolism and local synthesis of glycogen can be measured in mice by short echo PRESS following a single bolus of unlabeled glucose using a standard 3T preclinical MRI using low rank reconstruction. Imaging of glycogen synthesis was possible at 9.4T by CSI, where it was found in mice to be centered on the olfactory bulb
Main Findings
Glycogen metabolism and glucose utilization in mice can be followed in brain tissue semi-quantitatively by proton localized MRS using standard 3T preclinical imaging systems.Introduction
Introduction Recent studies have pointed to glycogen an essential participant in brain function. When this function is disturbed, as is believed to happen in Alzheimer’s and certain metabolic diseases, neuronal death can result. Glycogen status has proven difficult to study as it is tightly regulated and sensitive to cellular conditions.(1) Under stress conditions, such as those typically occurring during post mortem analysis, glycogen degradative enzymes are rapidly activated.(2) An in vivo method of measuring glycogen synthase activity would be helpful in this aspect but has been hampered by the weak, broad signal and slow timescale at which synthesis occurs, which limits traditional and hyperpolarized approaches, respectively.Methods
For localized PRESS spectra, a standard 17 cm bore Bruker BioSpec 3T preclinical imaging system was used with a 3 mm x 3 mm x 3mm voxel size, a 2 second repetition time, a sweep width of 10 ppm, a 16 second or 97 second echo time (as indicated) and 512 FID points. The experiment was repeated 3000 times for a 100 minute acquisition time. Glucose was given as a 50 mg IV bolus except as indicated. 8 x 8 CSI experiments were acquired on a 9.4 T Biospec 94/30 horizontal scanner using a homebuilt head saddle coil with a 20 mm FOV and 6 mm slice thickness with a a 2 second repetition time, a sweep width of 10 ppm and 512 FID points. Low rank reconstruction to reduce noise was performed as in (3) using a rank of 5 (PRESS) or 5x8x8x10 (CSI)Results
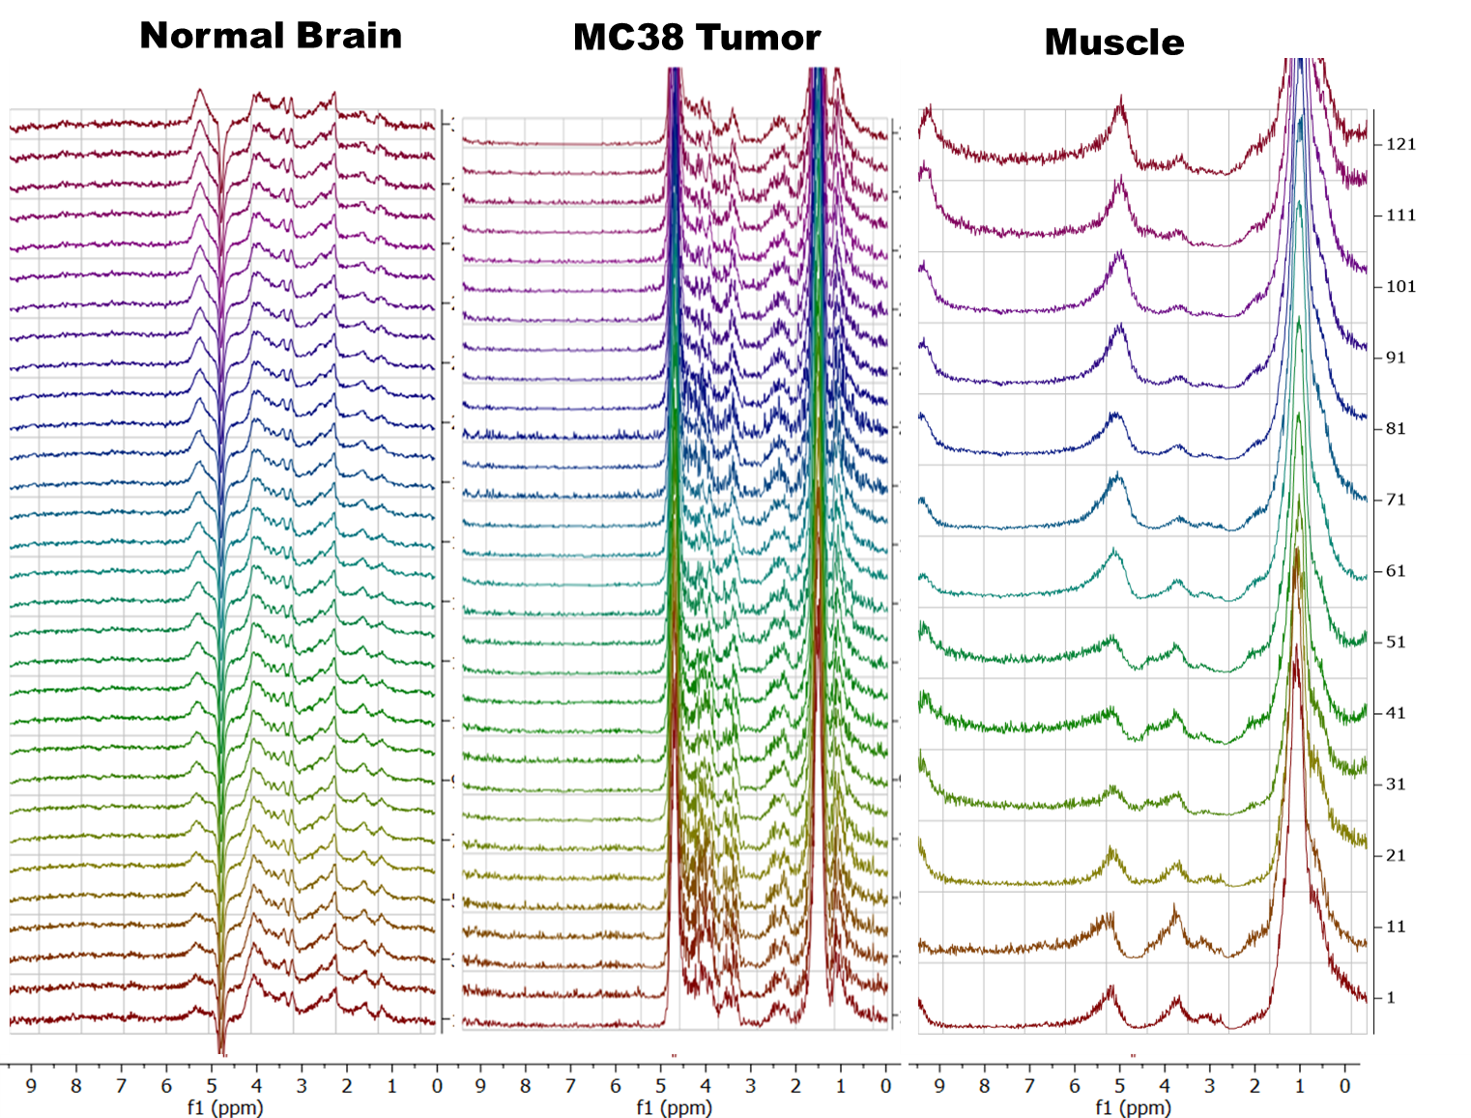
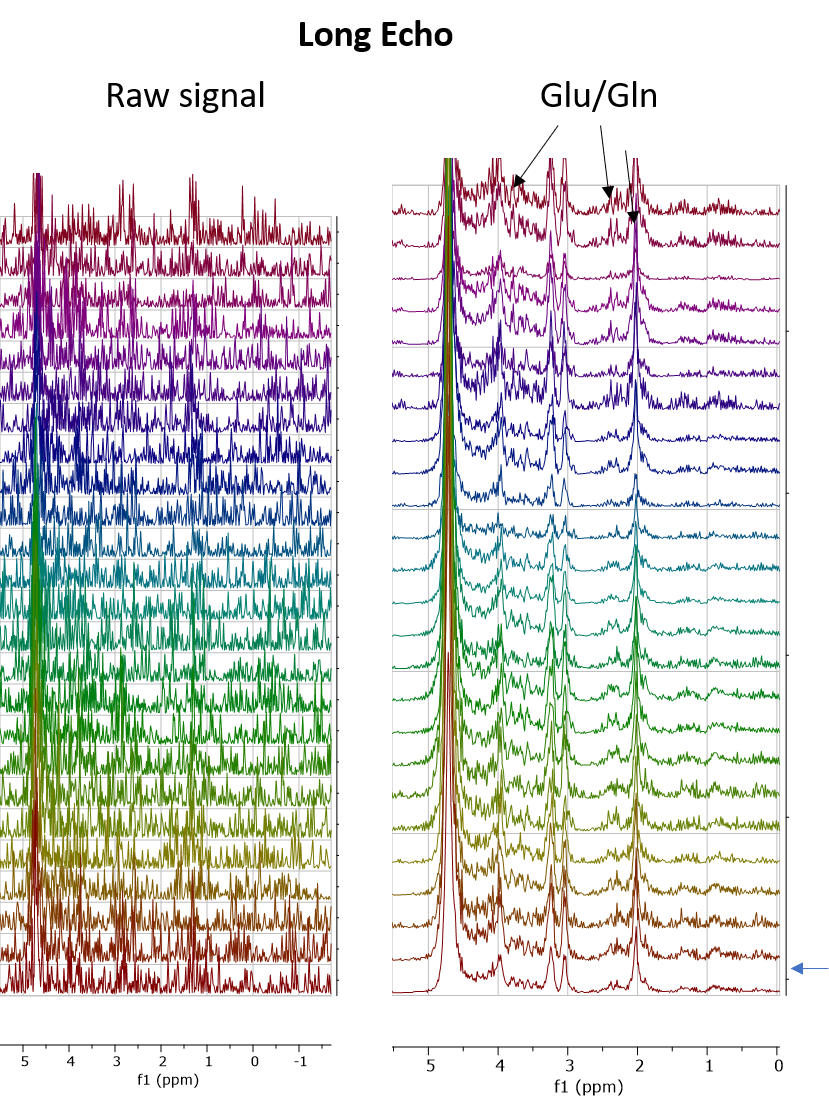
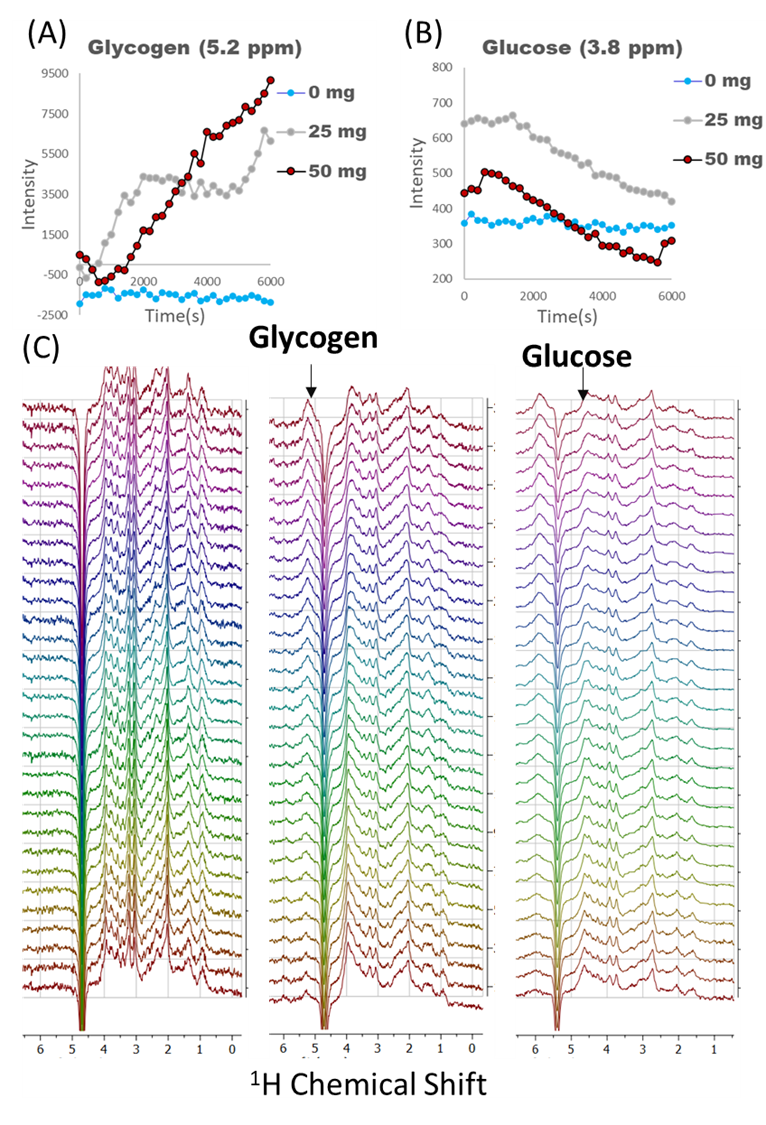
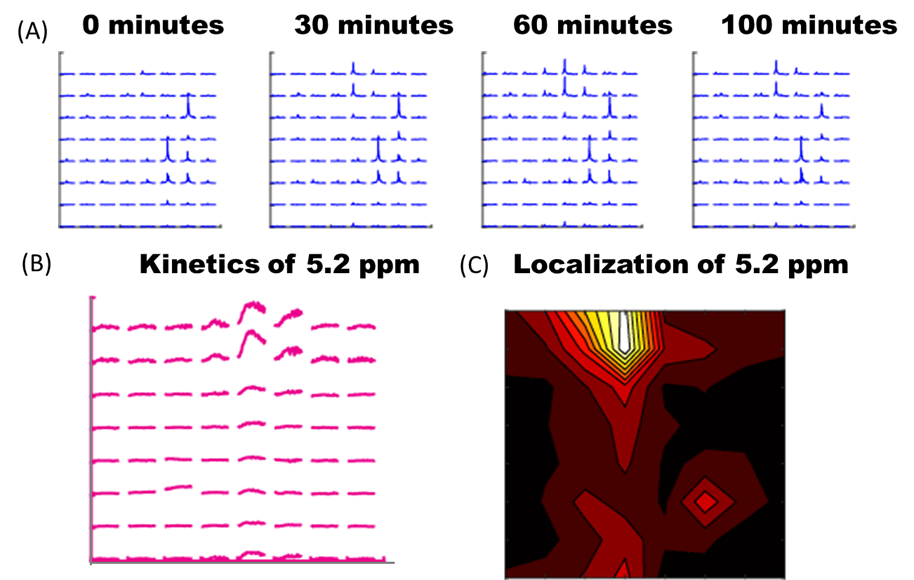
Figure 1 shows sequential PRESS spectra after denoising for after the injection of a 50 mg bolus for a 2 mm x 2 mm 2mm voxel centered (A) in the left hemisphere of a normal mouse brain, (B) on a MC38 colon cancer subcutaneous leg xenograft on the left leg of a mouse, and (C) in normal mouse muscle. The time evolution of the spectra is very different in each tissue. Brain tissue (A) shows a steady uptake of glucose (broad peak near 3.8 ppm) followed by a decrease suggestive of metabolism. This decrease is mirrored by an increase near 5.2 ppm, which is characteristic of glycogen. These changes were dose dependent and did not occur in a sham injection devoid of glucose (Figure 2). The MC38 cancer xenograft (B) shows rapid uptake and metabolism of glucose (presumably to lactate) without production of glycogen. As expected, muscle tissue (C) shows an intense glycogen peak but is nearly static – there is no evolution of any peak during the course of the hour long experiment. Glucose and glycogen are the dominant peaks at short (16 ms) echo times. At longer (97 ms) echo times, the metabolism of glucose to glutamine/glutamate can be seen by the emergence of a peaks at 2.26 ppm (Figure 3 right), although the intensity is very weak and can only be detected after low rank denoising (Figure 3 left). The results for localized spectroscopy encouraged us to try imaging, using a higher field (9.4T instead of 3T as in the previous experiments) to compensate for reduced signal averaging and greater linewidth. Figure 4A shows the evolution of spectra in the coronal plane after the injection of the glucose bolus. Although most peaks remain static, large changes in the intensity of a single peak at the glycogen position near 5.2 ppm are evident at the extreme anterior edge. This would localize glycogen synthesis form glucose near the olfactory bulb, in agreement with post mortem localization of glycogen synthase (Figure 4C). A map of the time evolution of the 5.2 ppm peak (Figure 4B) shows it rapidly increases in intensity within the first 30 minutes before plateauing.Conclusion
Static levels of glycogen have been studied intensively by MRS but the activity of glycogen synthase and the dynamic response of the glycogen pathway have been difficult to study. Glycogen synthesis and glucose utilization can be measured and imaged semi-quantitatively pre-clinically following a bolus injection of glucose using noise reduction by rank reduction to measure the glycogen and glucose peaks against a background of noise.Acknowledgements
No acknowledgement found.References
1 Dienel G.A., Carlson G.M. (2019) Major Advances in Brain Glycogen Research: Understanding of the Roles of Glycogen Have Evolved from Emergency Fuel Reserve to Dynamic, Regulated Participant in Diverse Brain Functions. In: DiNuzzo M., Schousboe A. (eds) Brain Glycogen Metabolism. Advances in Neurobiology, vol 23. Springer, Cham.
2 Hutchins DA, Rogers KJ (1970) Physiological and drug-induced changes in the glycogen content of mouse brain. Br J Pharmacol 39:9–25
3 Brender, J.R., Kishimoto, S., Merkle, H. et al. Dynamic Imaging of Glucose and Lactate Metabolism by 13C-MRS without Hyperpolarization. Sci Rep 9, 3410 (2019).
Figures