1818
Towards a Probabilistic Neurochemical atlas via parcellated approach using ZOOM MRSI
Nicholas Farley1, Jaiyta Sood1, Antonia Susjnar2, Sean Lane3, Mark Chiew4, Michael Albert Thomas5, and Uzay Emir1,2
1School of Health Sciences, Purdue University, West Lafayette, IN, United States, 2Weldon School of Biomedical Engineering, Purdue University, West Lafayette, IN, United States, 3Department of Psychological Sciences, Purdue University, West Lafayette, IN, United States, 4Welcome Center for Integrative Neuroimaging, University of Oxford, Oxford, United Kingdom, 5Department of Radiology, University of California Los Angeles, Los Angeles, CA, United States
1School of Health Sciences, Purdue University, West Lafayette, IN, United States, 2Weldon School of Biomedical Engineering, Purdue University, West Lafayette, IN, United States, 3Department of Psychological Sciences, Purdue University, West Lafayette, IN, United States, 4Welcome Center for Integrative Neuroimaging, University of Oxford, Oxford, United Kingdom, 5Department of Radiology, University of California Los Angeles, Los Angeles, CA, United States
Synopsis
To create a probabilistic Neurochemical atlas of the human brain via parcellated approach using ZOOM MRSI, in this study, we aim to quantify the test-retest reliability of the ZOOM MRSI by assessing the stability of the molecular contrasts of the posterior cingulate and cerebellum across two independent scan sessions and by quantifying the intra- and inter-rater reliability of the ZOOM MRSI scan.
Introduction
The human brain's macro anatomical representation has been the primary reference used to define the human brain's subregions for clinical and neurophysiological examinations. Recently, complementary to the macro anatomical architecture of the human brain, functional parcellations have been proposed based on functional MRI (1). These studies have unveiled that macro anatomical parcellations do not overlap functional boundaries, suggesting the potential value of merging different noninvasive imaging modalities as part of an integrated approach to explore the human brain. Magnetic Resonance Spectroscopy (MRS) allows the detection of a variety of molecular components, including N-acetylaspartate (NAA) as a marker of neuronal loss/dysfunction, myo-Inositol (myo-Ins) as a glial marker, and glutamate (Glu) as the primary excitatory neurotransmitter. Thus, molecular maps matching functional and anatomical atlases' resolution are expected to serve as an interface about multiple aspects of the human brain organization. We recently developed a zoom MRSI method that can generate a probabilistic metabolic atlas of the human brain with an in-plane resolution of 2.5 mm x 2.5 mm (2). In this study, we aim to quantify the test-retest reliability of the ZOOM MRSI by assessing the stability of the molecular contrasts of the posterior cingulate and cerebellum across two independent scan sessions and by quantifying the intra- and inter-rater reliability of the ZOOM MRSI scan.Methods
In-vivo scans were performed on 6 healthy volunteers (two for cerebellum and 4 for the posterior cingulate) using a Siemens Prisma 3 Tesla (Siemens, Germany) scanner with a 64 channel receive-only head coil. Written and informed consent was obtained from all participants in the study, which was approved by the relevant institutional ethics committee. ZOOM MRSI was performed using a metabolite-cycled semi-LASER localization with a TE of 32ms and a TR of 2s. Semi-LASER localizations were positioned in the central cerebellar slice and posterior cingulate slices in the transverse plane. The high in-plane nominal resolution of 2.5mm x 2.5mm, with a 10mm thickness, was achieved using a Reduced Field of View (rFOV) = 120mm x 120 mm x 10mm, semi-LASER localization = 100-90 mm x 50-40 mm x 10 mm. A modified version of 2D-Density Weighted Concentric Ring Trajectory (DWCRT) was used in order to cover the 48 x 48 grid in a rFOV (2). MATLAB (R2016b, MathWorks, Natick, MA) was used for reconstruction, and metabolite quantification was performed using the LCModel package (Version 6.3-1M). The normalized metabolite levels were reported for each subject using the water-scaled signal intensity of each metabolite. Furthermore, the test-retest reliability of cortical volume will be evaluated using three different methods: Intraclass Coefficient (ICC), Percent Volume Change (PVC), and Pearson Correlation Coefficient (PCC).Results
Figure 1 shows coronal, sagittal, and axial images of the Montreal Neurological Institute-152 template, including the MRSI slice placement and metabolite maps in MNI space for the cerebellum and posterior cingulate regions. Figure 2 shows the ZOOM MRSI spectra with LCModel fits in the cerebellum and posterior cingulate regions. The resulting normalized Glutamate+Glutamine maps of two healthy subjects for two separate scans (different MRI sessions) are illustrated for both regions in Figure 3, respectively. Figure 4 shows the group-average metabolite maps of normalized metabolite levels in the MNI-152 template space for the cerebellum and posterior cingulate.Discussion and Conclusion
This study demonstrates the advantages of a rFOV (zoom) acquisition which was supplemented with a DW-CRT short TE semi-laser localization to improve the resolution metabolic maps at 3T. The improved resolution and spectral quality-enabled reliable quantification of tNAA, total creatine, total choline, Glutamate+Glutamine, and myo- ins from a nominal voxel volume of 62.5 μL. Glutamate+Glutamine levels were found to be higher in the gray matter cortex than in its white matter counterpart. Additionally, high-quality group average metabolite distributions of tNAA, total creatine, total choline, Glutamate+Glutamine, and myo-ins were achieved via the accurate co-registration between the MRSI and MNI template. Although the missing personalized features during group averaging is unavoidable due to the accuracy of coregistration steps, the group averaged neurochemical maps indicate that averaging across subjects increases the contrast-to-noise ratio sufficiently. These findings suggest that very high-resolution metabolite probing to generate a neurochemical atlas of the human brain is feasible using a parcellated approach via rFOV or ZOOM MRSI at 3 Tesla.Acknowledgements
No acknowledgement found.References
1. Imaging-based parcellations of the human brain | Nature Reviews Neuroscience. https://www.nature.com/articles/s41583-018-0071-7.
2. Emir U, Sood J, Chiew M, Lane S, Thomas M. High-Resolution Metabolic Mapping of the Cerebellum Using 2D Zoom Magnetic Resonance Spectroscopic Imaging. Magnetic Resonance in Medicine 2020.
Figures
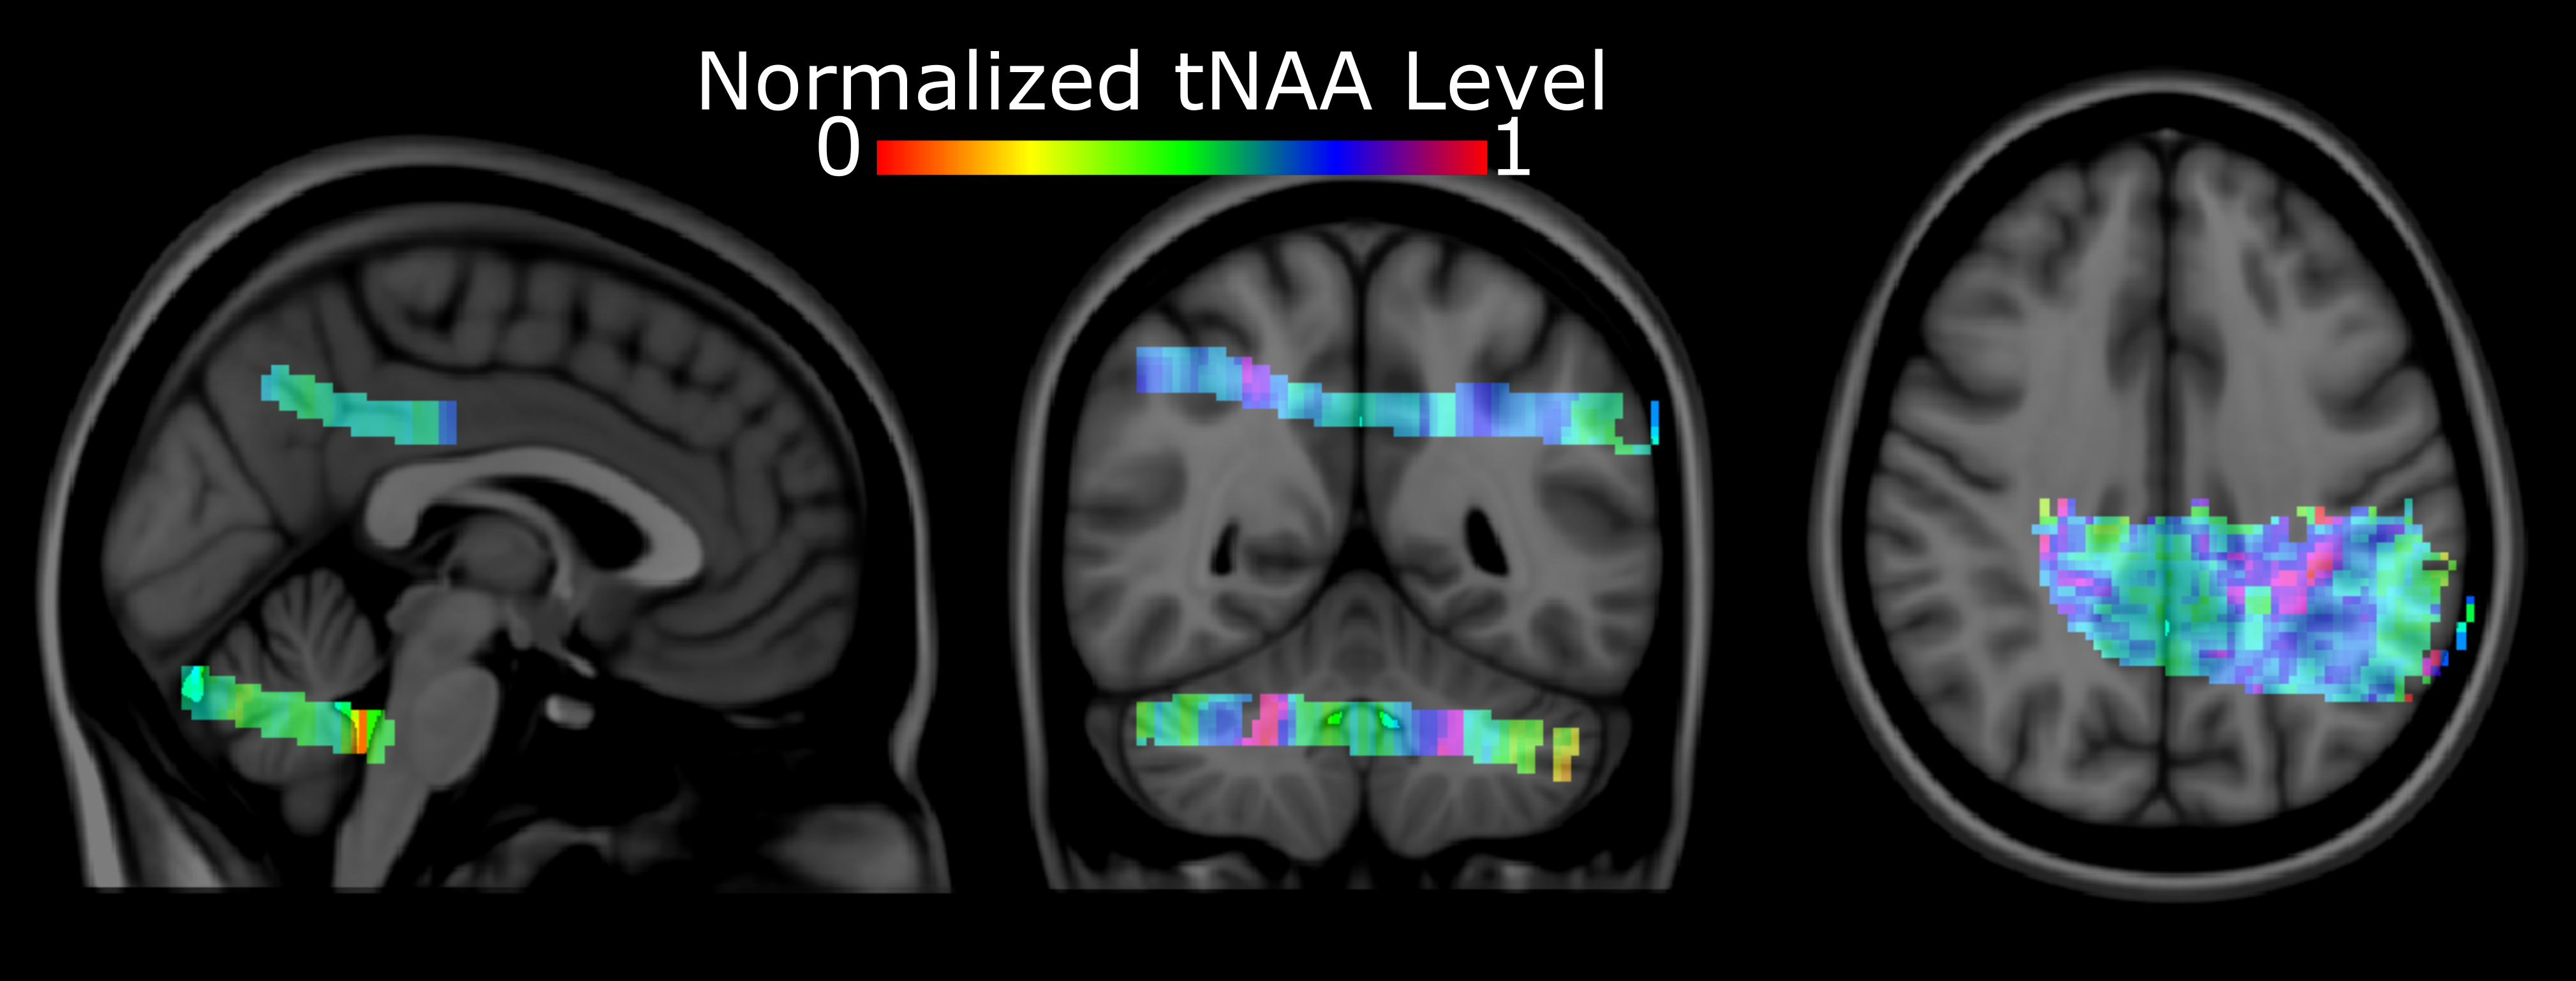
Figure 1: Single-subject
normalized metabolite maps overlaid on the Montreal Neurological Institute-152
template
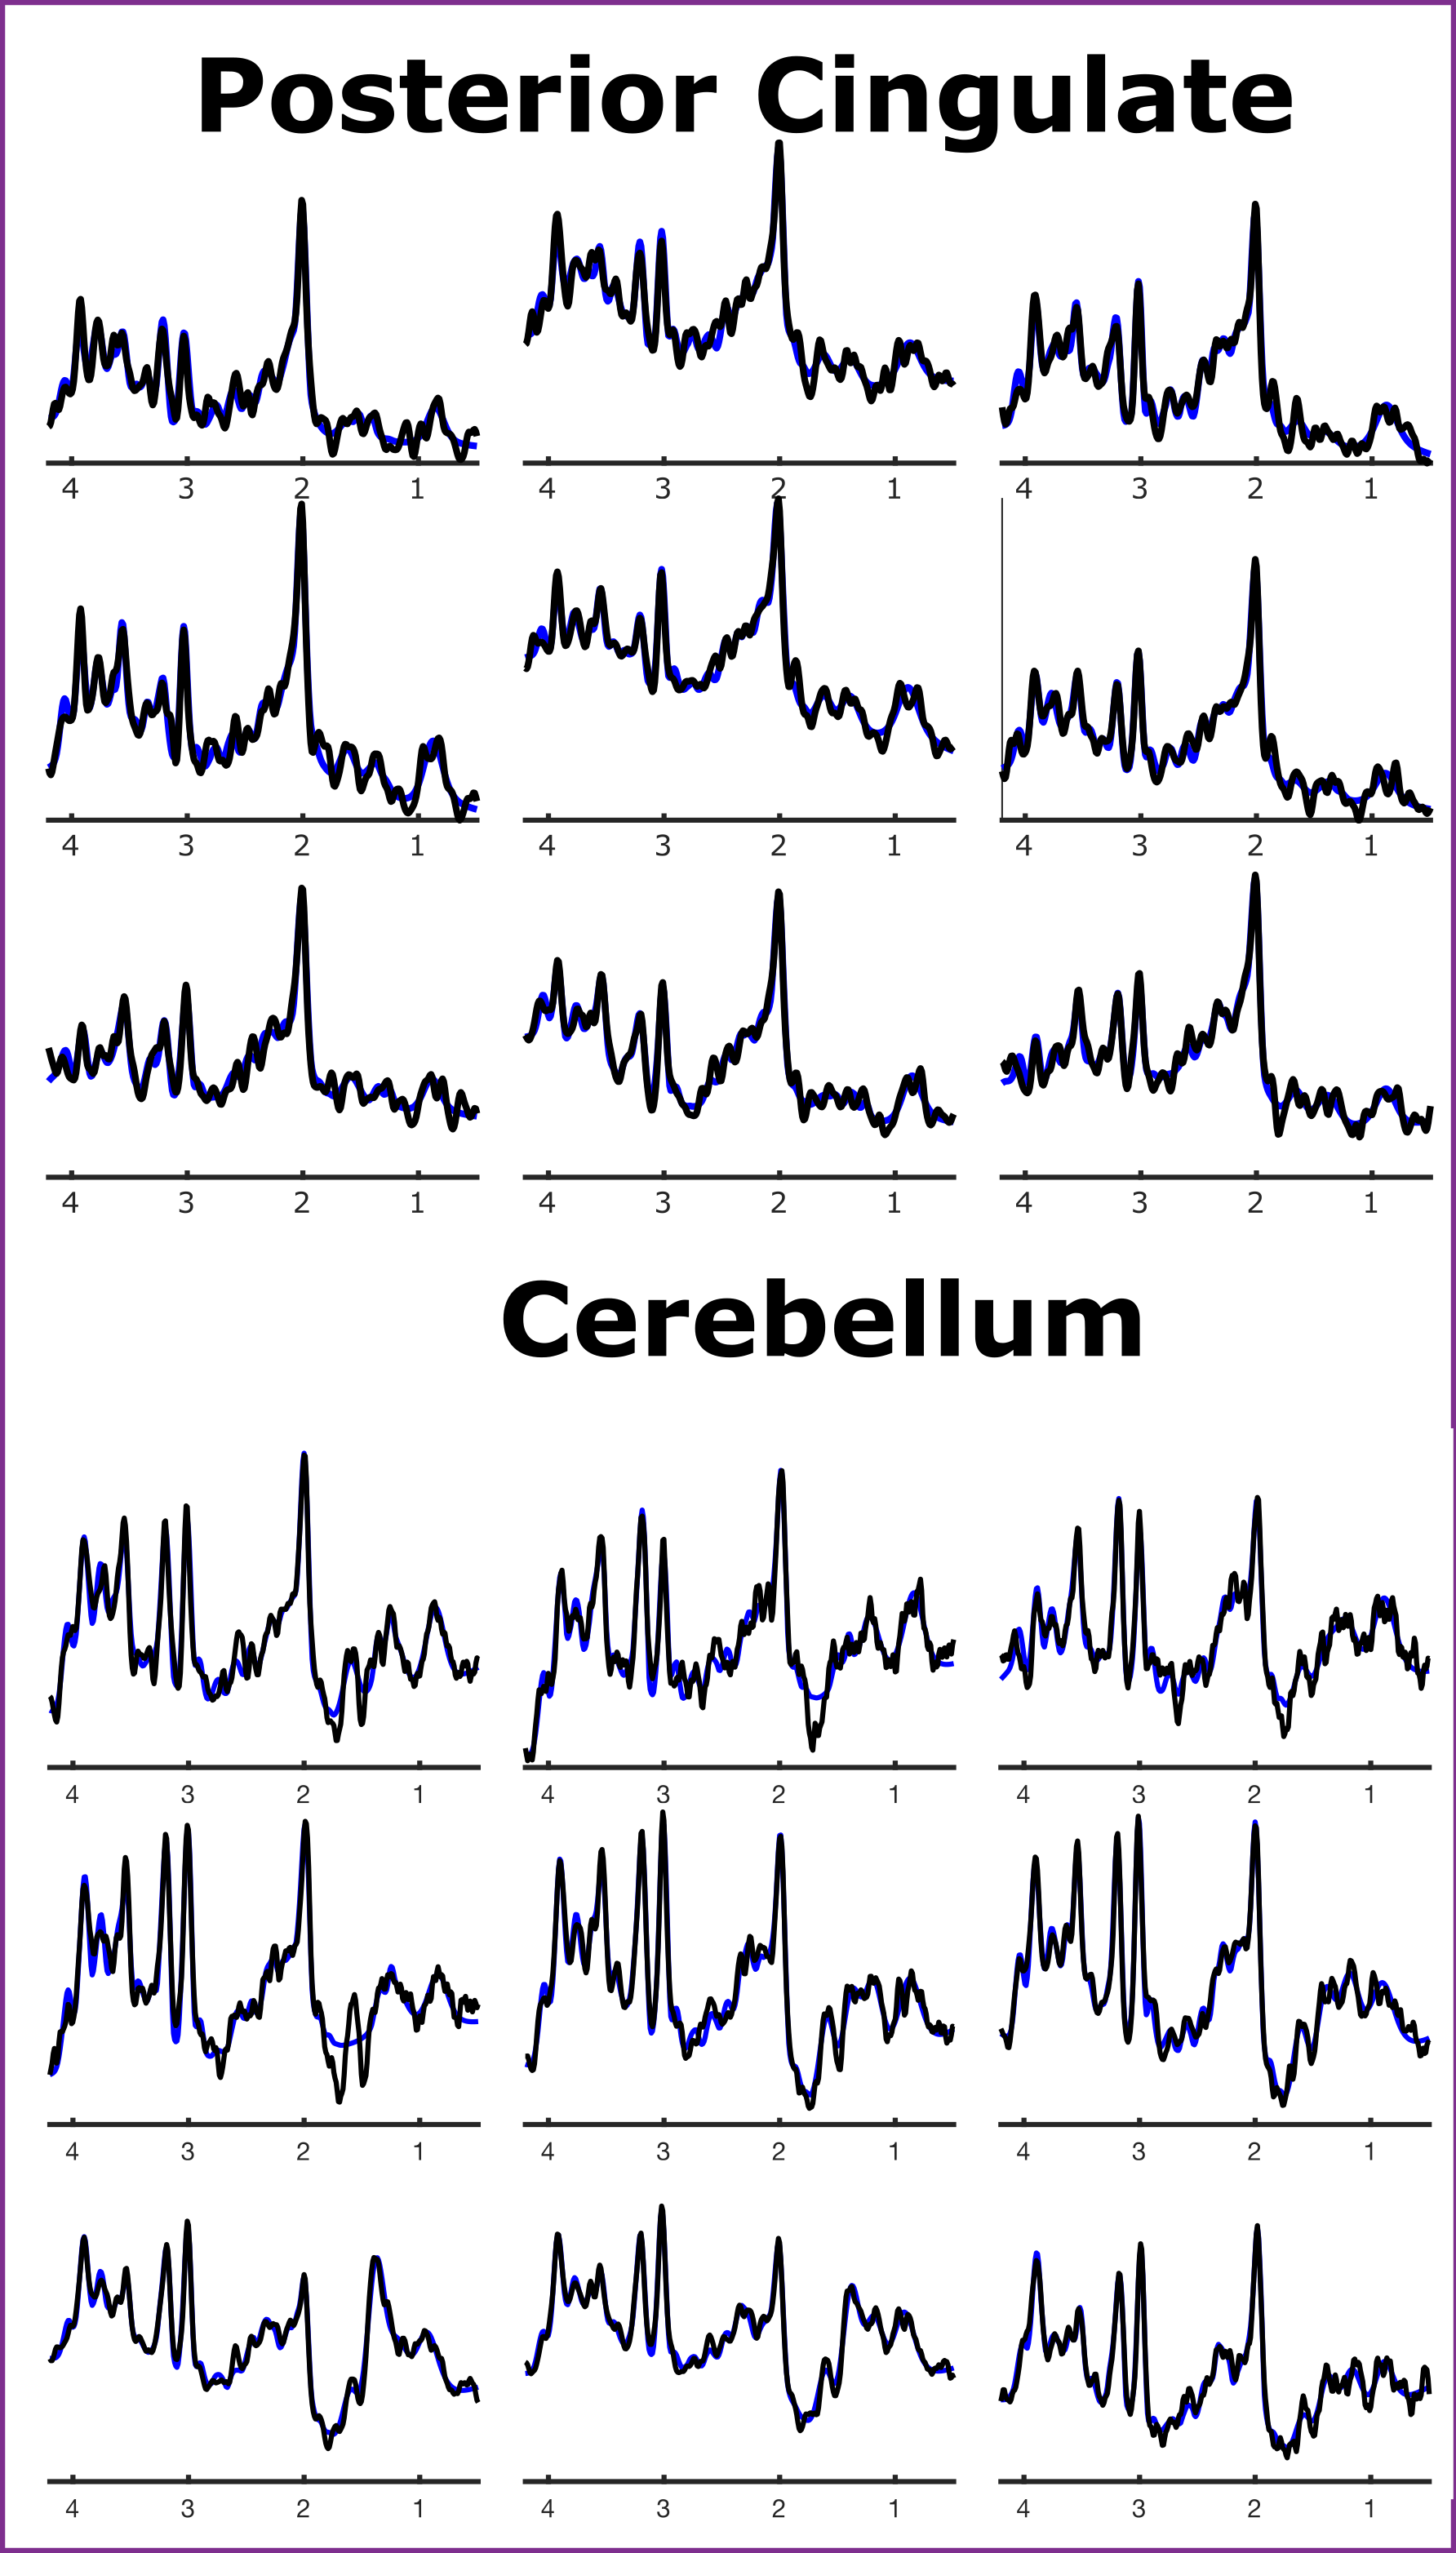
Figure 2: An illustration of the
spectral quality and corresponding LCModel fit for the Posterior Cingulate and
Cerebellum
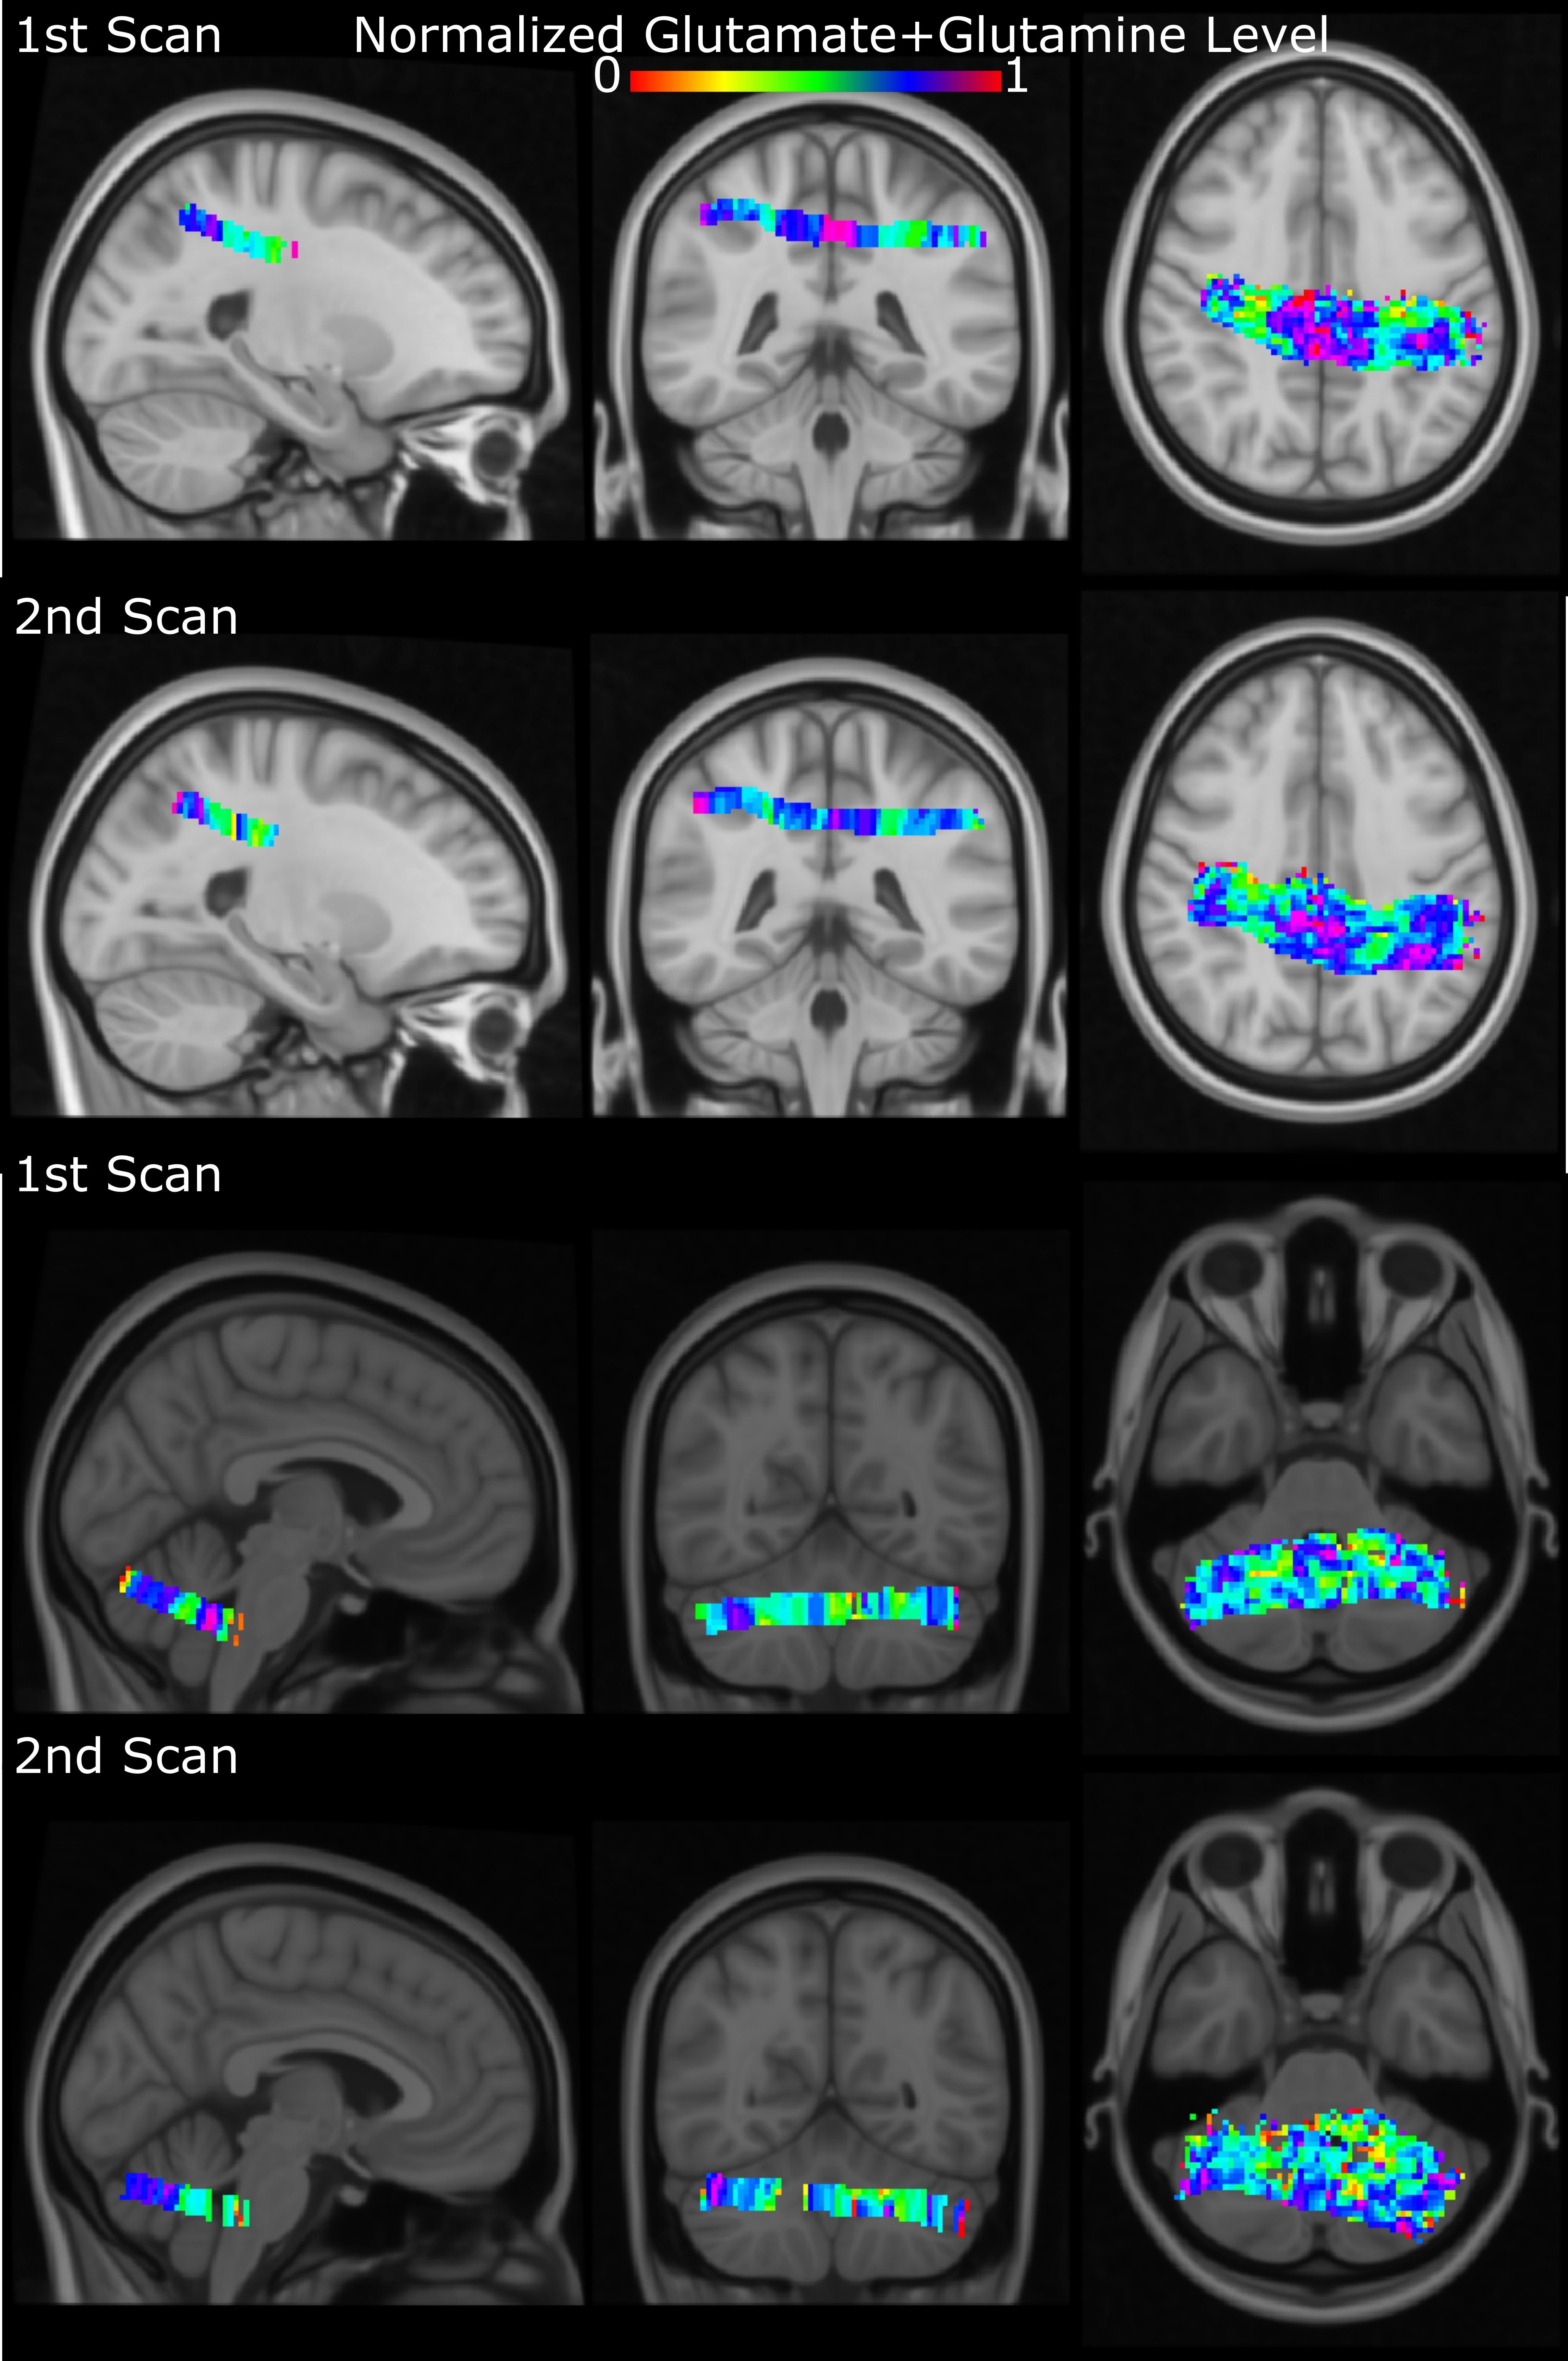
Figure 3: An illustration of first
and second scans’ neurochemical contrasts (Glutamate+Glutamine) for the
posterior cingulate and cerebellum
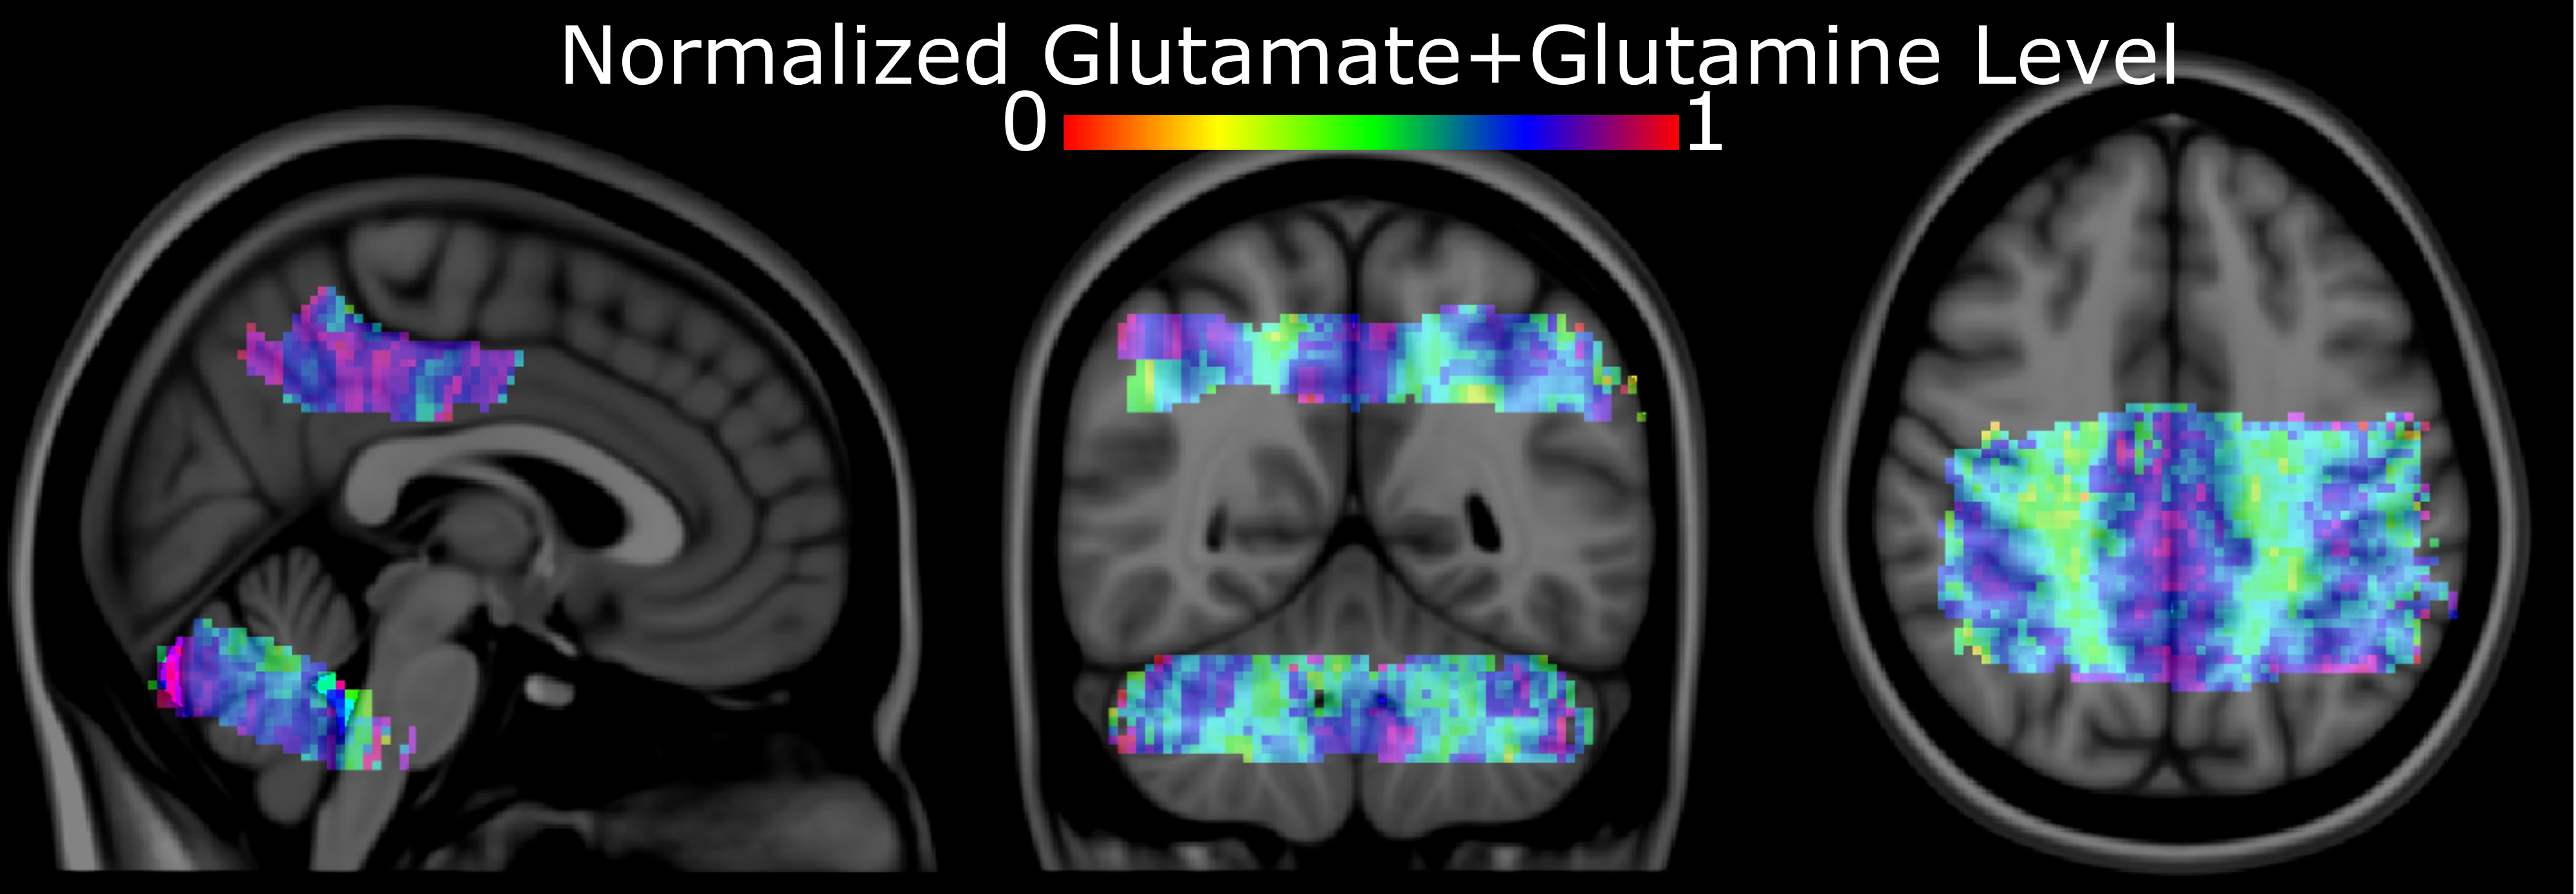
Figure 4: Group-average normalized metabolite
maps overlaid on Montreal Neurological Institute-152