1817
Parametric VARied Saturation (PaVARS) for enhanced CEST characterization of human brain at 3T1Center for Biomedical Imaging Research, School of Medicine, Tsinghua University, Beijing, China, 2Philips Healthcare, Beijing, China, 3School of Information Science and Technology, Northwest University, Xi'an, China
Synopsis
Existing CEST methodologies suffer from low specificity in distinguishing various exchange species in tissue. To further utilize dependence of CEST spectra on saturation length (tsat), power (B1) as well as frequency, we setup a fast acquisition of Parametric VARied Saturation (PaVARS) in a 3T clinical scanner, by separating the seconds-long saturation preparation to 5-8 modules each followed by a low flip-angle readout. On phantoms of three metabolites and human brain, PaVARS enabled fast acquisition of multiple Zspectra, each weighted with different saturation length and power. PaVARS could be a ready-to-use, informative acquisition methods for better differentiation of endogeneous brain metabolites.
Purpose
CEST imaging of various sources of endogenous brain metabolites is drawing great interest but the low specificity in discriminating different exchange species is still a concern. By utilizing the dependence of CEST signal on both saturation (sat.) length and frequency, the Length and Offset Varied Saturation (LOVARS) scheme achieved better-defined lesion boundary and higher CNR in a mouse model of brain tumor at high-field scanners[1]. Another scheme named MeLOVARS further enabled fast acquisition of multiple saturation-weighted images[2]. Herein, we implemented a flexible and user-defined B1 profile for multiple MeLOVARS readouts, termed Parametric VARied Saturation (PaVARS). Using a 3T clinical scanner, PaVARS were tested on phantoms of three metabolites and human brain, to see whether it can provide stable images and spectra for better characterization of endogenous contrast from amide, amine, and NOE signals from lipids.Methods
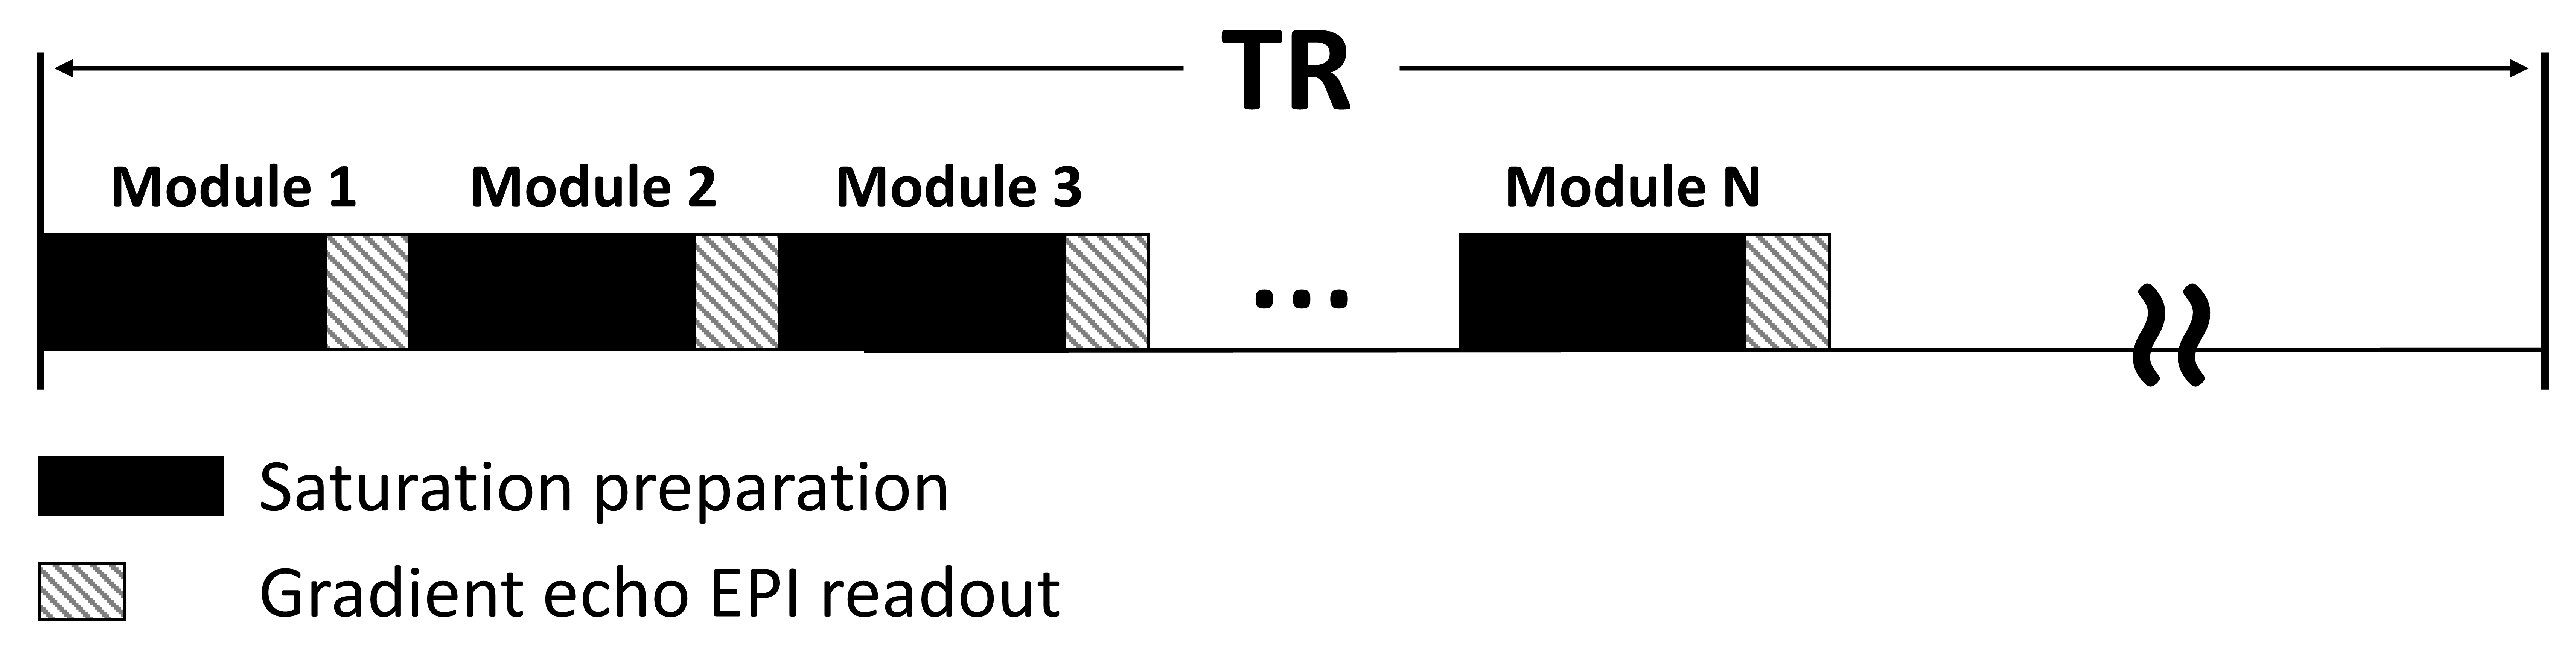
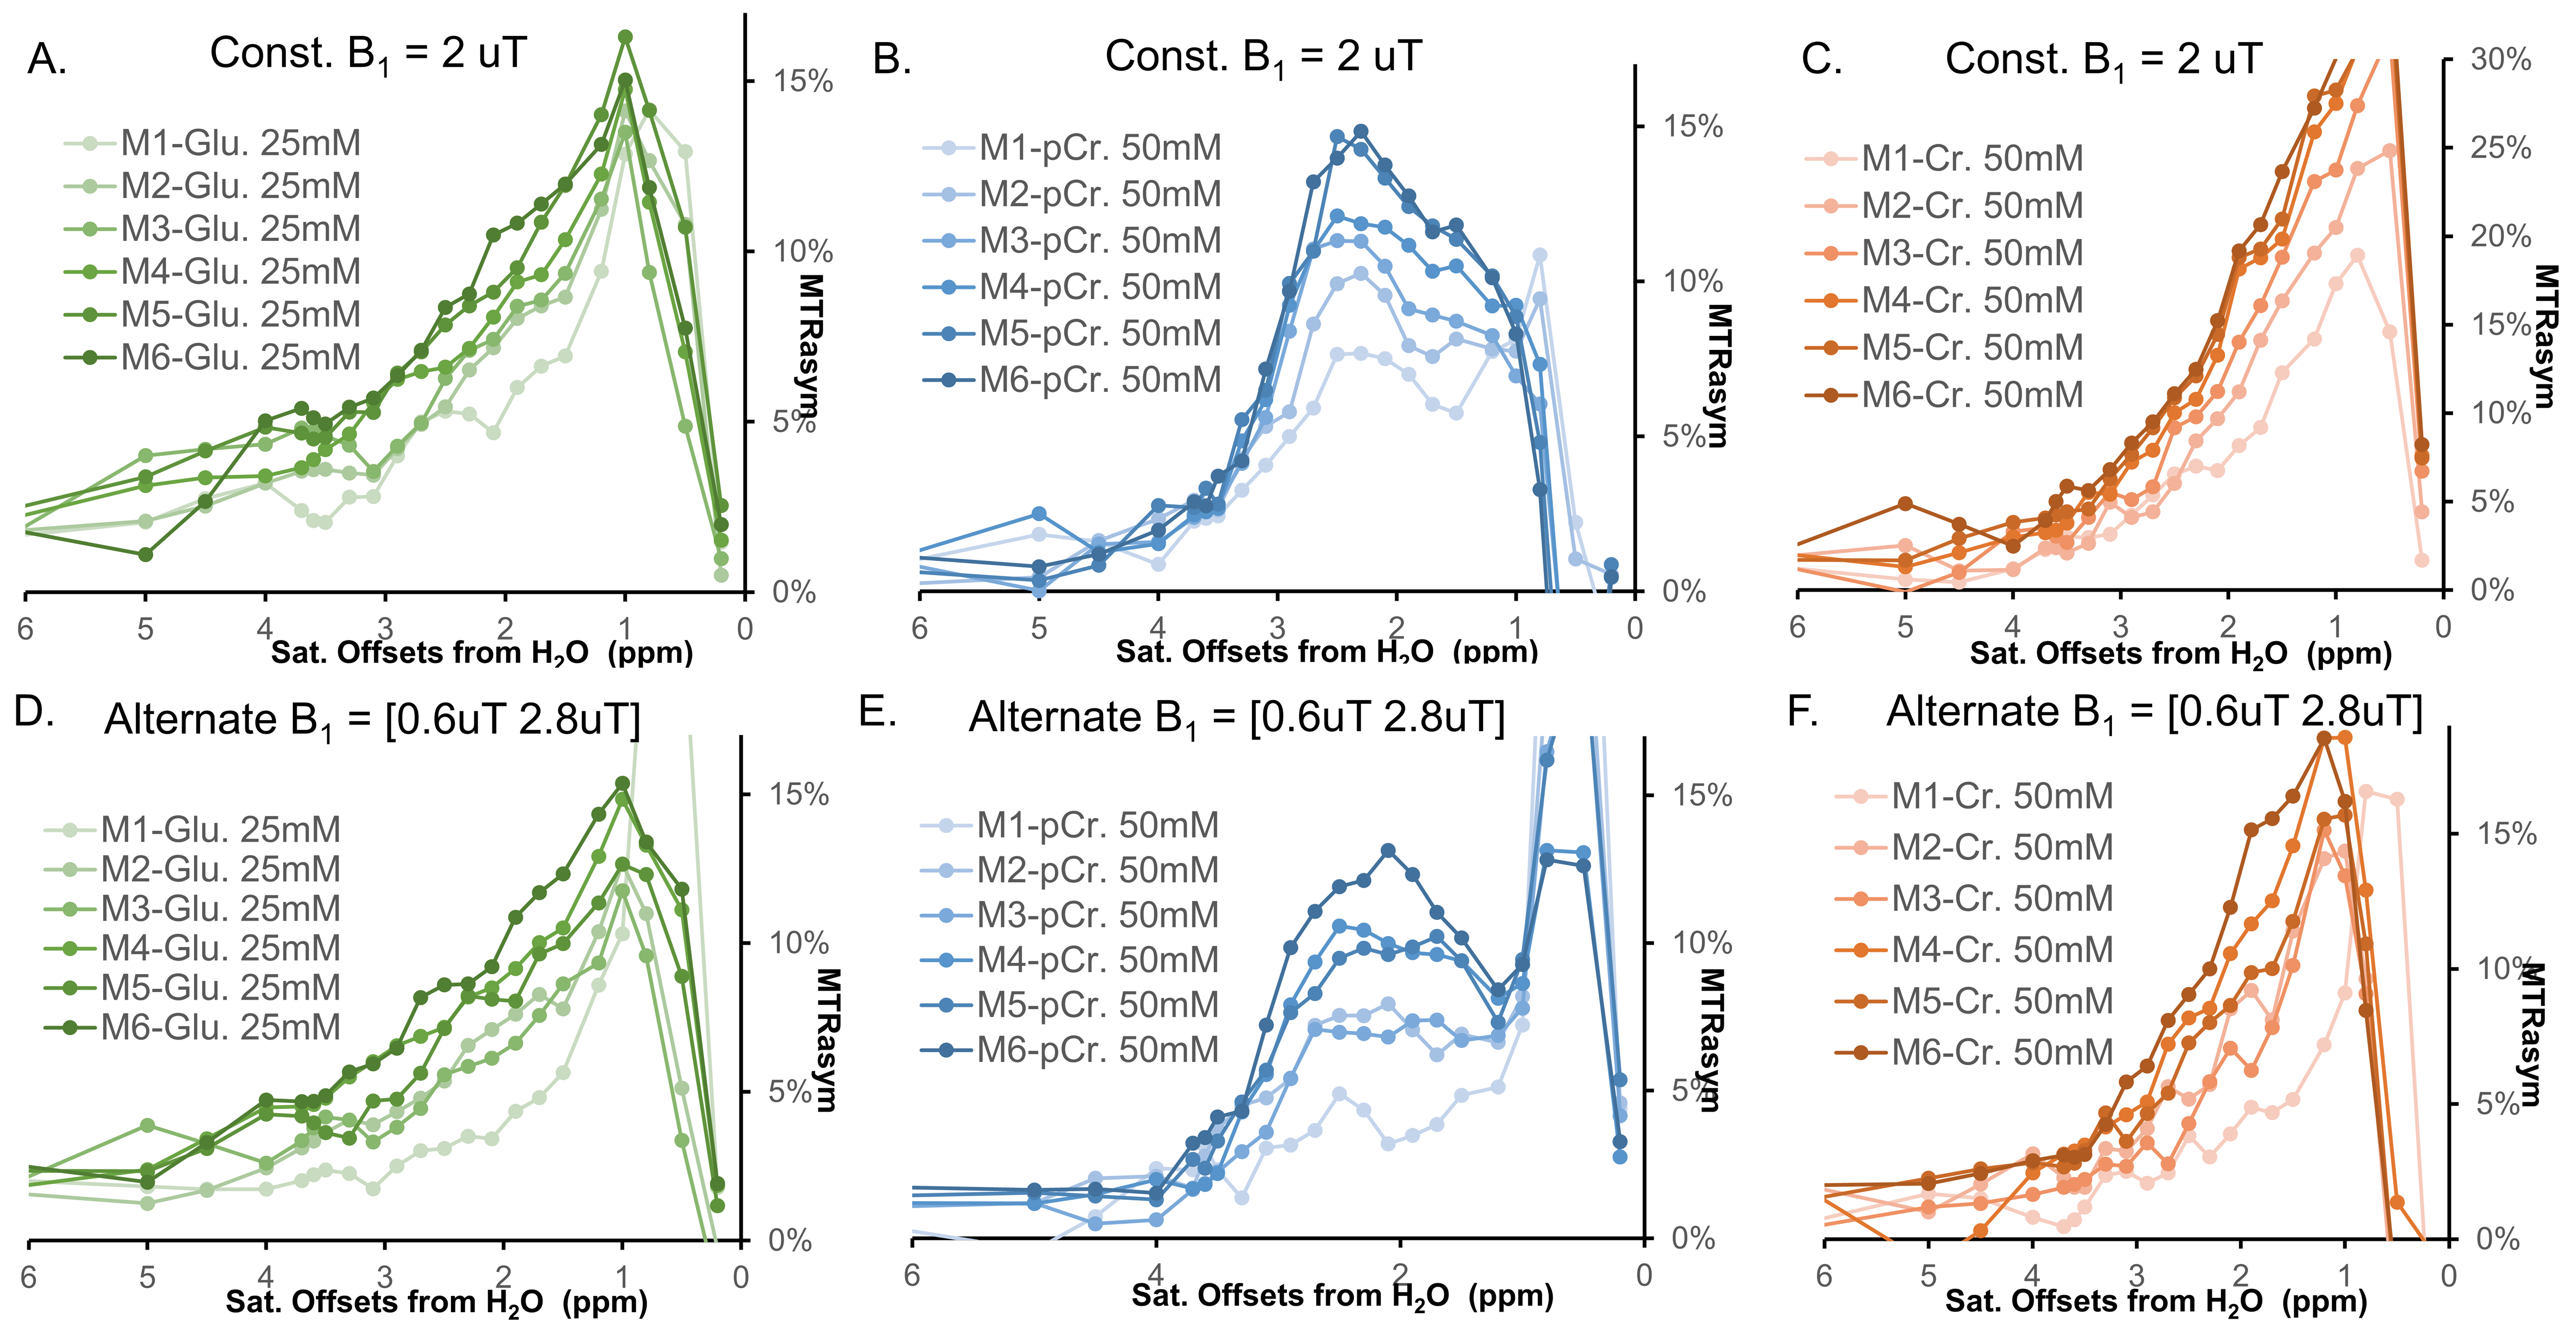
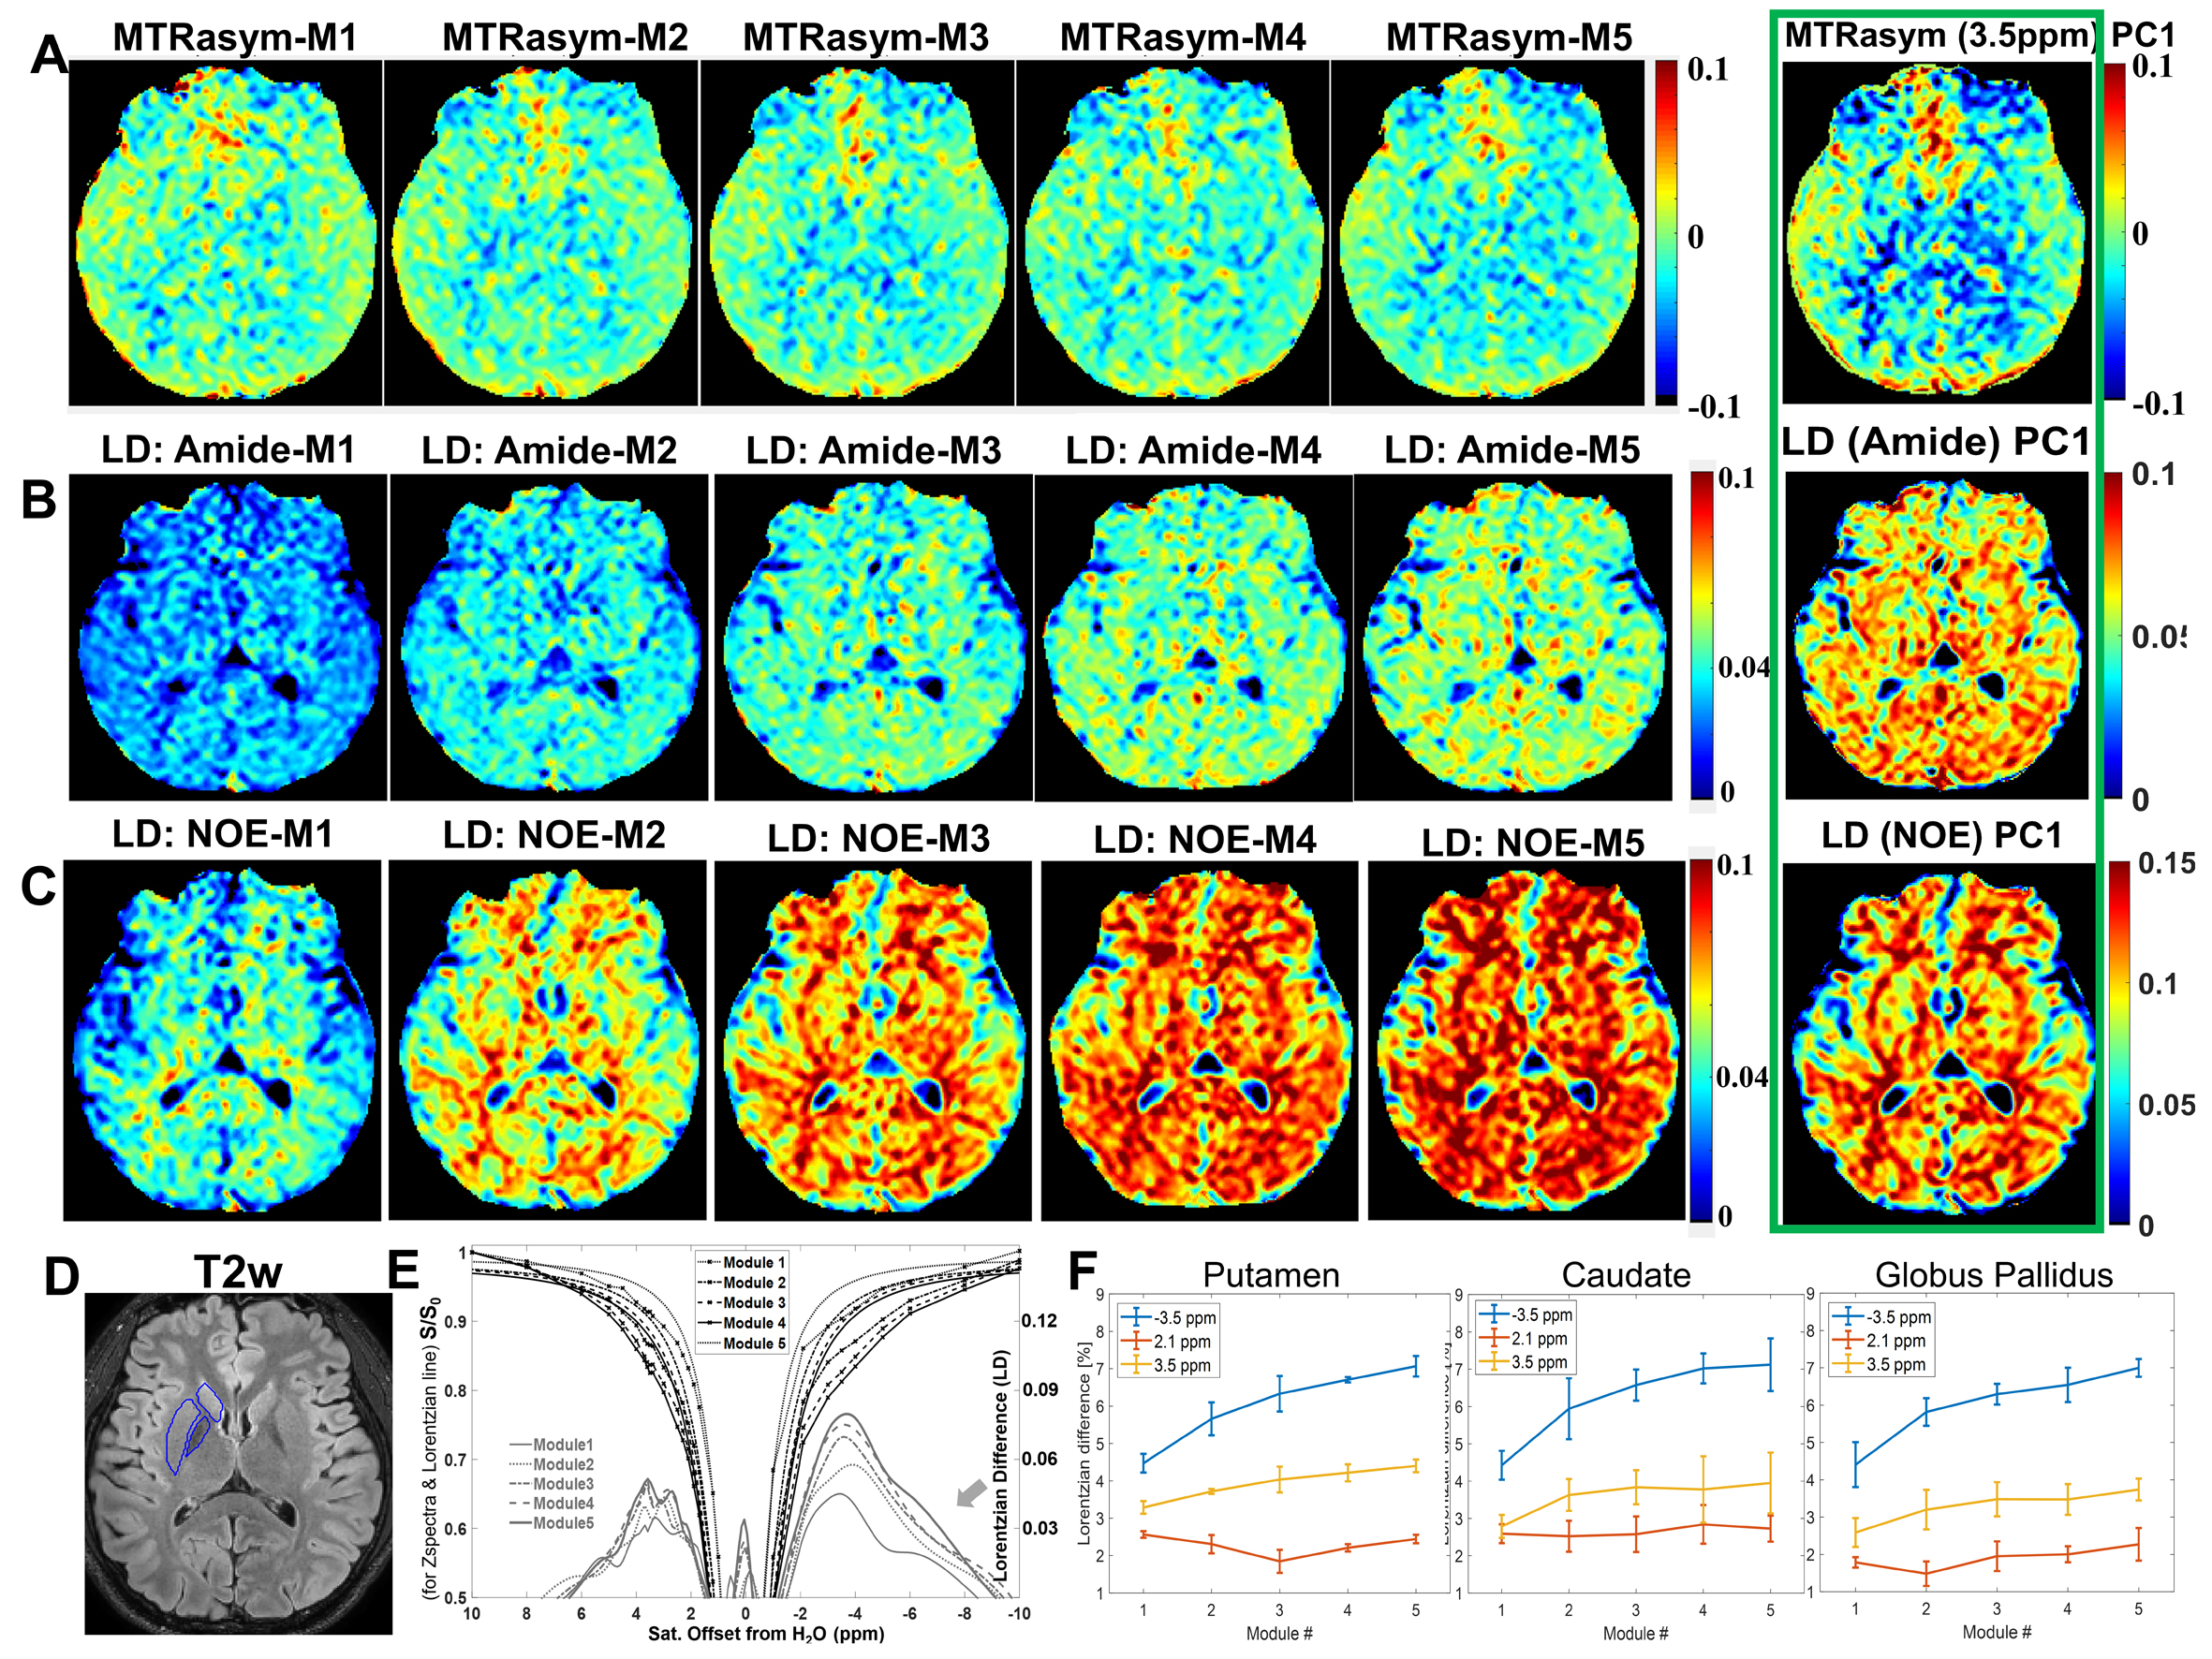
All MRI experiments were performed on a 3T Philips Ingenia CX MR scanner (Philips Healthcare, Best, The Netherlands), with a 70-cm volume coil as the transmitter and a 32-channel phase-array surface coil as the receiver. PaVARS Sequence: Similar to our MeLOVARS method[2], PaVARS sequence (Fig.1) places gradient-echo EPI readouts in between N sat. pulses, each of which could have a user-defined B1. Phantom experiments: 50mM Phosphocreatine (pCr.), 50mM Creatine (Cr.) and 25mM Glutamate (Glu.) solutions were titrated to pH of 7.4, 7.4 and 7 respectively, and then put into three 15ml tubes for MRI acquisition. Tubes were merged into a warm water bath to keep the imaging temperature ~ 37oC. PaVARS contains 6 modules of sat. and the corresponding readout, each with Tsat=400ms. For phantom two different B1 schemes were used, one with a constant B1 and the other with alternating B1, B1low = 0.6 uT (Module 1, 3, 5) and B1high = 2.8 uT (Module 2, 4, 6). B0 map at the same imaging slice was acquired. Human brain imaging: After institutional review board approval and with the informed consent obtained, 4 healthy volunteers (age 22.3 years, 2 males) were scanned using PaVARS sequence that contains 5 modules, each includes a sat. pulse of 400ms and 0.7uT followed by a single-slice single-shot EPI readout. PaVARS Zspectra images consisted of 31 saturation frequency points sweeping from -10 to 10ppm, with a total acquisition time of 2 min 40 sec. B0 map at the same imaging slice was acquired. Other parameters: for phantom TR = 8000ms, single slice EPI readout, EPI TR/TE = 32ms/10ms, flip angle =15o, matrix size = 76X69, FOV = 140mmX140mm, slice thickness = 6mm, 41 saturation frequency offsets; for human brain TR = 5000ms, EPI TR/TE = 25ms/7.0ms, flip angle =15o, matrix size = 76X59, FOV = 230mmX180mm, slice thickness = 7mm. Image Analysis: For phantom, MTR asymmetry spectra of three tubes of Glu., pCr. and Cr. were plotted for each PaVARS module. In human brain imaging, MTR asymmetry map at 3.5 ppm, Lorentzian difference (LD) maps for Amide (3.5 ppm) and LD maps for NOE (-3.5 ppm) from aliphatic protons were calculated, for each PaVARS module post B0-correction using the lowest points on Zspectra as zero offset. Besides, Region of interests (ROIs)on putamen, caudate and globus pallidus were manually drawn on T2 FLAIR image, and the change of LD over PaVARS module was plotted.Results
We first performed phantom studies for three endogenous metabolites, Glu., pCr. and Cr.. PaVARS sequence enabled fast acquisition of 6 modules, each weighted with different sat. parameters (B1 and Tsat). As seen in Fig.2, Glu., pCr. and Cr. exhibited their own featured PaVARS profile, reflecting the evolution of 6 CEST spectra with the continued saturation preparation, despite that pCr. and Cr. both contain guanidinium amine protons and the Glutamate amine resonances at similar offset frequencies. Compared with a constant B1 among sat. modules, alternating a lower B1 and a higher B1 displayed different CEST spectra shapes, which may allow better separation of fast and slow exchange species according to their different responses to B1. When tested PaVARS on 4 young healthy subjects, PaVARS provided 5 distinct Z-spectra, each weighted with different sat. length. Fig.3 shows the contrast evolution of 5 PaVARS CEST images, including MTRasym maps at 3.5ppm, LD maps for quantifying amide content from mobile proteins and peptides, and LD maps for quantifying NOE signal from alphatic protons of lipids. Principal Component Analysis (PCA) of the contrast maps from 5 PaVARS modules, exhibited higher contrast between gray matter and white matter than that on a single module. The quantitative analysis of Putamen, Caudate and Globus Pallidus suggested that at lower B1 both the NOE and amide signal keep increasing as sat. modules, with the slower exchanging NOE exhibiting largest changes. This explains the PC1 image of NOE could reflect enhanced lipid contrast among small anatomical structures.Conclusion
By phantom experiments of three endogenous metabolites and healthy human brain, we proved that PaVARS could achieve fast and stable acquisition of multiple CEST images that weighted with different saturation length and power. PaVARS acquisition may provide a ready-to-use, more informative acquisition methods for 3T scanner, which could accompany advanced analysis technique for better distinguishing endogeneous brain metabolites.Acknowledgements
This work was supported by Natural Science Foundation of China (No. 82071914).References
[1] Song X, Gilad A A, Joel S, Liu G, Bar-Shir A, Liang Y, Gorelik M, Pekar J J, van Zijl P C, Bulte J W, and McMahon M T, CEST phase mapping using a length and offset varied saturation (LOVARS) scheme. Magn Reson Med, 2012. 68(4):1074-86.
[2] Song X, Xu J, Xia S, Yadav N N, Lal B, Laterra J, Bulte J W, van Zijl P C, and McMahon M T, Multi-echo length and offset VARied saturation (MeLOVARS) method for improved CEST imaging. Magn Reson Med, 2015. 73(2):488-96.
Figures