1814
Conserving low amplitude resonances in tensor rank truncation for image enhancement of spectroscopic imaging data.1CRUK Cambridge Institute, University of Cambridge, Cambridge, United Kingdom, 2Department of Clinical Neurosciences, University of Cambridge, Cambridge, United Kingdom, 3Cancer Research UK Major Centre-Cambridge, University of Cambridge, Cambridge, United Kingdom, 4Department of Biochemistry, University of Cambridge, Cambridge, United Kingdom
Synopsis
Tensor decomposition can be used for denoising magnetic resonance spectroscopic imaging (MRSI) data by reconstructing the data from a small number of ranks. Selecting too low an order can remove data from the reconstruction and alter peak amplitudes. A condition for selection of rank order is proposed that removes only noise from the reconstructed data and, therefore, preserves signals from low amplitude resonances. Denoising algorithms that apply this condition are demonstrated for metabolic imaging data sets obtained with hyperpolarised [1-13C]pyruvate and [6,6-2H]glucose in preclinical cancer models, which improve signal-to-noise and reduce the Cramér-Rao lower bound errors in peak fitting.
Introduction
MRSI data are suited to low-rank reconstruction methods and this has been exploited previously in denoising algorithms (1) and data-reconstruction of accelerated acquisitions (2). Brender et al. (3) proposed tensor decomposition for denoising thermally polarised carbon-13 MRSI data and Chen et al. (4) combined reconstruction of parallel imaging with tensor rank truncation image enhancement (TRI), for hyperpolarized 13C MR Images. In many metabolic imaging data sets, the injected tracer can give high signal but many metabolic products of interest have much lower signal-to-noise ratios (SNR). We propose a condition to determine the rank reduction in TRI that minimizes loss of metabolite signals while improving the accuracy of their quantification. The method is valid for any MRSI dataset (2D, 3D and dynamic) irrespective of acquisition and reconstruction strategy. We demonstrate this for datasets obtained from glioblastoma xenografts in rat brain: a set of 10 single time point 3D 13C MRS images acquired following injection of hyperpolarized [1-13C]pyruvate and a Deuterium Metabolic Imaging (DMI (5)), 5D dataset, acquired following injection of [6,6-2H]glucose.Theory
Two dimensional MRSI gives a three dimensional tensor (two spatial: m1, m2, and one spectral dimension: m3) which can be factorized as [1]$$M=C \times F_{1} \times F_{2} \times F_{3}$$ [1]
Where M is the tensor of the data, F1-3 are factor matrices and C is a core tensor of dimensions m1xm2xm3. In rank truncation only the first n1xn2xn3 ranks of the core (where n1<m1, n2<m2, n3<m3) are used in reconstruction, keeping only fibers with data and not noise. Higher dimensionality tensors can be factorized similarly. Inverse Fourier transform of both the MRSI data and the denoised data concentrates the signal to the centre of k-space and the initial time points of the FIDs. Subtraction of the denoised k-space from the data gives residual FIDs (RFID) at each point in k-space for which a residual sum of squares can be calculated as:
$$RSS_{FID} = RFID \times RFID^{*}{'}$$ [2]
where $$$^{*}{'}$$$ indicates the transpose of the complex conjugate. We propose a reconstruction condition that limits the difference between the denoised and the original data (as quantified by RSSFID) to being smaller than the expected noise in that data. The proposal is that any rank reduction is valid such that:
$$ \sum_k RSS_{FID}(k) < \sum_k SS_{noise}(k)$$ [3]
Where k are the K points in k-space that have significant signal and SSnoise is the sum of squares of the noise component of those same k-space points. The SSnoise is not known a priori and must be estimated, either from the last few points of the FIDs or from signal free points in k-space.4
Methods
Carbon-13 MRS images were acquired at 7T following injection of hyperpolarised [1-13C]pyruvate into rats bearing patient-derived orthotopic xenograft models of glioblastoma (6). Each of 10 exams, in 10 animals, produced a single time point 13C image with two spatial dimensions (32x32 voxels, 40 mm x 40 mm, 6 mm slice, 128 points 6010Hz sweep width) and 128 spectral points over a sweep width of 6010Hz. A time course of five 3D MRSI data sets were acquired from a similar model following an intravenous bolus injection of 2g/kg [6,6-2H]glucose in saline using a 3D MRSI sequence (8x8x5 voxels, 32x32x20 mm, weighted k-space, sweep width 5000Hz, 512 points). A MATLAB (The Mathworks, Natick, USA) function was developed for TRI, which used the als_tucker function from the tensor-toolbox (https://www.tensortoolbox.org, Sandia National Laboratories, USA). Algorithms were applied that incremented the selected rank order of spectral and spatial dimensions concomitantly until the lowest-rank reconstruction that satisfied the inequality in Equation 3 was found. Data were quantified by fitting model resonances and the Cramér-Rao lower bound of their amplitudes (CRLBs) were calculated.Results
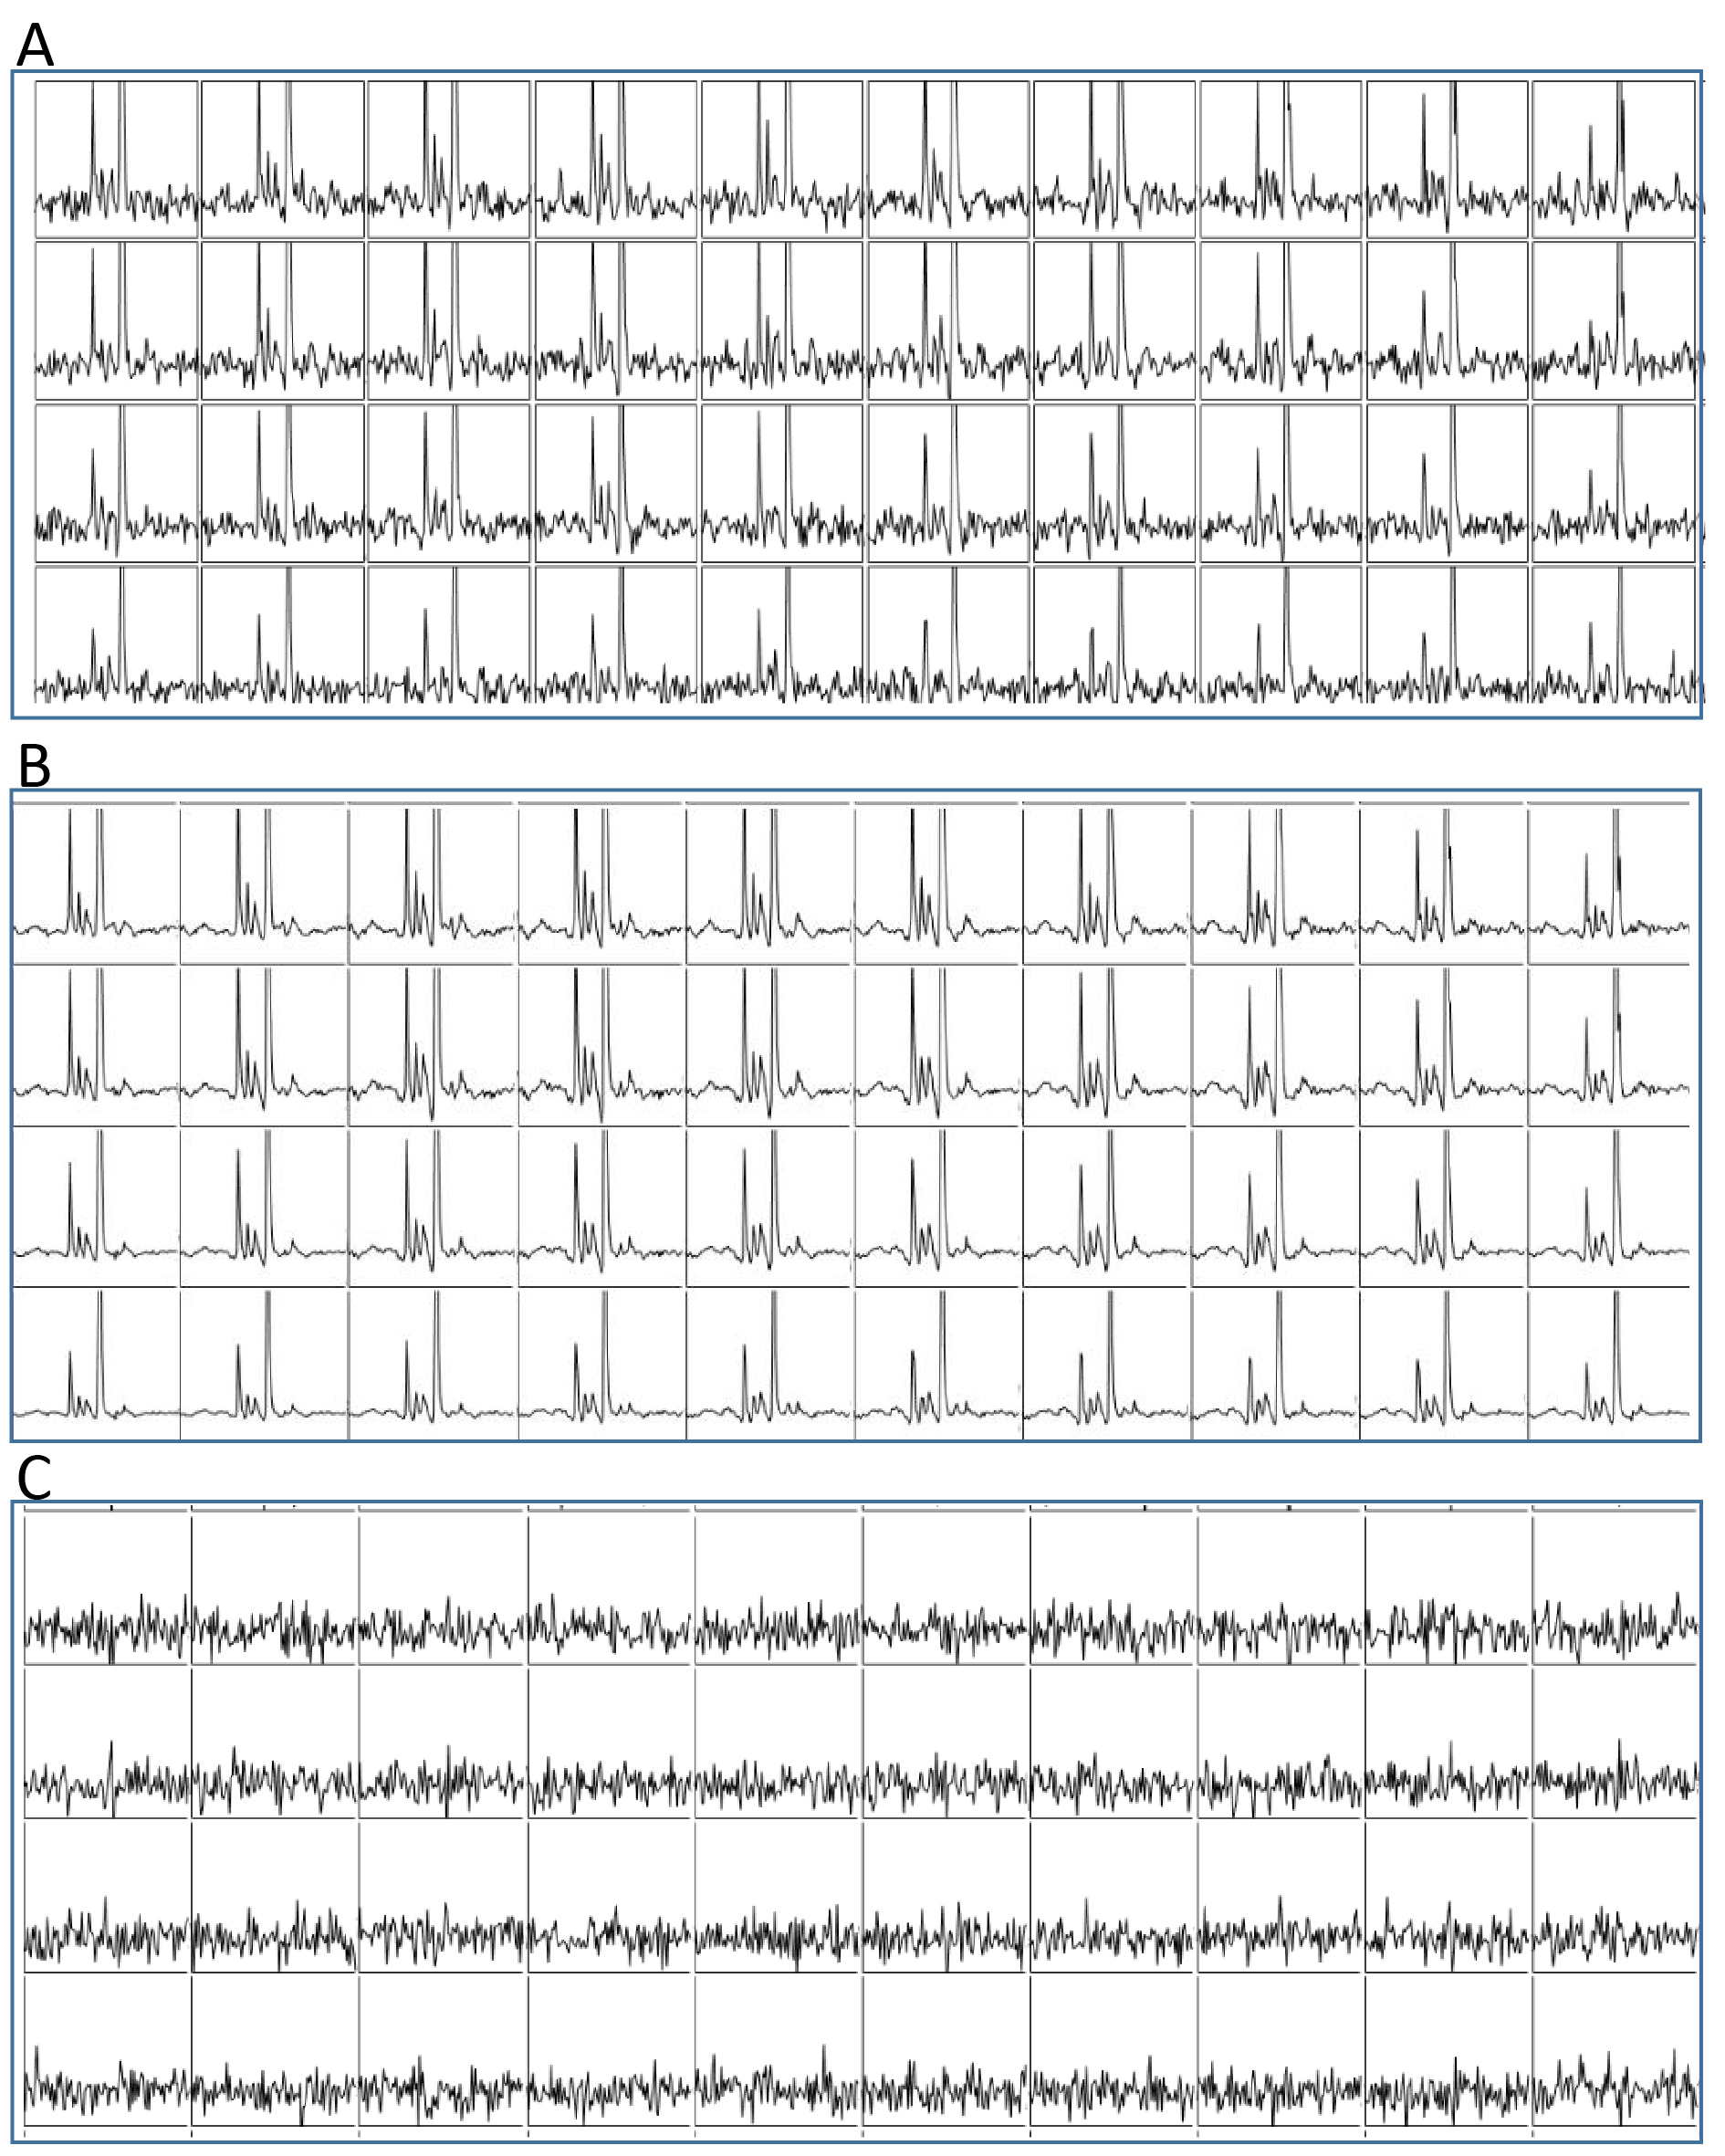
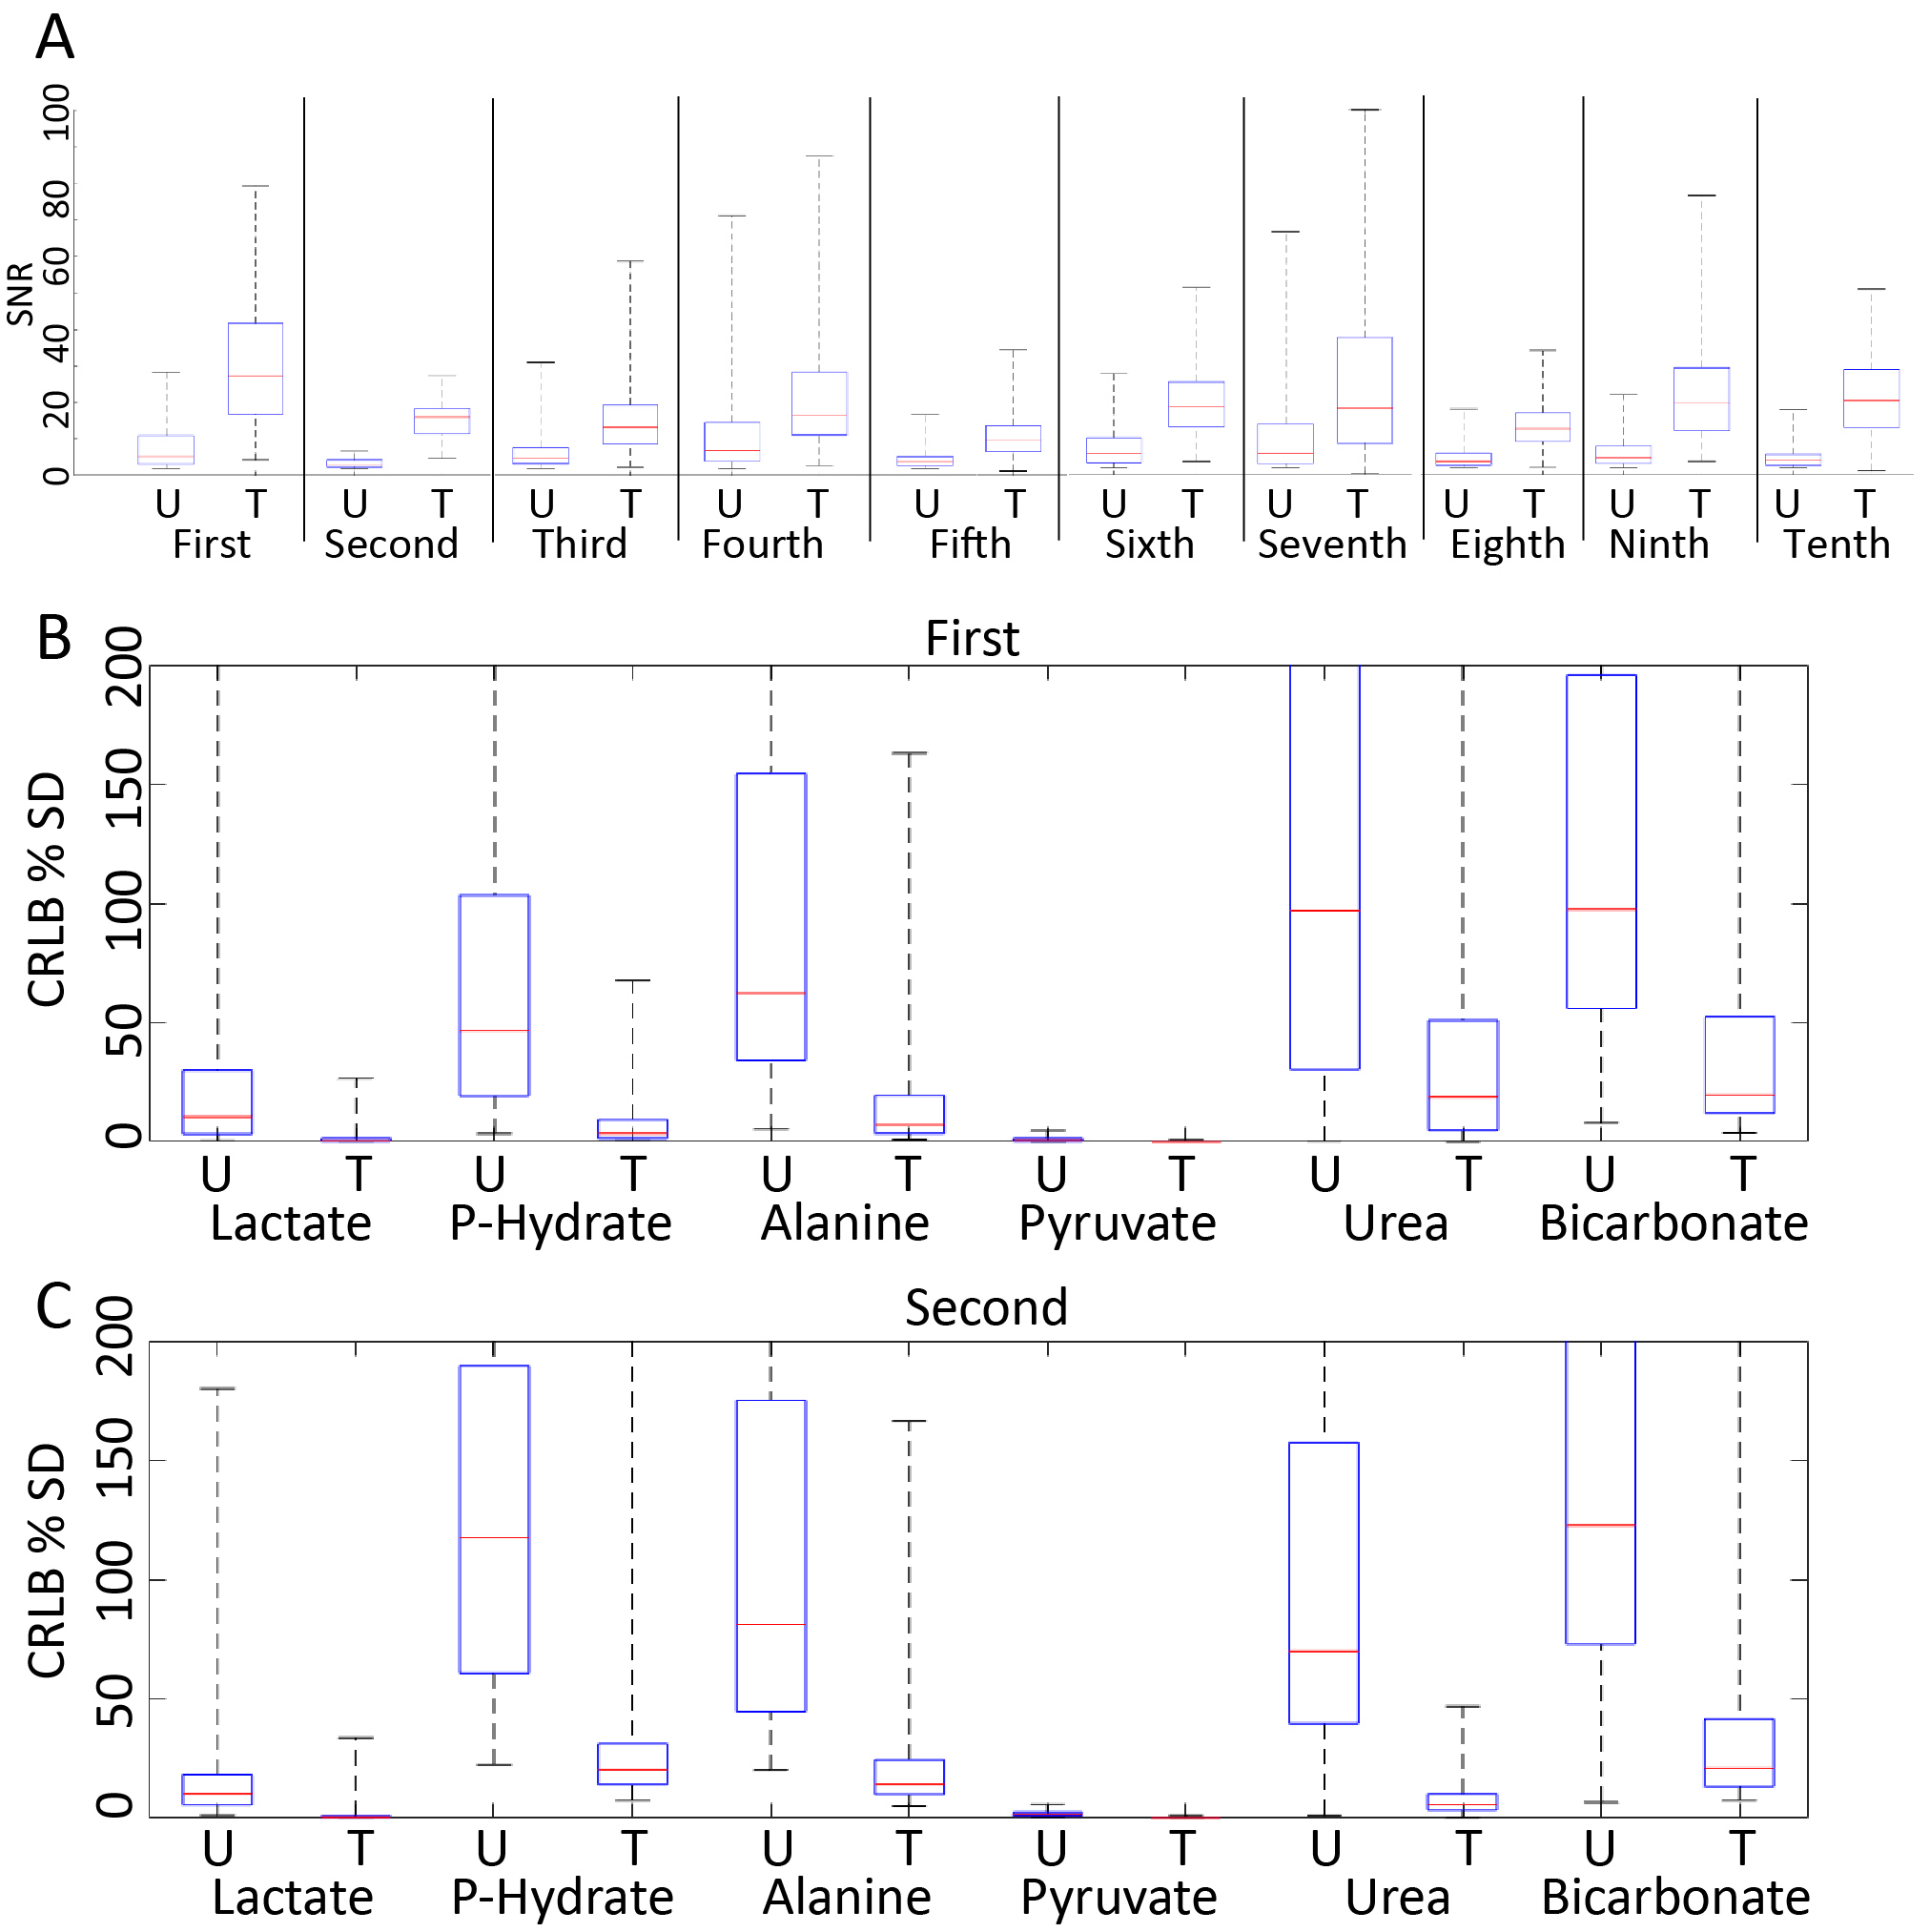
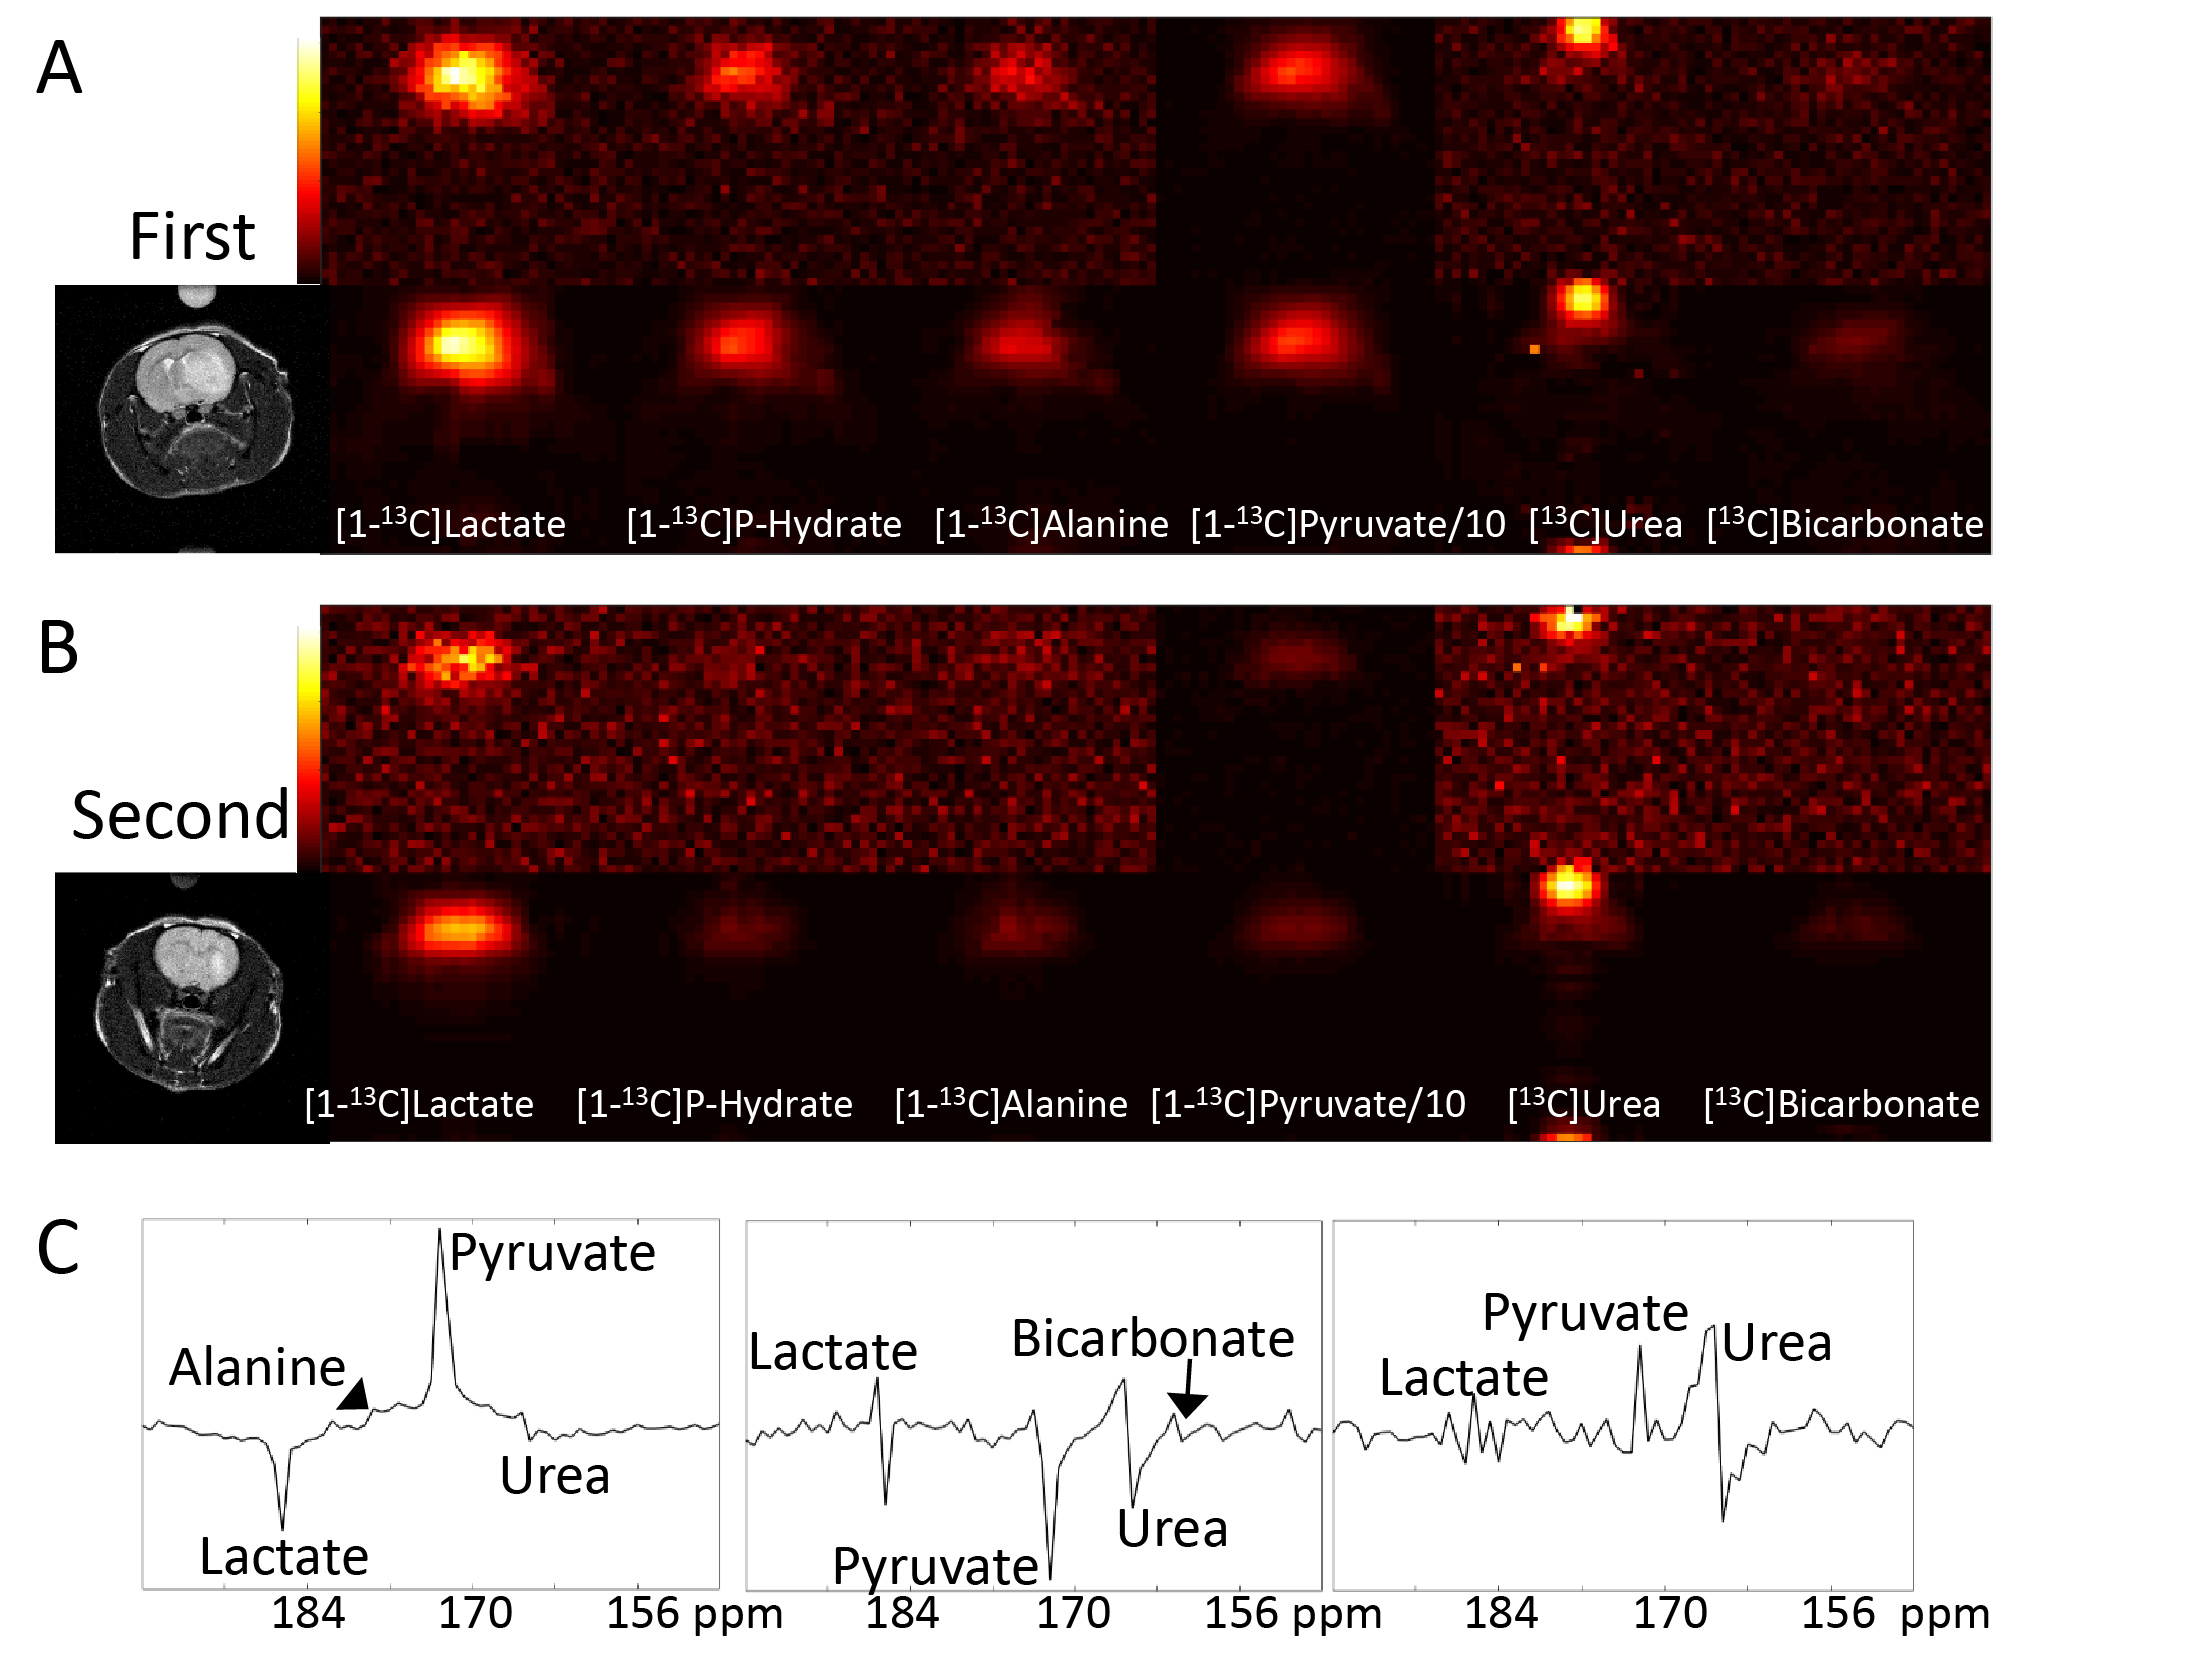
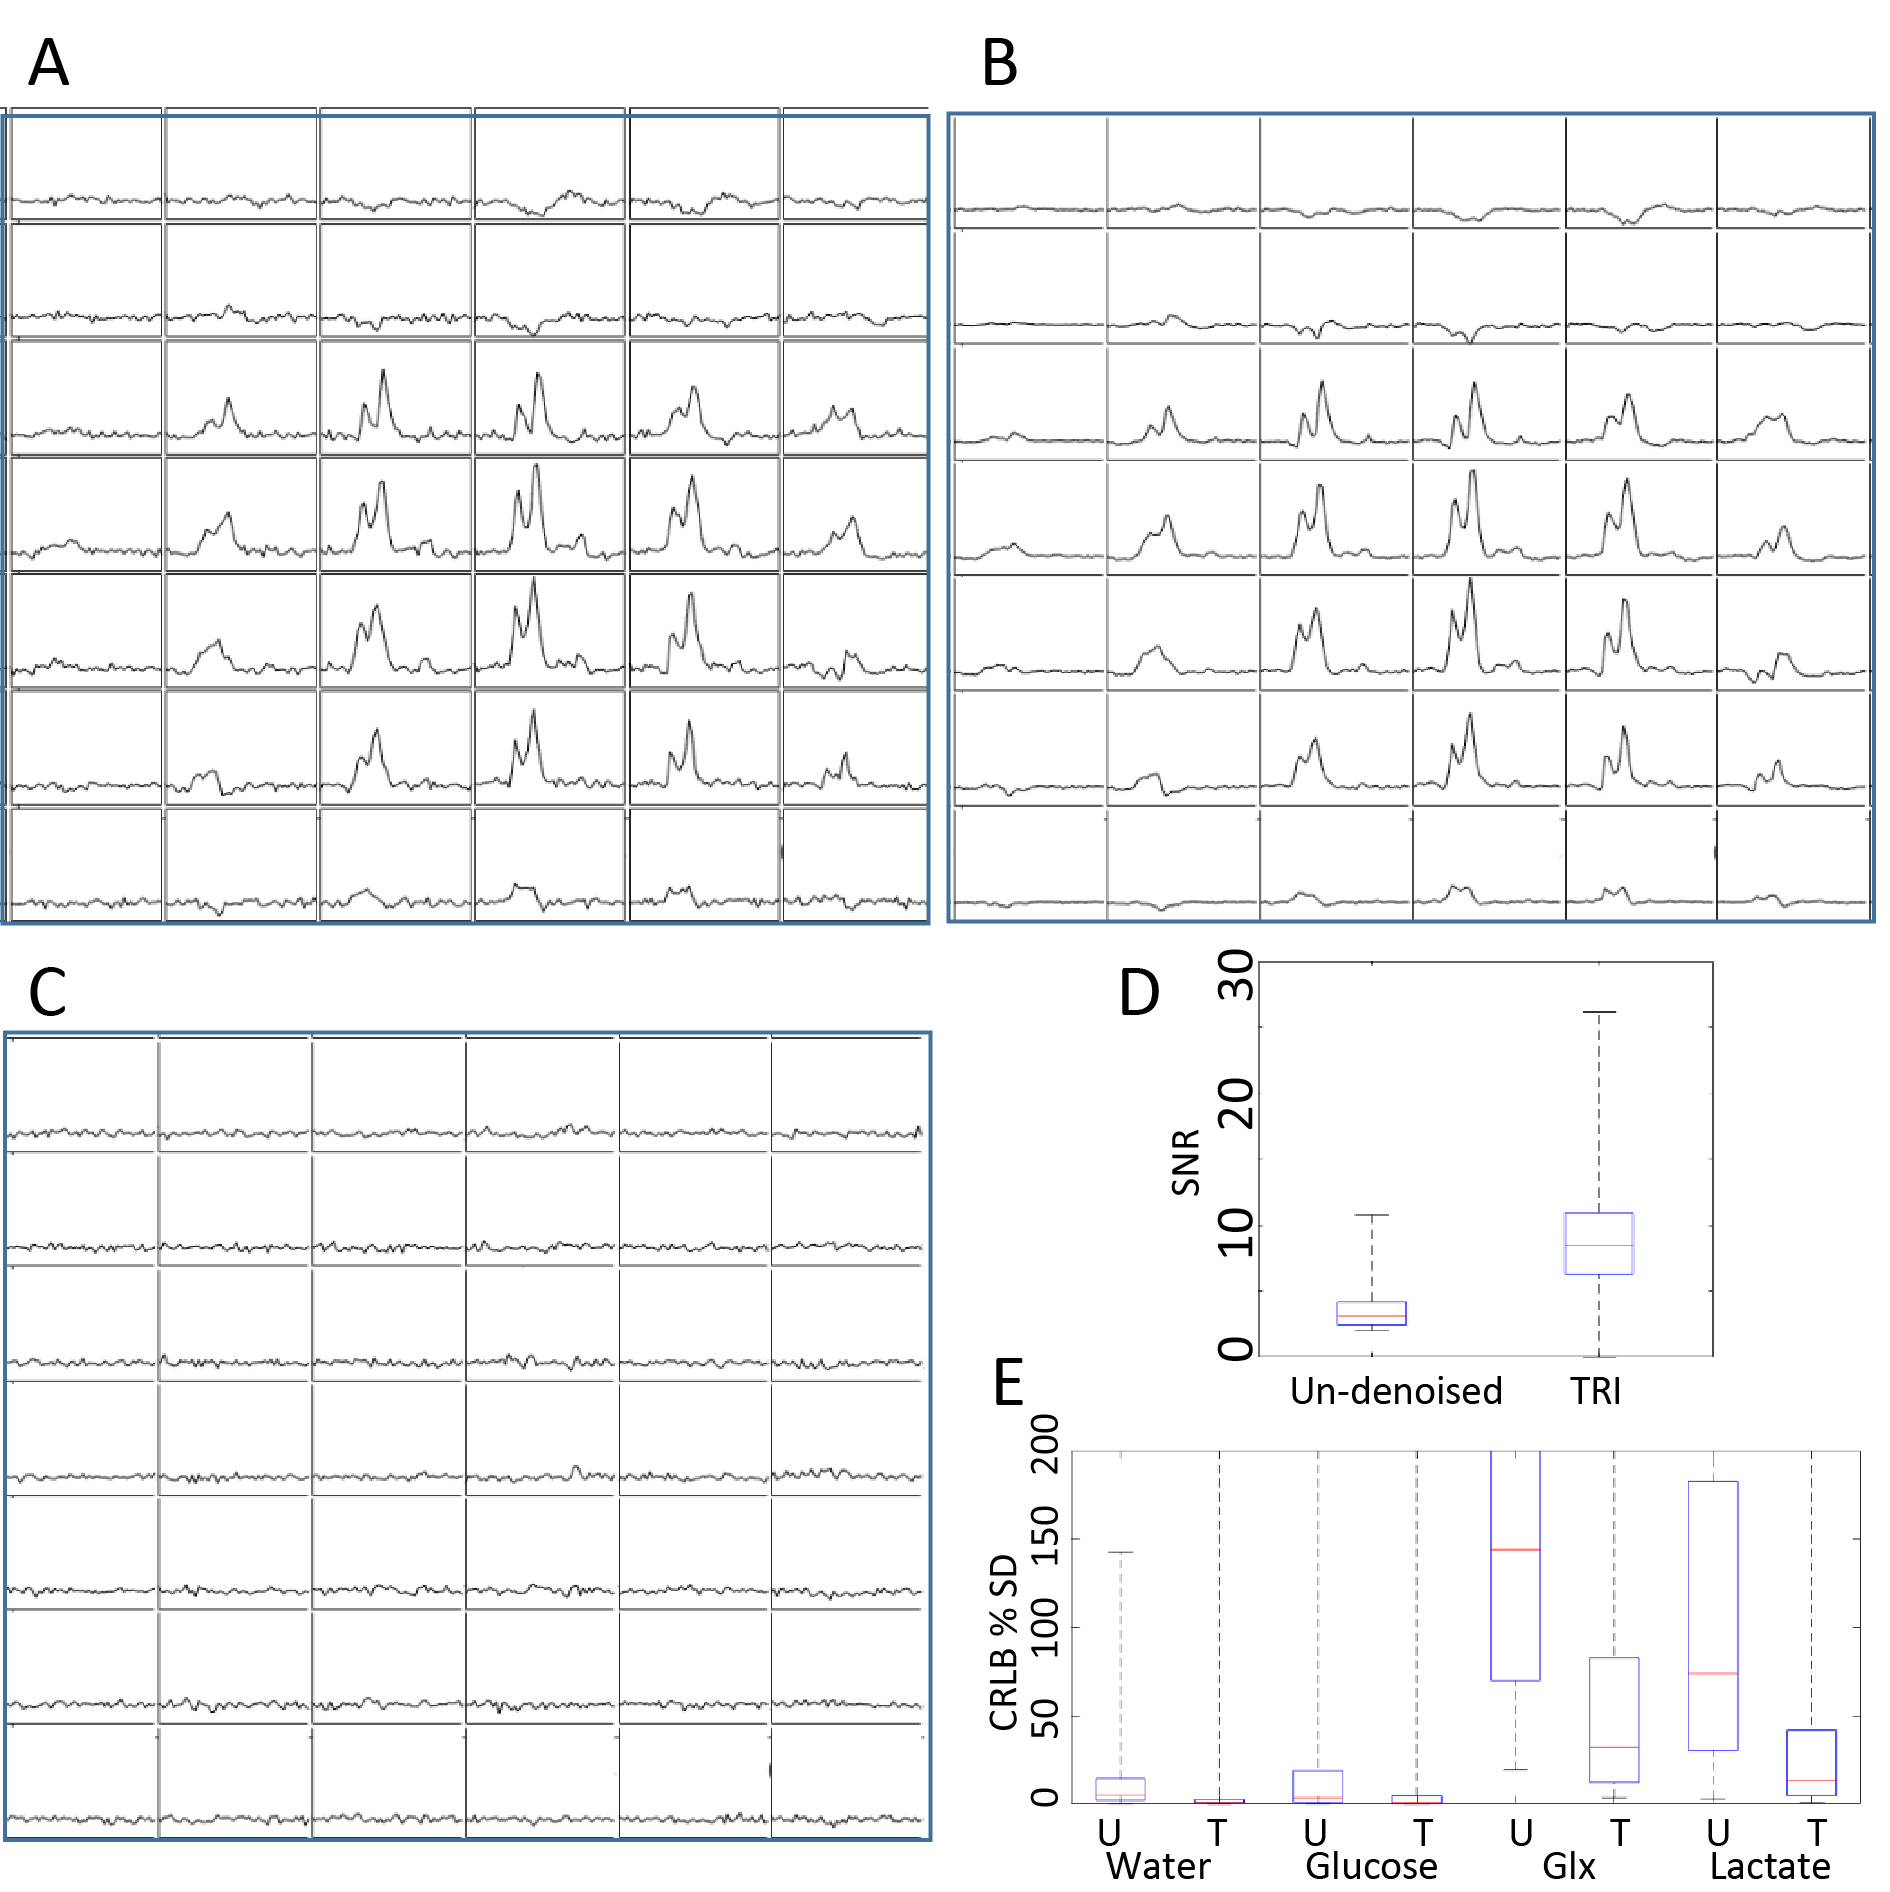
TRI was applied to 10 carbon-13 MRSI data sets from rats with orthotopic glioblastoma xenografts injected with hyperpolarised [1-13C]pyruvate. A range of low-rank orders was found to satisfy the inequality and one example is shown in Figure 1. Quantification of MRSI data (Figure 2) shows an improvement in the pyruvate SNR for the highest signal voxels in all data sets due to denoising and a decrease in CRLB values. Example images (Figure 3a) show the increased SNR but one example (Figure 3b and c) shows how high signal data can, artefactually, be reconstructed for more metabolite signals than the reduced rank order in the spectral dimension. Results of TRI as applied to 5 dimensional DMI data are shown in Figure 4. TRI reduced the dimensions from 8x8x5x512x5 to 6x6x3x18x3, preserving the unresolved glutamine and glutamate resonances (Glx) and reducing the CRLBs of their estimated amplitudes.Discussion
The denoising algorithms presented here using Equation 3 ensure that any signals removed from the data are indistinguishable from noise. Two of the ten [1-13C]pyruvic acid data sets analysed here had rank reductions in the spectral dimension that were smaller than the number of individual metabolite resonances expected. This implies that these metabolites have signal that is too low in amplitude to be measured accurately in these data sets.Conclusion
MRSI data can be denoised with TRI while preserving all detectable metabolite signals, provided that the condition in Equation 3 is satisfied.Acknowledgements
The work was supported by a Cancer Research UK Programme grant (17242)References
1. Abdoli A, Stoyanova R, Maudsley AA. Denoising of MR spectroscopic imaging data using statistical selection of principal components. MAGMA 2016;29(6):811-822.
2. Lam F, Liang ZP. A subspace approach to high-resolution spectroscopic imaging. Magn. Reson. Med 2014;71(4):1349-1357.
3. Brender JR, Kishimoto S, Merkle H, et al. Dynamic Imaging of Glucose and Lactate Metabolism by 13C-MRS without Hyperpolarization. Sci Rep 2019;9(1):3410.
4. Chen HY, Autry AW, Brender JR, et al. Tensor image enhancement and optimal multichannel receiver combination analyses for human hyperpolarized 13C MRSI. Magn. Reson. Med. 2020.
5. De Feyter HM, Behar KL, Corbin ZA, et al. Deuterium metabolic imaging (DMI) for MRI-based 3D mapping of metabolism in vivo. Sci. Adv. 2018;4(8):eaat7314.
6. Mair R, Wright AJ, Ros S, et al. Metabolic Imaging Detects Low Levels of Glycolytic Activity That Vary with Levels of c-Myc Expression in Patient-Derived Xenograft Models of Glioblastoma. Cancer Res 2018;78(18):5408-5418.
Figures