1810
Fast Fluorine Spectroscopic Imaging with pseudo-spiral k-space sampling1Computational Imaging Lab, Institute Of Biomedical Engineering, Bogazici University, Istanbul, Turkey, 2Institute of Diagnostic and Interventional Radiology, Faculty of Medicine and University Hospital of Cologne, University of Cologne, Cologne, Germany, 3Philip Research Labs, Eindhoven, Netherlands
Synopsis
19F-MRI constitutes a viable platform for quantitative theranostics. However, being impaired by physiological absence, and complex NMR spectra of perfluorocarbons, for 19F-MR it is essential to achieve high imaging efficiency. This work introduces a novel spectroscopic imaging sequence, BaSSI, that resides on a balanced psuedo-spiral acquisition scheme and compares against 3D balanced UTE SSFP imaging, that has become the golden standard of fluorine imaging. The work, optimizes both sequences to their fullest, and tests their performance using miniscule samples of PFOB.
INTRODUCTION
Fluorine (19F) MRI generates hot-spot images that represent accumulation sites of fluorinated contrast media - typically, perfluorocarbons. 19F data is acquired either using spectrally selective techniques, or spectroscopic imaging, in order to avoid ghosting artifacts generated by complex NMR spectra of perfluorocarbons1.Here we present a spectroscopic imaging sequence that employs an all-phased encoded and balanced acquisition scheme tracing the k-space in a pseudo-spiral manner (Figure 1). While, spectroscopic imaging is known to be relatively slow, and therefore less efficient, the new sequence has proven to be more sensitive and efficient than the 3D Balanced ultra-short echo (UTE) SSFP sequence2 that was used as benchmark.
METHODS
Experiments were conducted on a Philips Achieva 3.0T clinical scanner equipped with a Dual Tuned 1H/19F small animal coil. The setup was provided with a coil holder that positioned the coil and samples at the iso-center, in order to minimize variations due to field inhomogeneities and non-linearity of the gradients.Sequences were optimized using in-vitro samples containing 1ml of perfluorooctylbromide (PFOB) and exploring a large parameter space. For each experiment, the setup was tuned/matched to keep RF reflection below 0.1%. SNR assessments were conducted using modulus images, with mean of signal and standard deviation of noise (i.e. ROI with no signal): SNR=<Signal>/σNoise. All optimization experiments were carried out with NSA=1, and all data points were obtained with a sample size of 5 for statistical validity.
3D-UTE-SSFP sequence was optimized by an echo-time (TE) sweep, ranging from the shortest possible value (TEmin=0.115ms) to 0.2ms. Repetition time (TR) was optimized in combination with the flip-angle, over a parameter space ranging from shortest possible value ( TRmin=1.67ms) to 5ms, in steps of 0.1ms, and thereafter in larger steps, until TR=100ms. The flip-angle was varied from the smallest value yielding measurable signal (FAmin=5°) to largest value allowed by the chosen optimal echo-time (FAmax=55°). The offset-frequency was set to target the CF2 group of PFOB, whereas gradient was set to yield a pixel bandwidth of 1 kHz to achieve optimal SNR, and maintain consistency with Goette et al. The sequence was run with 64x64x64 isotropic acquisition scheme employing Wong-type radial readout2, with a voxel size of 1 mmx1mmx1mm, which was re-gridded to 80x80x80 during reconstruction. The slice with highest SNR was used in optimization as well as performance benchmarking.
Optimization of spectroscopic imaging sequence employed in-silico experiments to investigate evolution -of magnetization, and a frequency sweep to determine optimal offset-frequency. The B1 setting of the RF-coil was varied to identify conditions for optimal excitation. The gradient system was also optimized by varying the strength and slew rate, from 30mT/m to 35mT/m, and 200T/m/s to 230T/m/s, respectively. TR was swept over a range from 2.5ms to 5ms, whereas FA was varied from a 7.5° to 60°. Spectroscopic data was acquired using a sampling rate of 64kHz, and images were generated by integrating the CF2 peak over a narrow window (~1kHz) to maximize SNR. Spectroscopic data was acquired using a 64x64 grid with voxels of 1mmx1mm.
Finally, the optimized sequences were assessed for their detection sensitivity and image quality using a cylindrical vial (inner-diameter: ~1mm) filled with 0.1μl of PFOB .
RESULTS
Optimization results for 3D-UTE-SSFP are shown in Figure 2. Optimal sequence was obtained with TE=0.145ms, TR=2.5 ms and FA=20°. Duration of sequence was about 25 s for NSA=1.Optimization results for the spectroscopic imaging sequence are shown in Figure 3. Optimal sequence was obtained with TE=0.675 ms, TR=3.5 ms and FA=30°. Duration of sequence was about 14s for NSA=1.
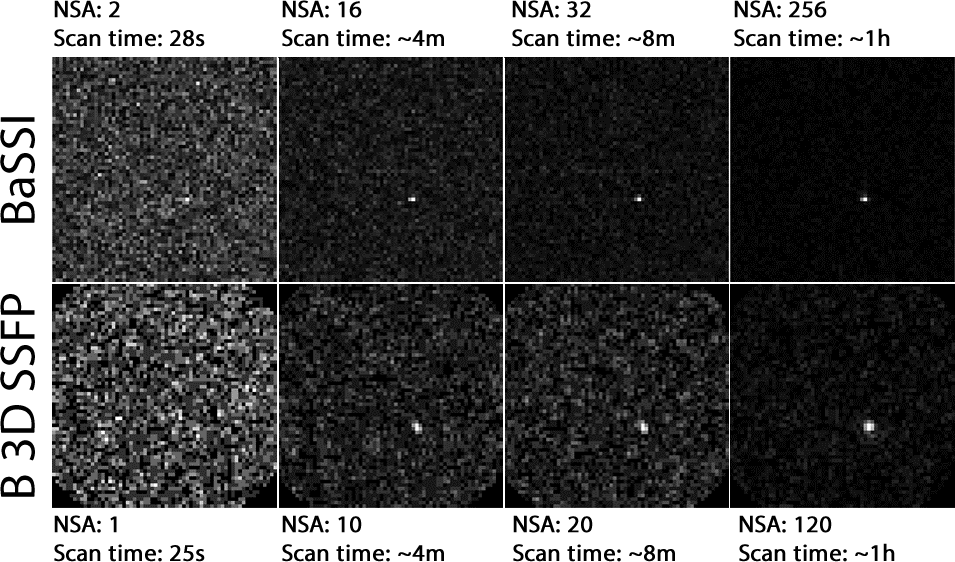
Detection sensitivity and image quality assessment of the sequences using a 0.1μl PFOB sample, show that balanced spiral spectroscopic imaging sequence has significantly better sensitivity as it is able to detect the sample even with NSA=1, while the detection onset of the UTE sequence is around NSA=5. In terms of image quality and point spread function, the imaging sequence shows significantly large spatial spreading, converting a 1mm sample into 2-3mm hot-spot, whereas the hot-spot obtained with spiral spectroscopic imaging stays within the 1-1.5mm range.
Applying the detection sensitivity formula reported by Goette et al.1, the balanced spectroscopic imaging sequence yields a detection sensitivity of about 63 μmol-1min-1/2, which is about 24% higher than 51 μmol-1min-1/2, the value reported for 3D balanced-UTE-SSFP using a 38mm flask of bulk PFOB .
CONCLUSION
Comparison of sequences with different characteristics and results obtained on different setups is an intrinsically challenging endeavor. Despite using a similar scanner, it was impossible to create an identical replica of the sequence implemented by Goette et al2, primarily due to differences in RF and gradient system. To compensate for this gap and create a fair basis for comparison, a large parameter space was explored to ensure that the imaging sequence was fully optimized.Having such a formidable benchmark, the balanced spiral spectroscopic imaging, BaSSI, fared strongly and yielded superior detection and imaging capabilities, which are essential for in-vivo experiments aiming at quantifying contrast media targeting specific tissues or lesions, or carrying therapeutic payloads.
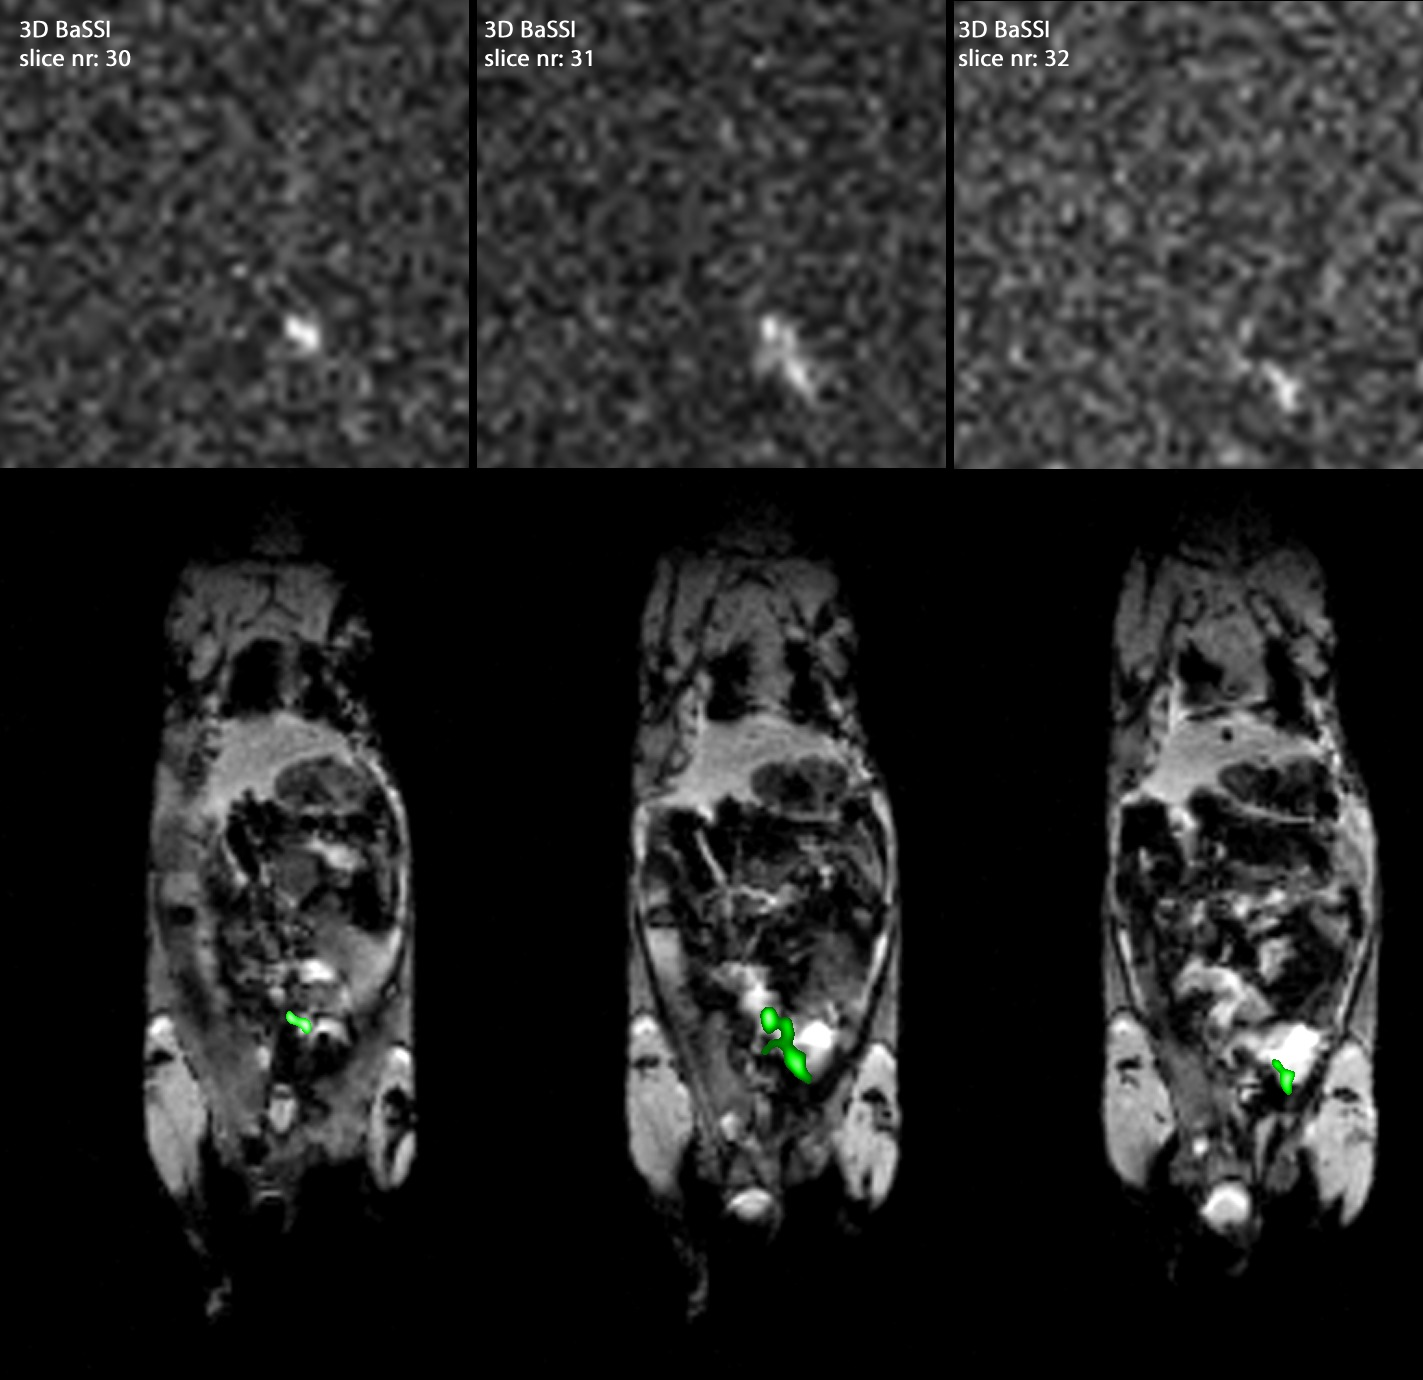
Following its debute and post-mortem 3D imaging experiments with very low amounts of PFOB (Figure 5) BaSSI will continue to evolve into an efficient 3D quantitative imaging tool for Fluorine theranostics.
Acknowledgements
No acknowledgement found.References
1. Flogel U, Ahrens E. Fluorine magnetic resonance imaging. Pan Stanford, New York (2016)
2. Goette MJ, Keupp J, Rahmer J, et al. Balanced UTE-SSFP for 19F MR Imaging of Complex Spectra. Magnetic Resonance in Medicine 74:537–543 (2015)
3. Wong STS, Roos MS. A strategy for sampling on a sphere applied to 3D selective RF pulse design. Magnetic Resonance in Medicine 32:778–784 (1994)
Figures
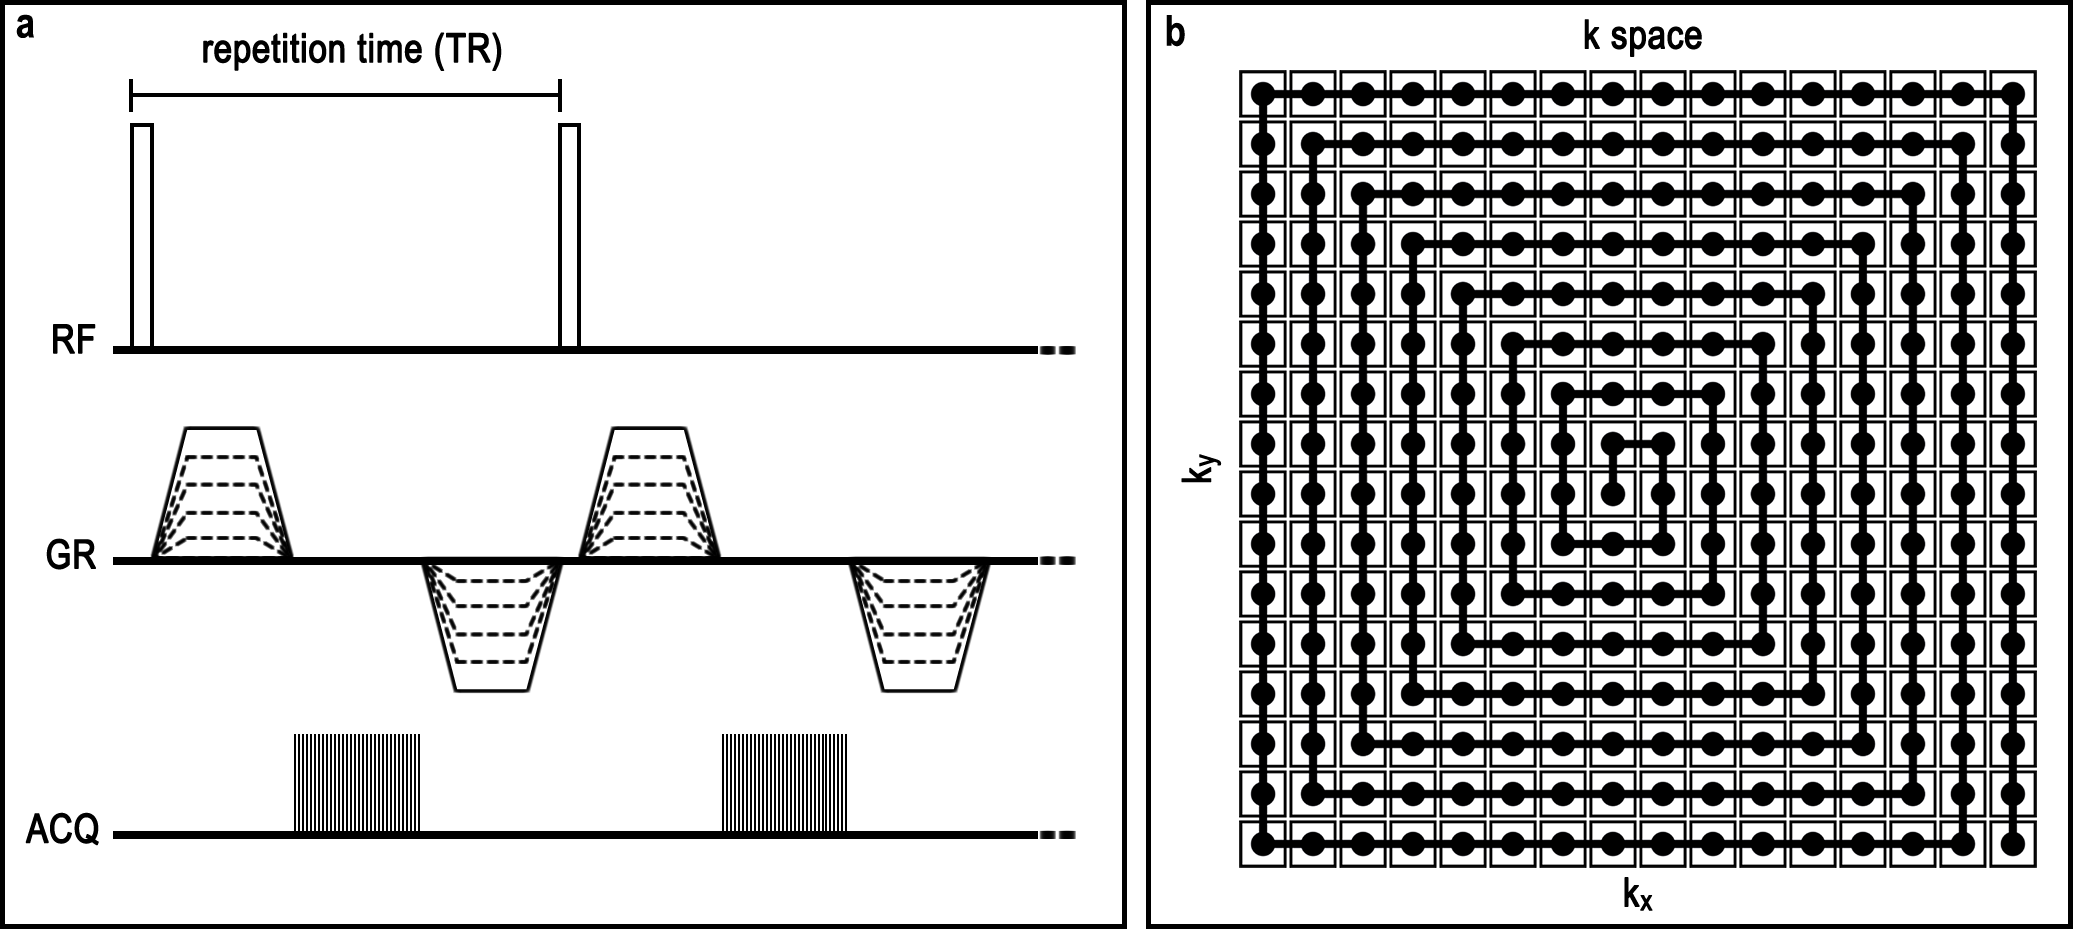
a) all phase-encoded spectroscopic imaging sequence with balanced gradients. Encoding can be done in 2D or 3D.
b) pseudo-spiral k-space sampling scheme in 2D. 3D encoding is done by stacking 2D trajectories.
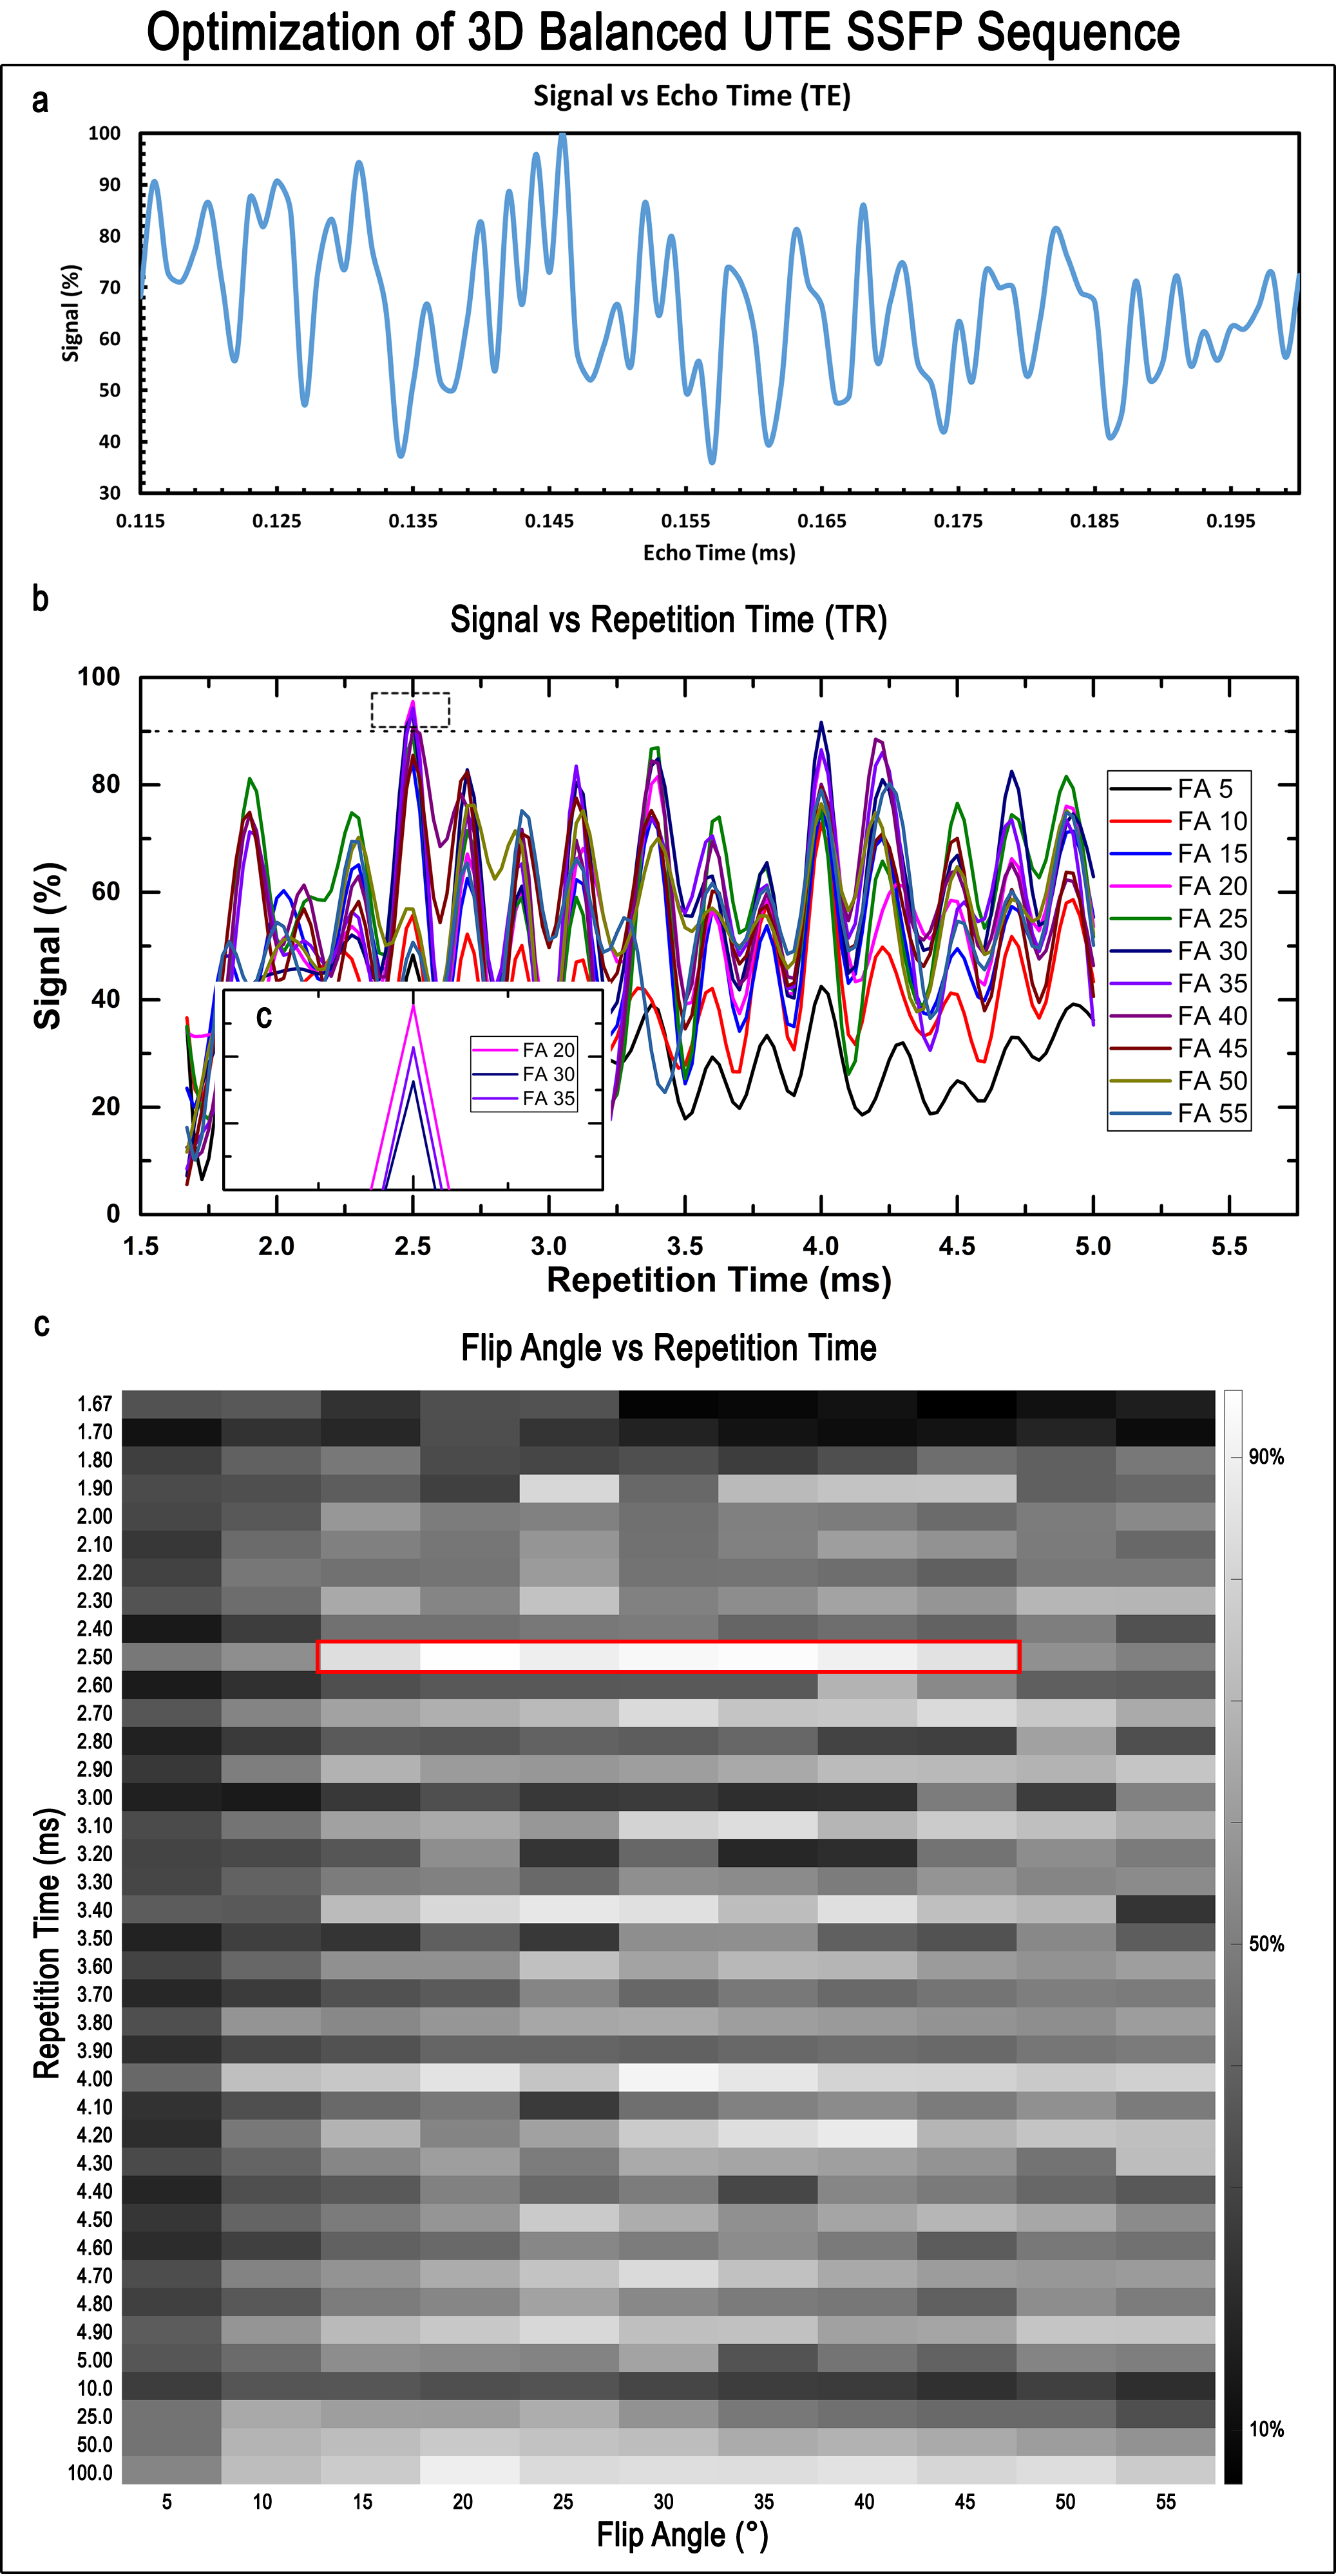
a) Shortest echo time dictated by hardware limitations was 0.115 ms. An echo time sweep yielded interference pattern with a maximum at TE = 0.145 ms.
b) Signal exhibited complex interference patterns with varying TR, as a result of the complex NMR spectrum of PFOB. Signal reached an optimal level (>90%) for TR = 2.5ms and FA = 20°, 30° and 35°.
c) Flip Angle vs repetition time (TR) results, with shortest TR = 1.67 ms. Largest FA = 55°. Optimal results were found with TR = 2.5 ms and FA in the range of 20° - 35°.
All results were scaled against maximum signal obtained with TR = 10s.
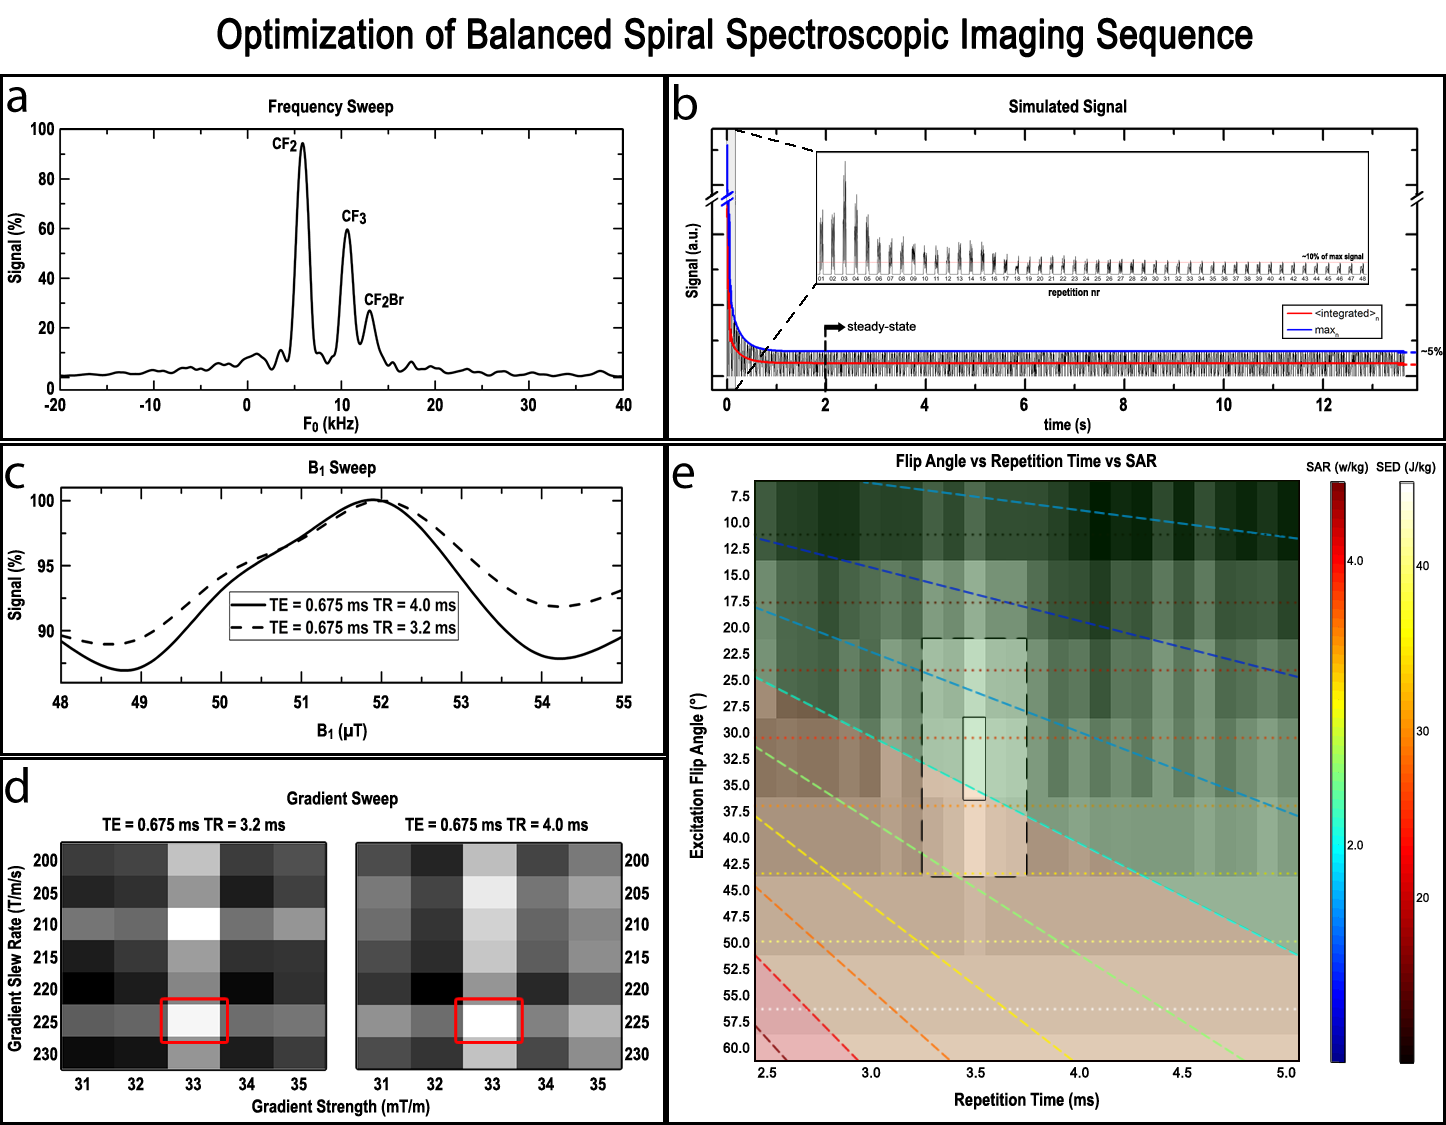
a) Frequency sweep yields max signal for CF2 group of PFOB.
b) In-silico results show steady state at t > 1.5 s, with a significant loss of signal (~95%).
c) Sweeping B1 yields an optimal value of 51 μT
d) Exploration of gradient parameters yield optimal values of 33 mT/m and 225 T/m/s, for strength and slew rate, respectively.
e) FA vs TR results, with varying from TR = 2.5 ms to 5 ms, and FA varying from 7.5° to 60°, including SAR output. Optimal results were found for TR = 3.25 ms - 3.75 ms, and FA = 30° - 35°.
All results were scaled against the maximum obtained in corresponding parameter sweep data set.