1805
Development of an add-on 23Na MRI platform for an existing 1H MRI scanner using a crossband repeater: Proof-of-concept
Michiru Kajiwara1, Tomoyuki Haishi2,3, and Yasuhiko Terada1
1Institute of Applied Physics, University of Tsukuba, Tsukuba, Japan, 2Department of Radiological Sciences, School of Health Sciences at Narita, International University of Health and Welfar, Narita, Japan, 3MRTechnology Inc., Tsukuba, Japan
1Institute of Applied Physics, University of Tsukuba, Tsukuba, Japan, 2Department of Radiological Sciences, School of Health Sciences at Narita, International University of Health and Welfar, Narita, Japan, 3MRTechnology Inc., Tsukuba, Japan
Synopsis
23Na MRI provides novel information on energy metabolism, and there are growing expectations for its application in clinical MRI. However, implementation of 23Na MRI for existing 1H MRI systems requires expensive dedicated transceivers and RF coils for sodium imaging. Here, we have developed an add-on crossband repeater system that can acquire 23Na MRI signals simply by inserting it into the magnet’s bore of an existing 1H MRI, and proved this concept by phantom and in vivo mouse experiments. This add-on platform is applicable to other 1H MRI systems and will enhance the feasibility of 23Na MRI in clinical practice.
INTRODUCTION
Sodium MRI provides novel information on energy metabolism, and has the potential to elucidate physiological processes [1] in kidneys, brains, heart, knees, skins, and etc. However, clinical sodium MR imaging remains expensive because of high cost of broadband multi-nuclear transmit/receive spectrometer and dedicated RF coils for sodium imaging. These high costs and poor availability are the large impediment for clinical application of sodium MRI. In this study, we developed a novel add-on 23Na MRI platform (crossband repeater, CBR) consisting of a crossband convertor and receive/transmit coils, that could be built into an existing 1H MRI scanner without the need for modifying the scanner configuration. This study presents an initial proof-of-concept for the add-on 23Na MRI CBR to a 1.5T 1H scanner, followed by its application to in vivo imaging of live mouse. The concept of the proposed system is applicable to other 1H scanners, and would expand the opportunity for researchers to assess clinical applications of sodium MRI.METHOD
Concept of add-on 23Na MRI crossband repeaterWe focused on the CBR technology used in wireless communication, and applied it to transmit signals between the 1H and 23Na resonance frequencies. The overview and diagram of the add-on 23Na MRI CBR operated at 1.5T are shown in Figs. 1 and 2. The 64MHz excitation pulses transmitted from the 1.5T 1H-MRI system are received by a 1H pick-up coil in the gantry, downconverted to 17MHz 23Na excitation pulse through frequency mixer I, amplified by an RF transmitter, and transmitted to a 23Na RF coil to excite a sample and acquire NMR signals. The acquired 17MHz 23Na signal is amplified, upconverted to 64 MHz through frequency mixer II, and transmitted back to the 1H-MRI by a 1H transmit coil. In this system, the MRI signal received by the 23Na coil is passed to the 1H receiver coil by electromagnetic coupling; The 1H-MRI system operates as if it is receiving the 1H signal, but what is actually acquired is 23Na signal modulated to 64MHz.
Apparatus
The 1H-MRI system consisted of a 1.5T/280mm horizontal-bore superconducting magnet (JASTEC, Japan), gradient coil, transmit/receive RF coil (birdcage coil, 8-elements, 110mm in diameter, 130mm in length), and MRI console. The add-on 23Na platform consisted of a crossband convertor (DSTechnology, Saitama, Japan) 23Na transmit/receive coil (17 MHz, birdcage coil, 8-elements, 42mm in diameter, 120mm in length), 1H pick-up receive/transmit coils (64MHz, loop coils, 50mm in diameter), RF amplifier (500kHz - 150MHz, 2kW, BTO2000-AlphaSA, TOMCO, Australia), RF shield between a sample and 1H transmit coil, and TX/RX switch and 23Na preamplifier (17MHz). All the coils were homebuilt.
Bench test of control signals
We measured the fidelity and time response of the control signals using an oscilloscope (2GHz, ViewGo II, IWATSU, Japan).
Sensitivity measurement
To evaluate the sensitivity of the 23Na signals, the noise and FID signals from phantoms (saturated saline solution and purified water) were measured in the following three cases: (A) using a conventional 23Na transceiver (as a reference) (Fig. 2(b)), (B) using the CBR (Fig. 2(c)), and (C) using the CBR with direct, bypass electrical connection from the crossband convertor to the 1H-MRI transceiver using a BNC cable (dot-dashed line in Fig. 2(c)), instead of connecting via electromagnetic coupling between the 1H transmit coil of the CBR and the receive coil of the 1H system. The experiment C was performed to evaluate the signal loss in electromagnetic coupling between the two 1H RF coils.
In vivo imaging
A mouse under gas anesthesia (C57BL/6(M), 6 weeks) was imaged using 3D gradient echo sequences. The sequence parameters for 1H imaging were; matrix size = 128×64×32, repetition time (TR) / echo time (TE) = 100ms/15ms, and scan time = 13min 40sec. Those of 23Na imaging were; matrix size = 64×32×32, TR/TE = 40ms/2.8ms, number of excitations = 80, compressed sensing with acceleration factor of 3, and scan time = 18min 12sec.
RESULT
The bench tests (Fig. 3) of the RF excitation pulses show that the output signals tracked the input signals with high fidelity and short rise/fall times.From the sensitivity measurement of the MRI signals (Fig. 4), the total signal loss in the CBR system (B) was 21.1dB (equals to a summation of 9.1dB loss in the crossband convertor and 12.0dB loss in the electromagnetic coupling), compared with the conventional 23Na system (A). The signal-to-noise ratios (SNRs) were 37.9dB (A), 34.1dB (B), and 35.2dB (C).
Figure 5 shows the results of 1H/23Na imaging. The 23Na MRI’s SNR in the bladder were 21.7dB, comparable to that of the reference saline solution phantom (18.6dB).
DISCUSSSION
The control signals generated in the CBR had high fidelity, allowing the acquisition of 23Na signals in synchronization with the existing 1H system. Despite the large signal loss compared with the conventional 23Na system, the CBR system provided the 1H/23Na images with the high SNR comparable to the conventional system. The performance of the system was verified by live mouse imaging.CONCLUSION
We have developed the prototype of the add-on 23Na platform using the CBR, that can realize 23Na-MRI by simply attaching it to an existing 1H-MRI system.Acknowledgements
No acknowledgement found.References
[1] Hu R, Kleimaier D, Malzacher M, Hoesl MAU, Paschke NK, Schad LR. X‐nuclei imaging: current state, technical challenges, and future directions. J Magn Reson Imaging. 2020;51:355‐376.Figures
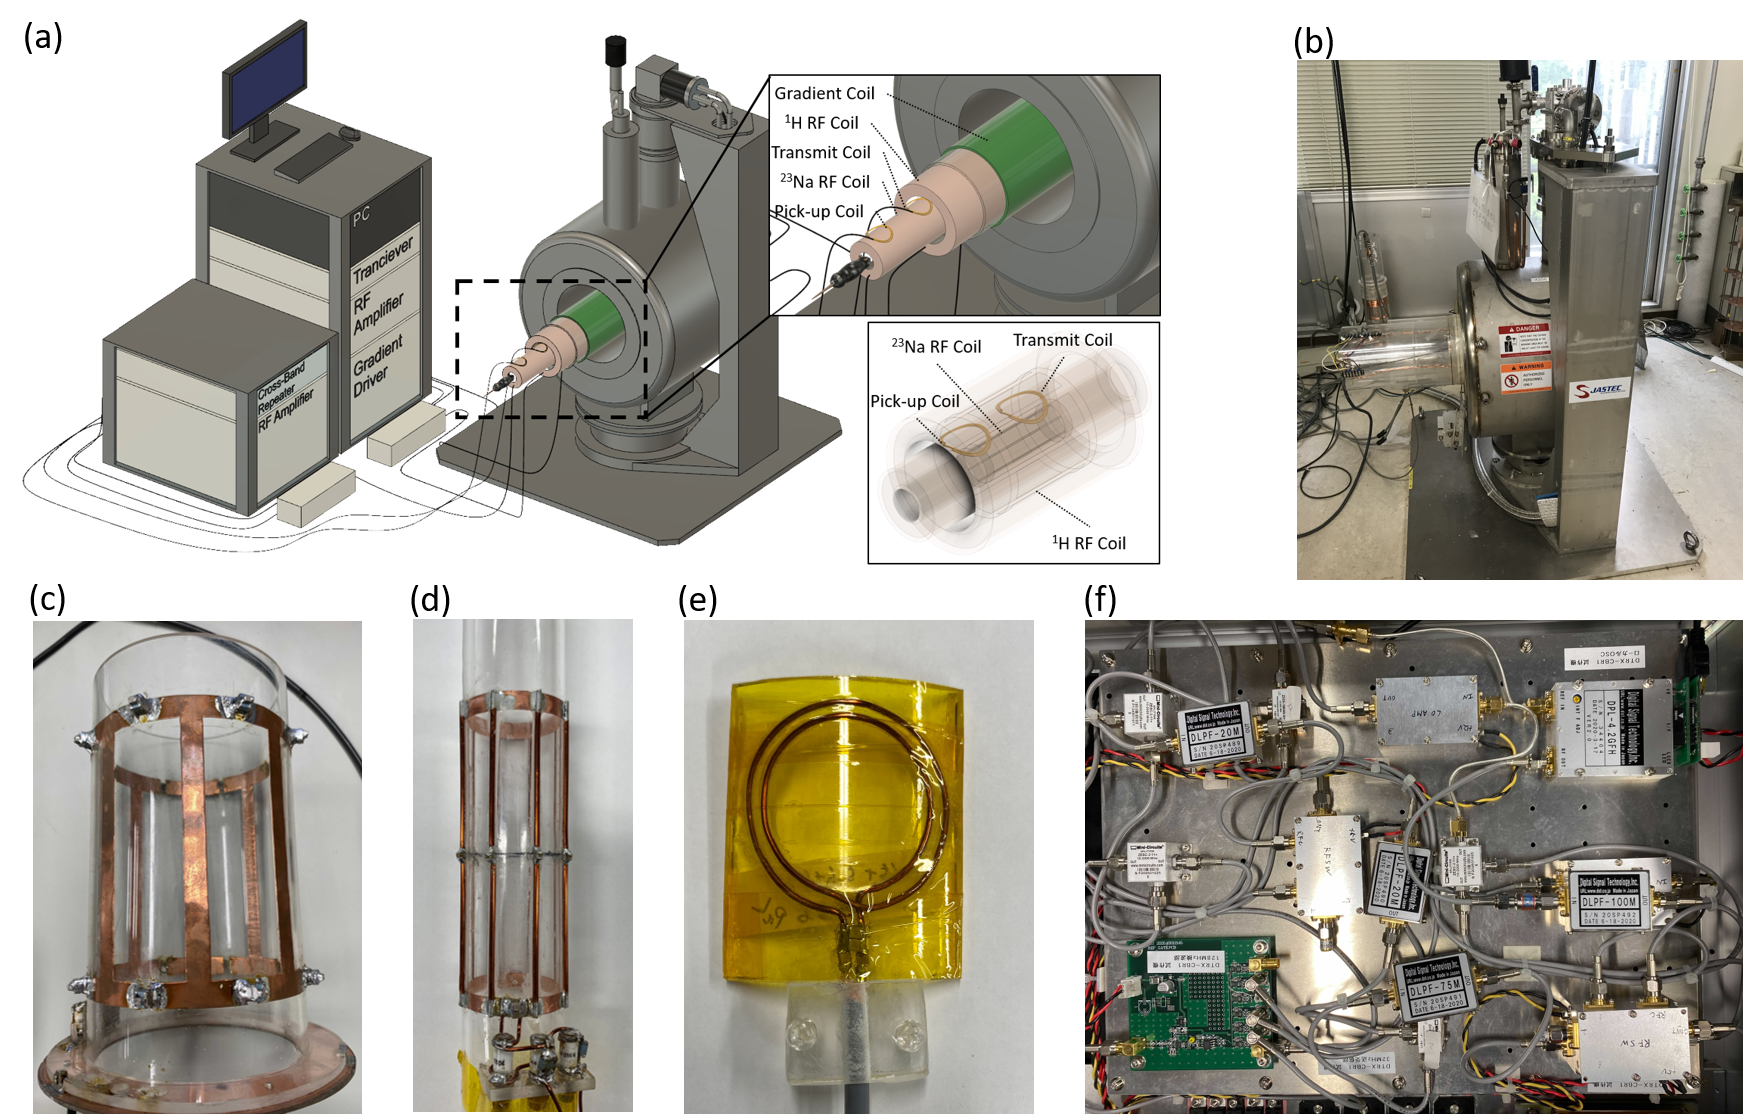
Fig.
1 Add-on 23Na MRI platform equipped with the 1.5T 1H
system. (a) Schematic overview of the system. (b) 1.5T magnet. (c) 1H
transmit/receive coil without the RF shield. (d) 23Na
transmit/received coil without the RF shield. (e) 1H pick-up coil.
(f) Crossband convertor.
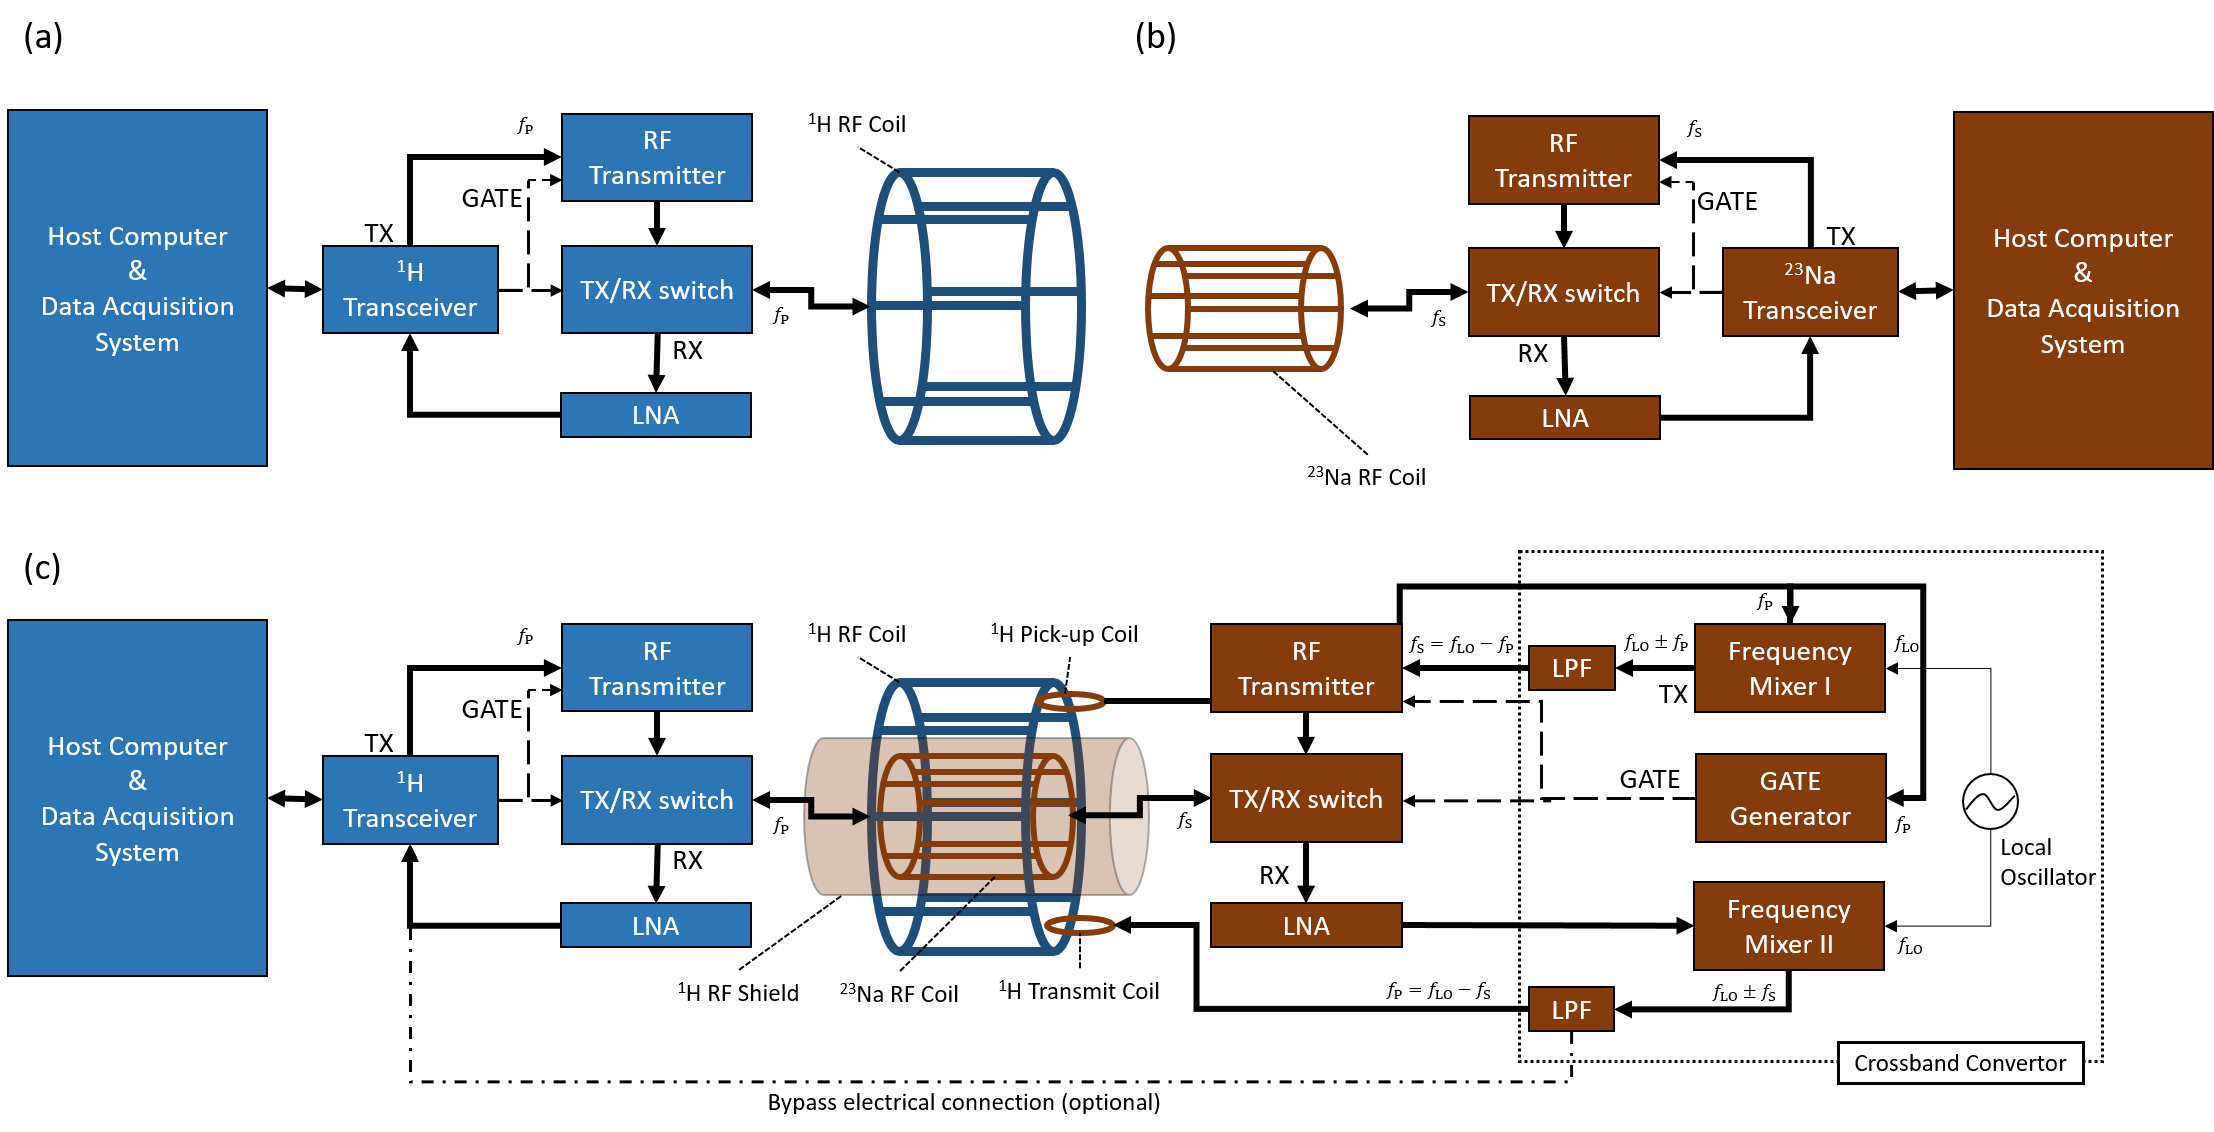
Fig.2 System block diagram. (a) Conventional 1H-MRI
system. (b) Conventional 23Na-MRI system. (c) Add-on 23Na-MRI
platform using CBR (drawn in red) inserted into a conventional 1H-MRI
system (drawn in blue). The dot-dashed line in Fig. (c) is the bypass
electrical connection from the crossband convertor to the 1H-MRI transceiver
to evaluate the signal loss in the electromagnetic coupling between 1H
transmit coil of the CBR and 1H receive coil of the 1H-MRI
system.
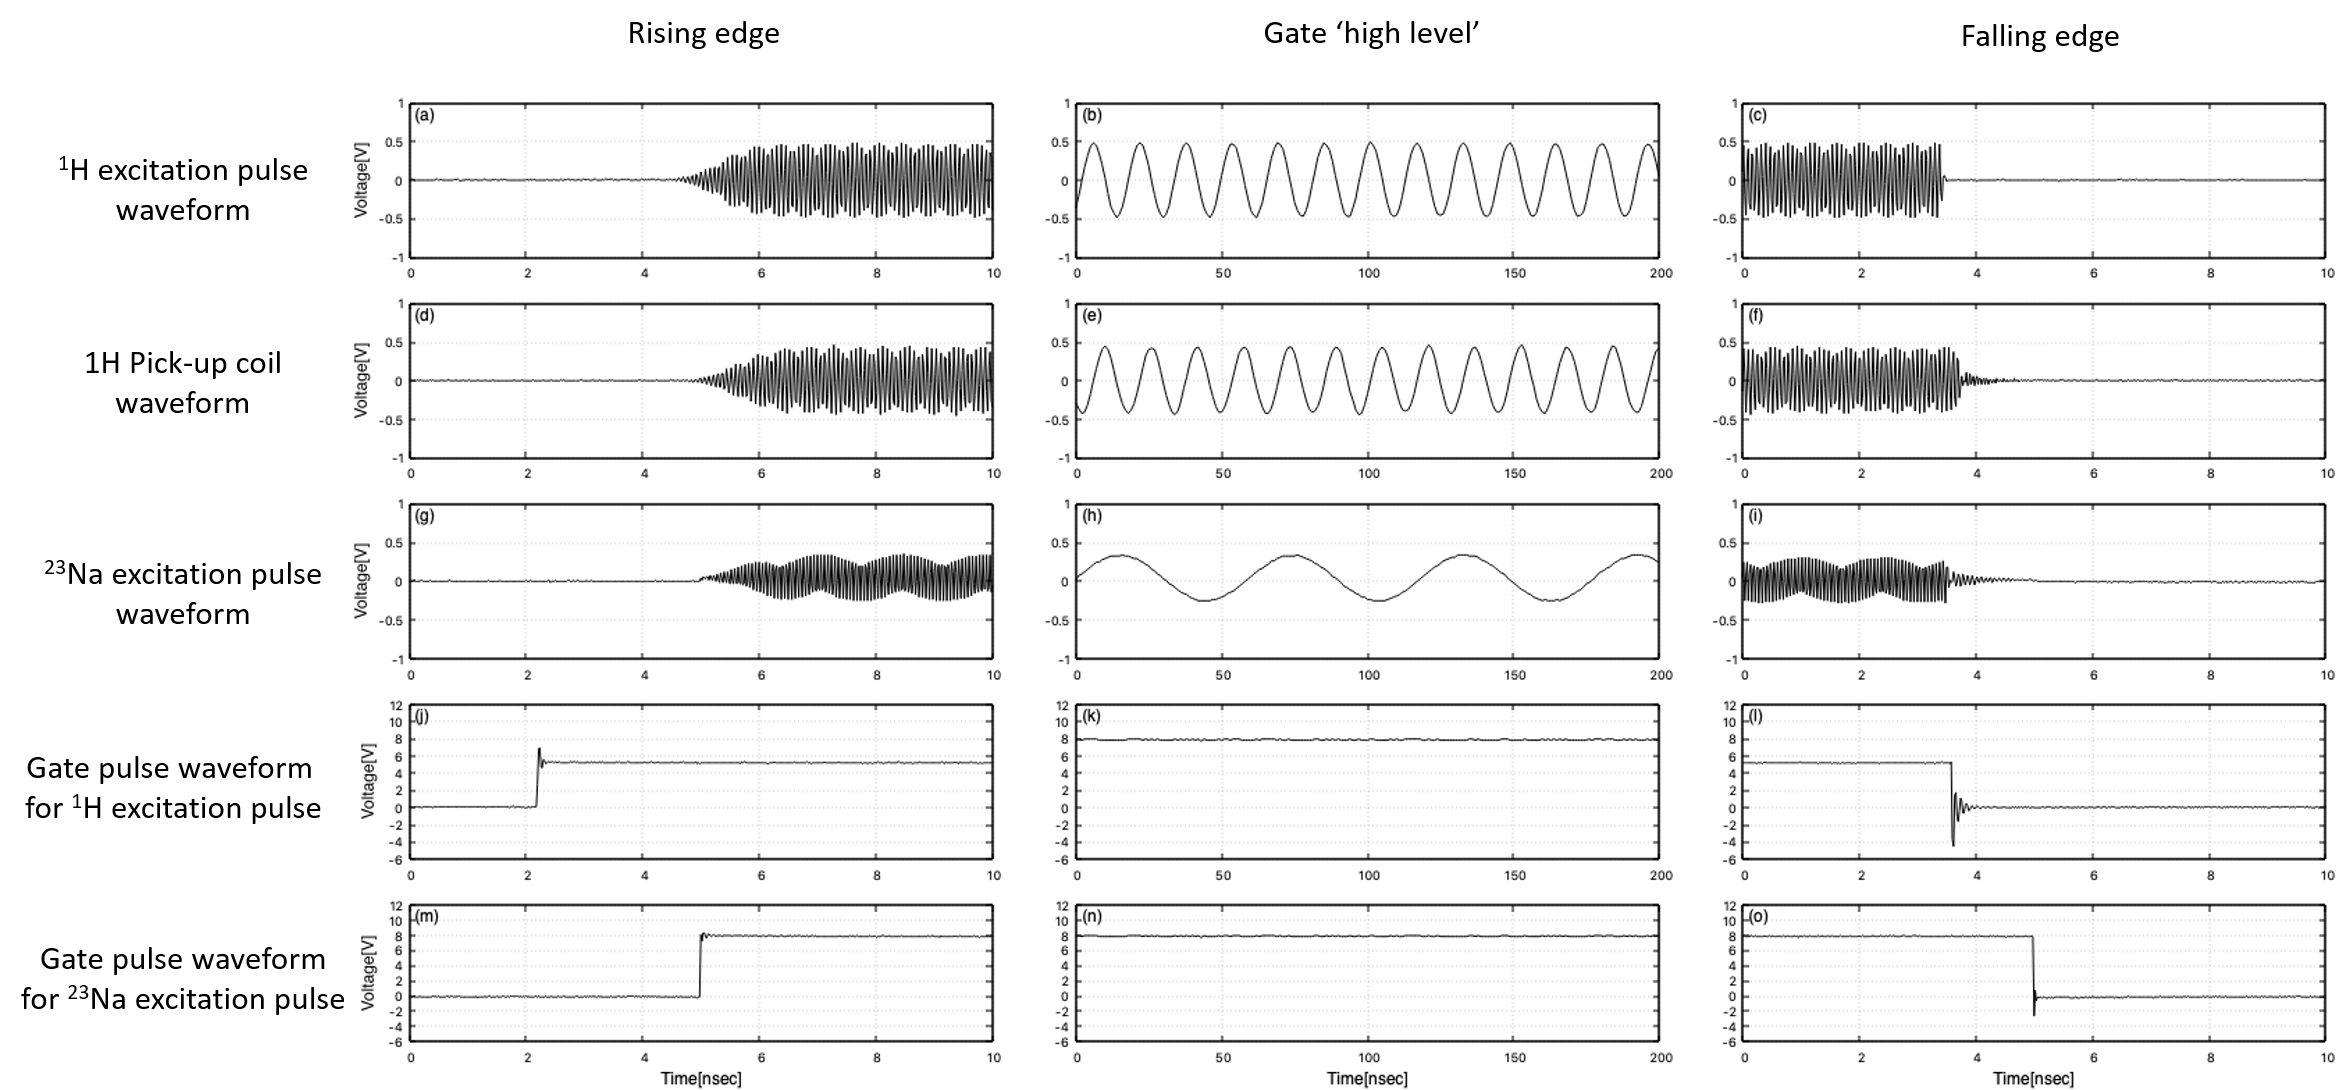
Fig.3 Bench
test of control signals for gate and 23Na RF pulse excitation. (a-c)
1H excitation pulse waveform output from the 1H
transceiver. (d-f) 1H pick-up coil voltage waveform received by the
CBR. (g-i) 23Na excitation pulse waveform output from the CBR. (j-l)
Gate pulse waveform for 1H excitation pulse output from the 1H transceiver.
(m-o) Gate pulse waveform for 23Na excitation pulse output from the
CBR.
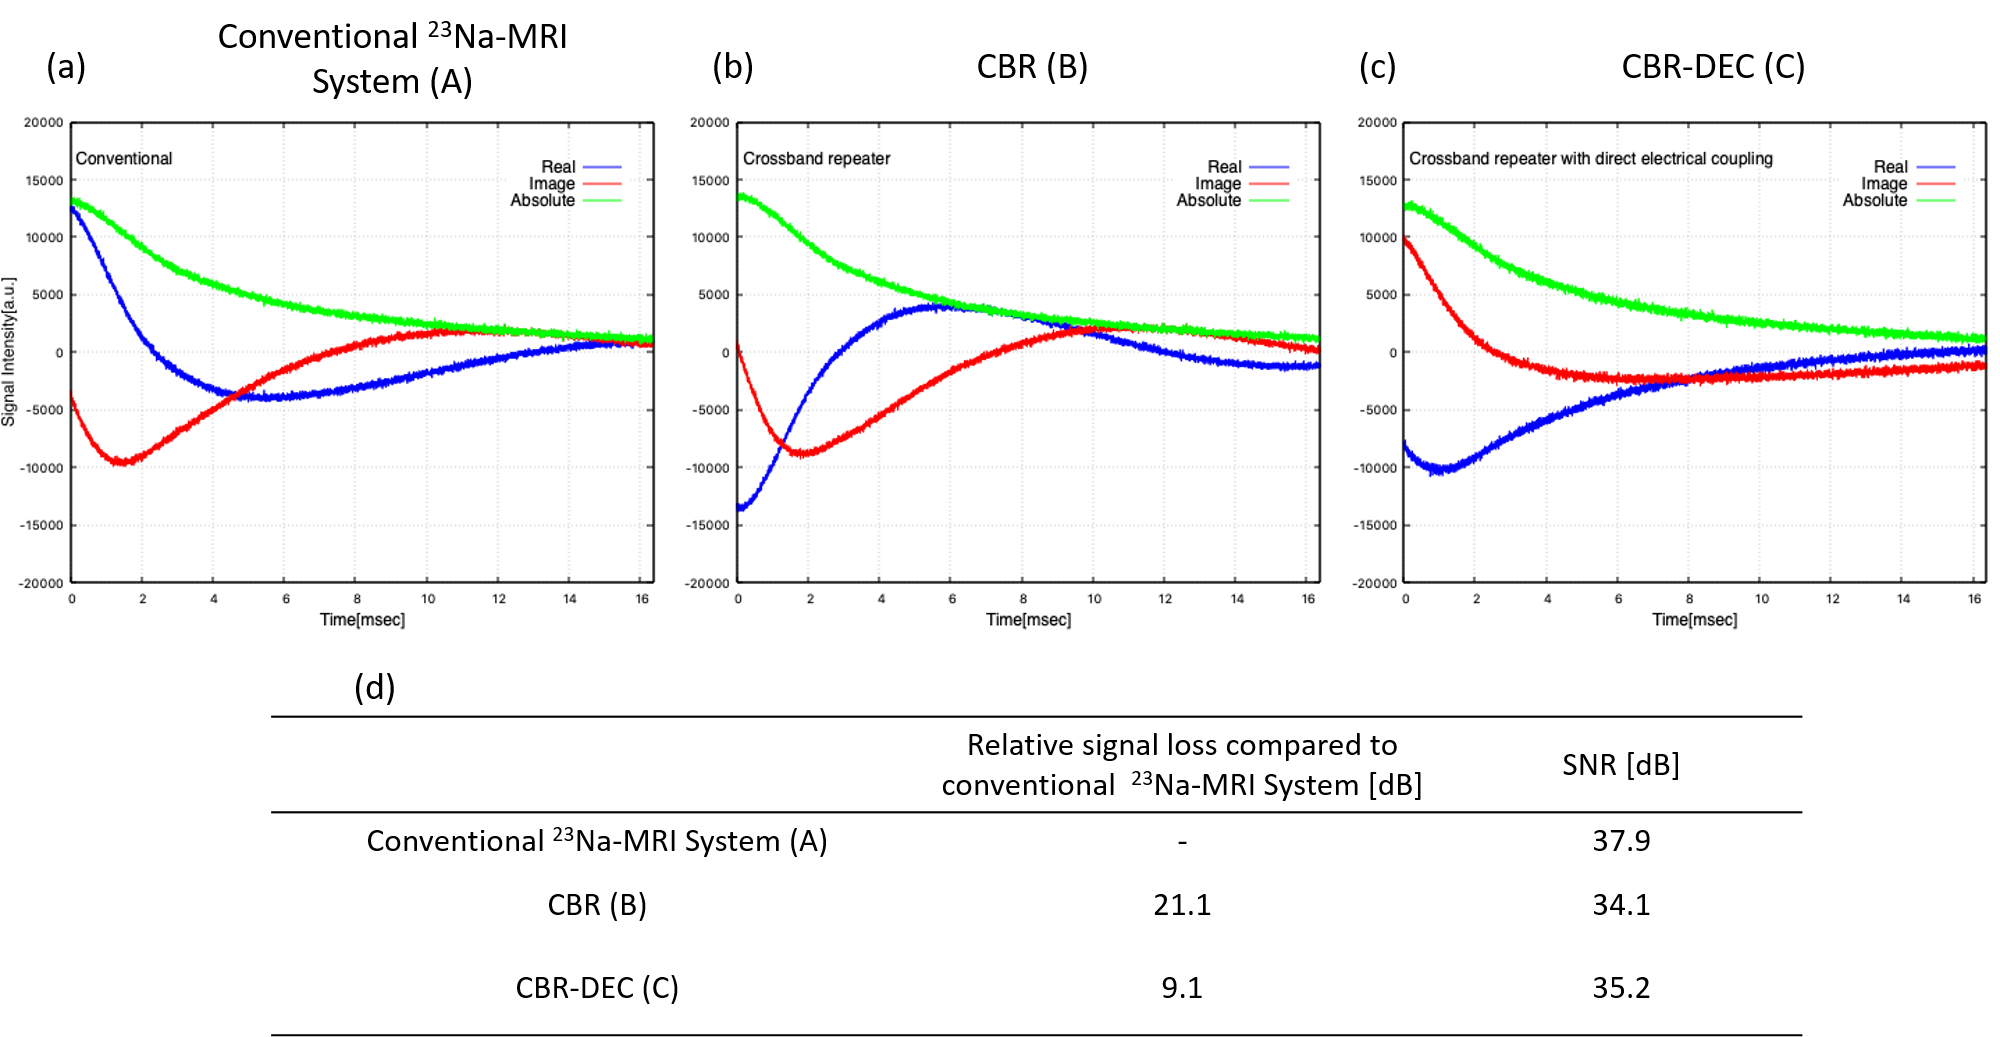
Fig.
4 Sensitivity measurement results for three experimental setups. (a-c) 23Na
FID signals obtained with (a) the conventional 23Na system (A), (b)
CBR (B), and (c) CBR-DEC (C). CBR: crossband repeater; CBR-DEC: crossband
repeater with direct electrical connection. (d) Relative signal loss and SNR.
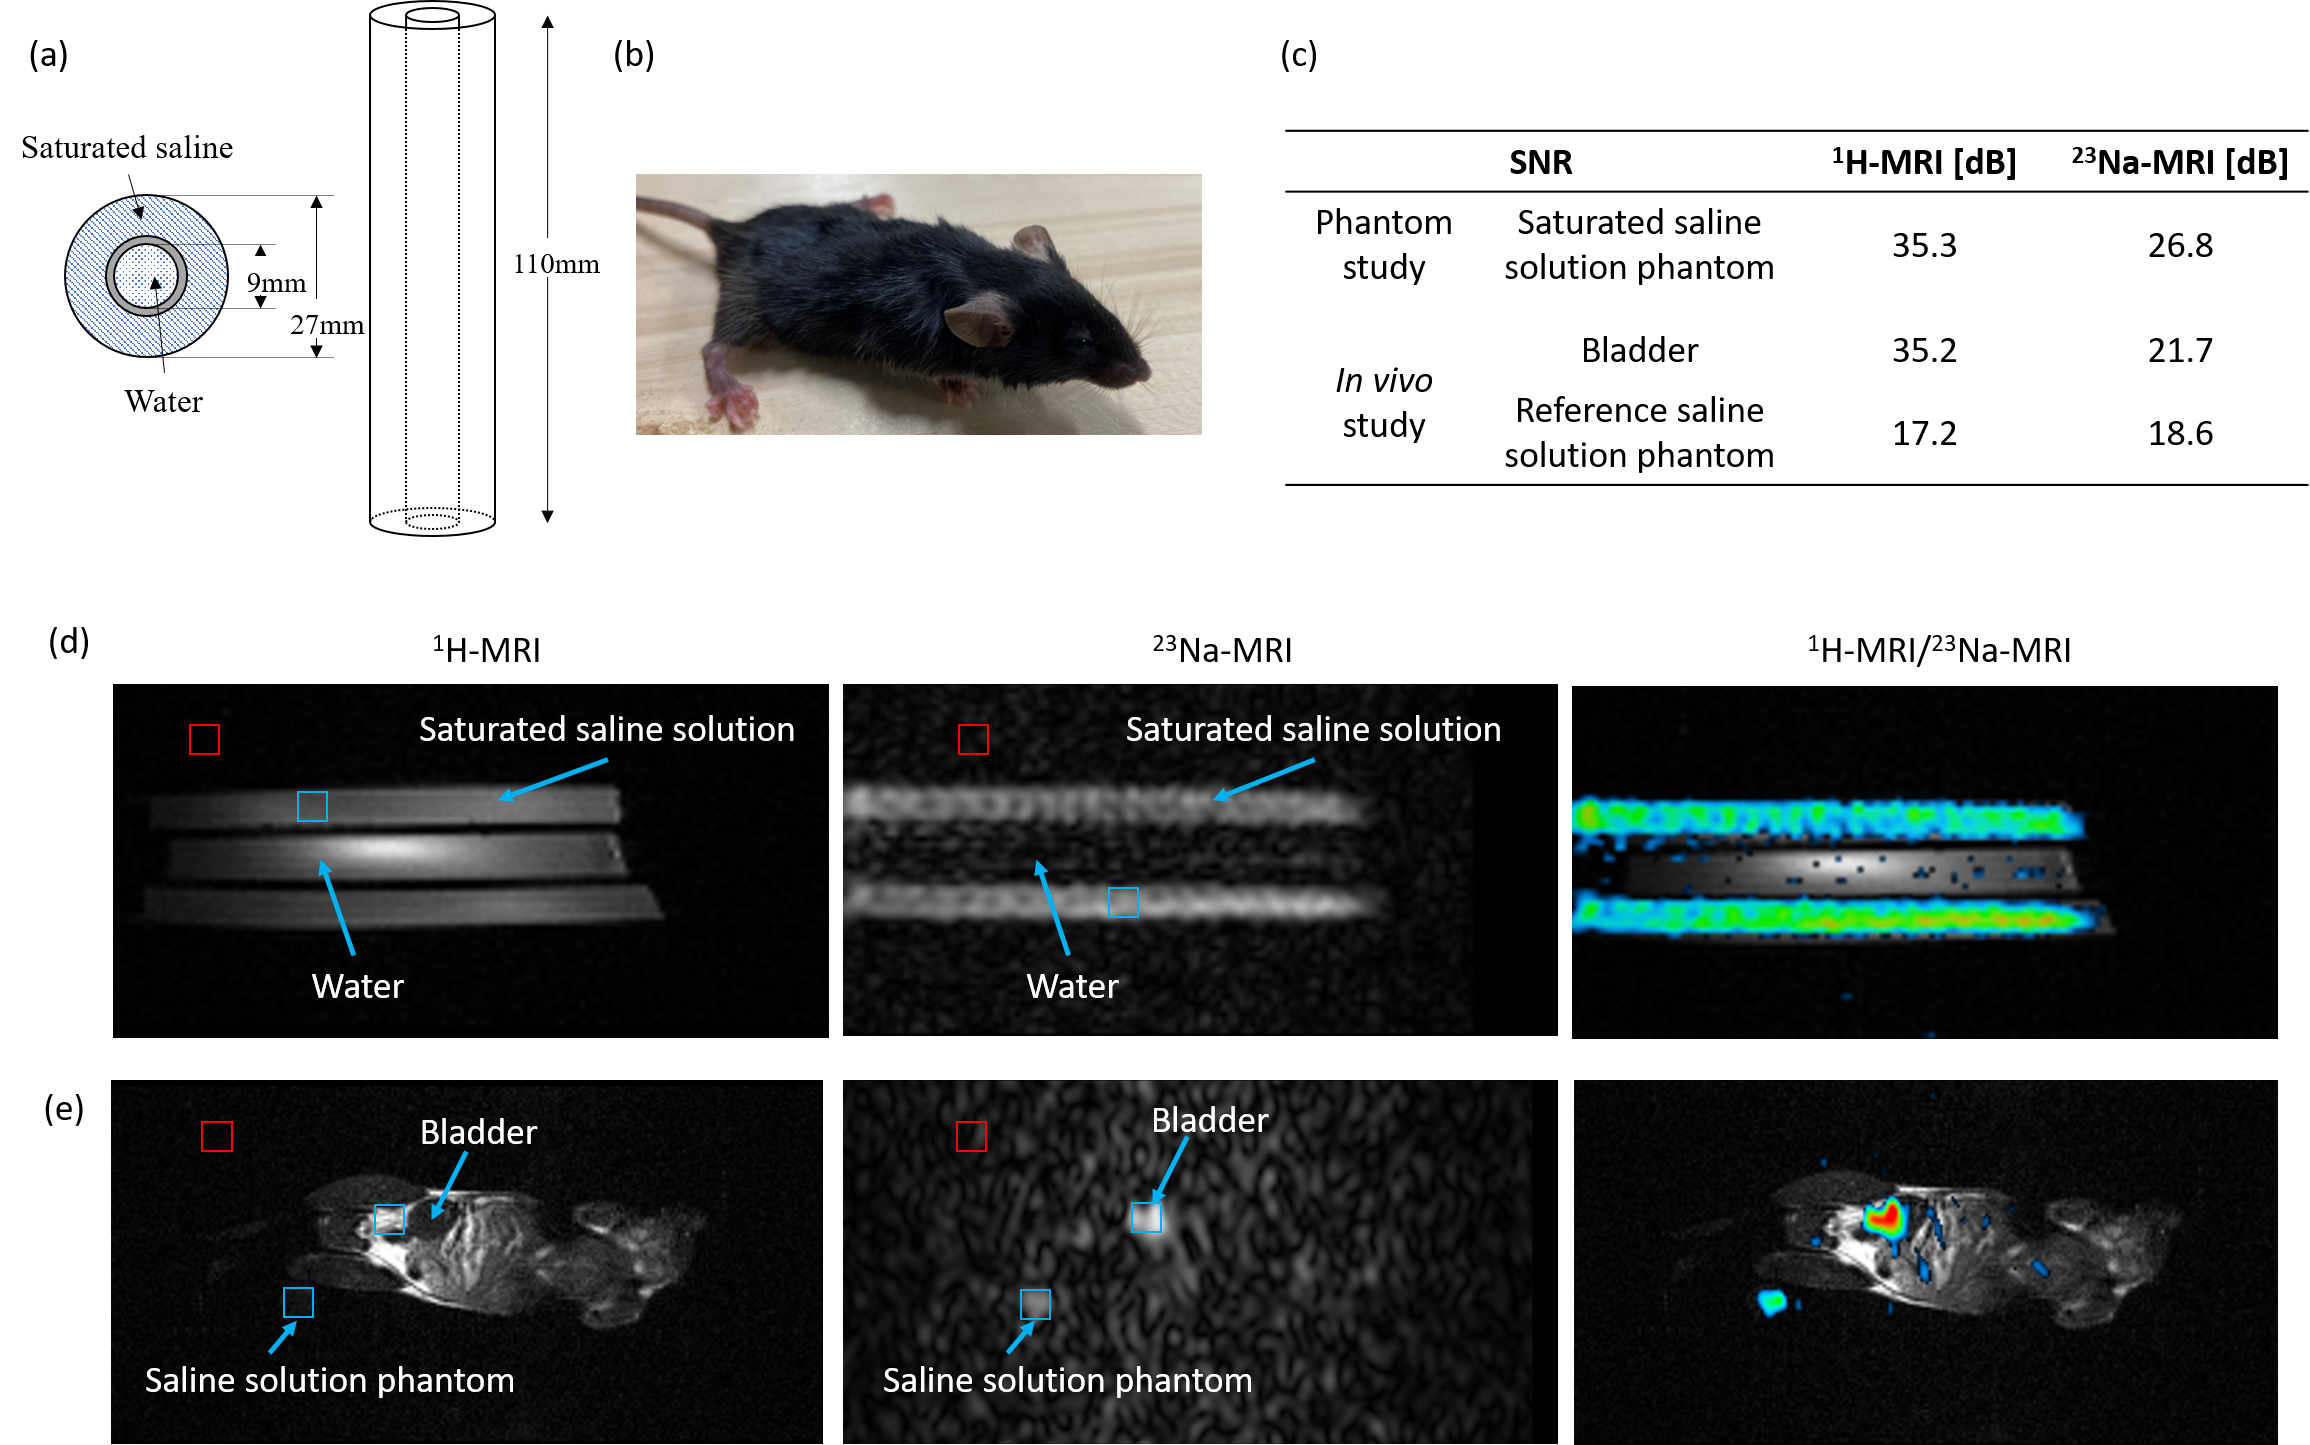
Fig.
5 Demonstration of 1H/23Na imaging. (a) Saturated saline
and water phantom. (b) Live mouse. (c) SNR measured in phantom and in vivo
studies. (d,e) 1H-MRI and 23Na-MRI for (d) phantom and (e)
live mouse. The red and blue squares indicate the noise and signal areas
evaluated for the SNR measurement, respectively.