1802
Deuterium Metabolic Imaging of the human brain at 9.4 T: Coil design and dynamic glucose uptake1High-Field MR Center, Max Planck Institute for Biological Cybernetics, Tuebingen, Germany, 2IMPRS for Cognitive and Systems Neuroscience, Eberhard-Karls University, Tuebingen, Germany, 3Institute of Radiology, University Hospital Erlangen, Erlangen, Germany, 4Division of Medical Physics in Radiology, German Cancer Research Center (DKFZ), Heidelberg, Germany, 5Radiology and Biomedical Imaging, Yale University, New Haven, CT, United States, 6Advanced Imaging Research Center, UT Southwestern Medical Center, Dallas, TX, United States
Synopsis
DMI (Deuterium Metabolic Imaging) is a technique that enables the investigation of metabolic turnover rates along predefined pathways non-invasively. In this work, we present first DMI data from the human brain at B0 = 9.4T and an investigation of the dynamic glucose uptake in different areas of the human head for healthy volunteers and after the oral administration of [6,6’-2H]-glucose. We present a dedicated phased array coil design and 2H MRSI data with high spatial resolution for water, glucose, Glx and lipid/lactate. Finally, we compare the uptake curves for different regions in the human head.
Purpose
To present first measurements of 2H MRS(I) of the human brain at 9.4T with an optimized coil design and after the oral administration of [6,6’-2H]-glucose.Introduction
Deuterium Metabolic Imaging (DMI) enables the investigation of metabolic pathways, by following the metabolic fate of deuterated substrates, like glucose1, 2, into a variety of metabolic products. Due to the low natural abundance of deuterium ( ̴ 0.0115%), 2H labeled substances can be used as tracers, e.g. in cancer research. Shown by de Graaf et al.3, the sensitivity of 2H scales supralinear with B0. Therefore, DMI greatly benefits from higher magnetic fields. In this work, we present first DMI data acquired at the human brain at 9.4T as well as dynamic metabolite uptakes in different brain areas after the oral administration of [6,6’-2H]-glucose.Method
The data was acquired at a Siemens Magnetom 9.4T whole body imaging system (Siemens Healthineers, Erlangen, Germany) with a double-tuned 2H/1H phased array coil (proton: 10 TxRx, deuterium: 8TxRx/2Rx) equivalent to Avdievitch et al.4. All volunteer measurements were approved by the local ethics committee. Deuterium B1+ maps were acquired with a phase-sensitive sequence with spiral readout5. The respective phantom contained 4 percent deuterated water and was matched to the electromagnetic conditions of the human brain (ε=53.83,σ=0.0992 S/m at 60 MHz) using sucrose and salt. Phantom images were acquired with a 3D CSI sequence6 to assess the receive sensitivity of the array coil.For the labeled glucose intake experiment, the healthy volunteers were asked not to eat anything 9h beforehand. 0.75g/kg body weight of [6,6’-2H]-glucose was dissolved in 150 ml to 200 ml water and consumed orally by the volunteers. For three volunteers, whole brain FID measurements were acquired with a temporal resolution of 2 minutes and the following parameters: TR=1s, averages 120, vector size 1024 and hard excitation pulse.
For six volunteers, 3D MRSI data with a temporal resolution of 10 minutes was acquired over a time course of 2h. The following parameters were used: FoV (180x200x180)mm3, grid size (12x13x14), TR=155 ms, 11 averages, Hamming weighting, rectangular non-selective excitation pulse with Tp=0.5 ms, flip angle = 51 deg, vector size 512 and acquisition bandwidth 5kHz. Additionally, a reference measurement prior to the intake of the labeled glucose was acquired. For anatomical imaging and tissue segmentation a MP2RAGE7 was acquired. Tissue segmentation was performed with SPM128. With a self-implemented python algorithm (version 2.7), the tissue type composition of each individual MRSI voxel was then calculated. The 2H MRSI data was quantified by a self-implemented version of the AMARES algorithm9 using Matlab R2018a.
Results and discussion
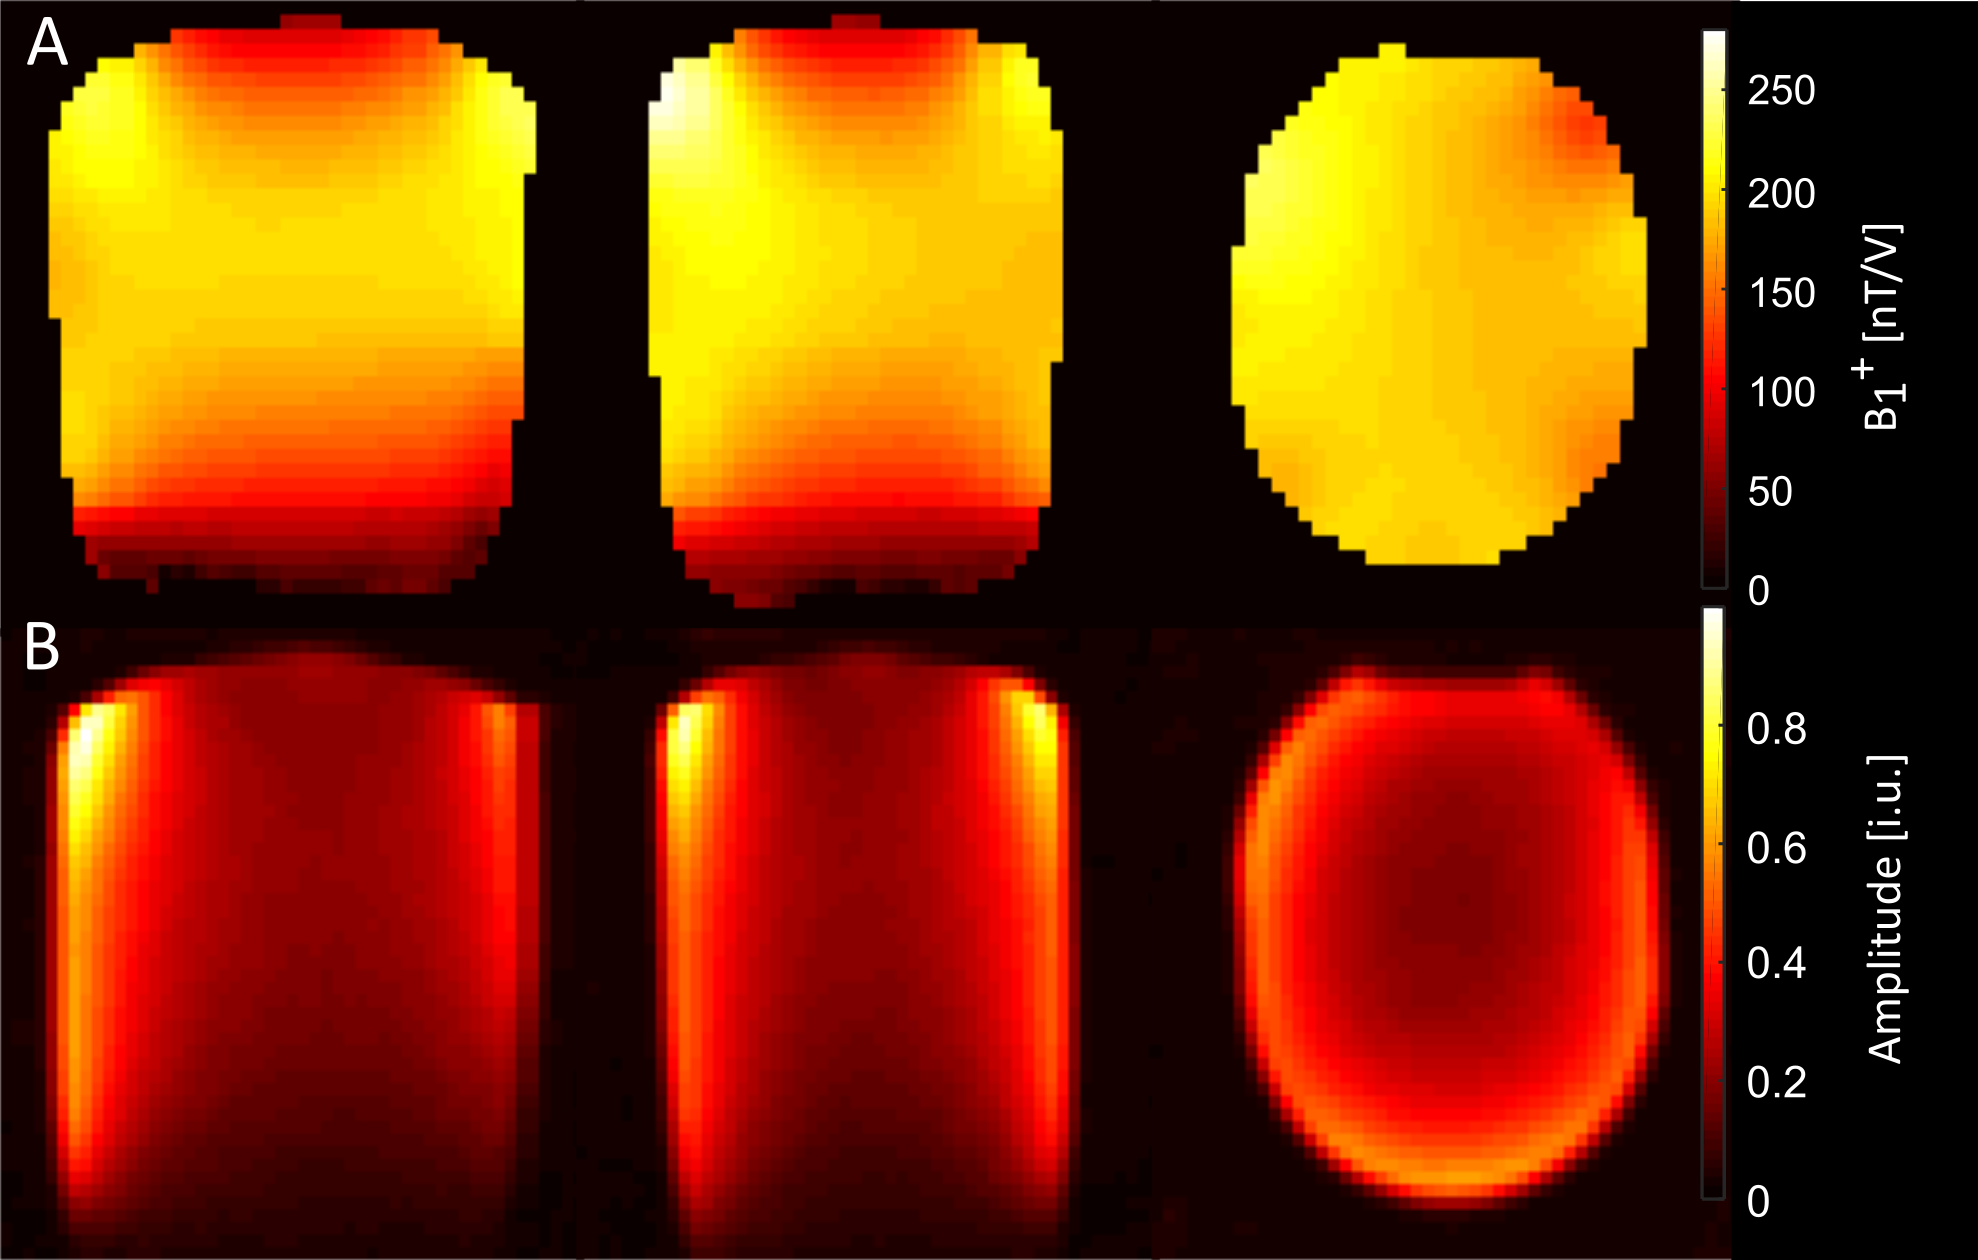
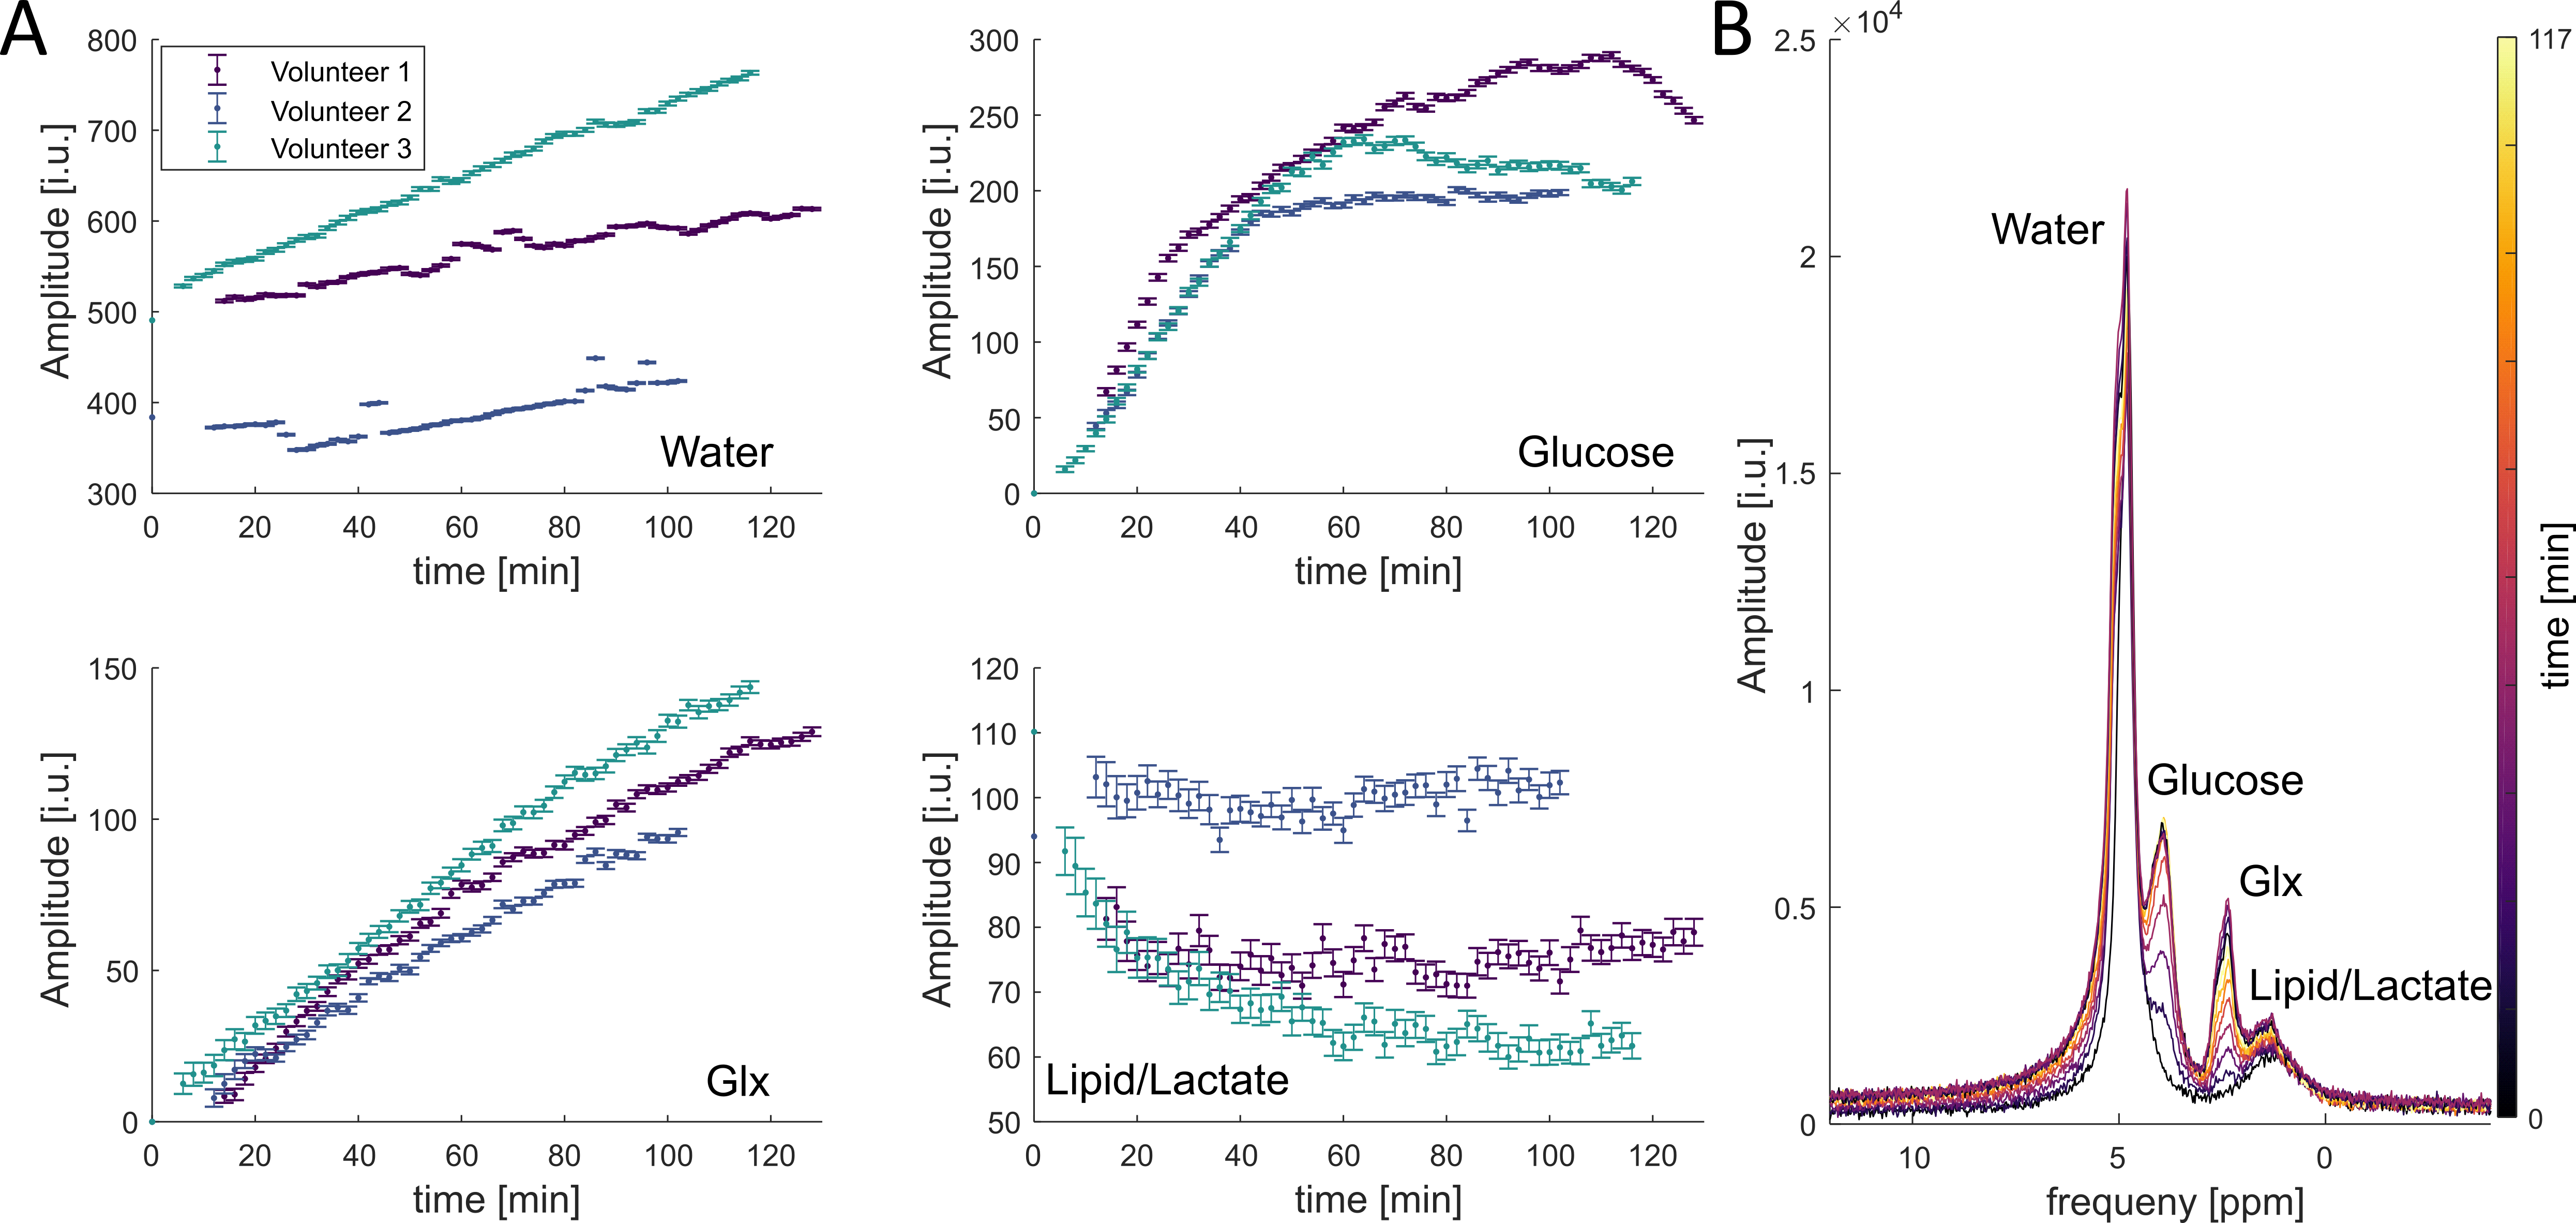
The B1+ transmit field and signal amplitude image of the 2H channels of the phased array are shown in figure 1. The coil has a higher sensitivity in the periphery than in the center as expected for a phased array coil.The results for the whole brain FID measurement for all measured volunteers are shown in figure 2. The most prominent resonance is deuterated water. Next to water, one can detect glucose and Glx (glutamate/glutamine). The fourth resonance can be assigned to lipids with a potential contribution of lactate. We detected a clear signal increase for water, glucose and Glx for all volunteers. The lipid/lactate resonance shows no consistent behavior across volunteers. The left side of figure 2 shows exemplary spectra from one volunteer for different time points.
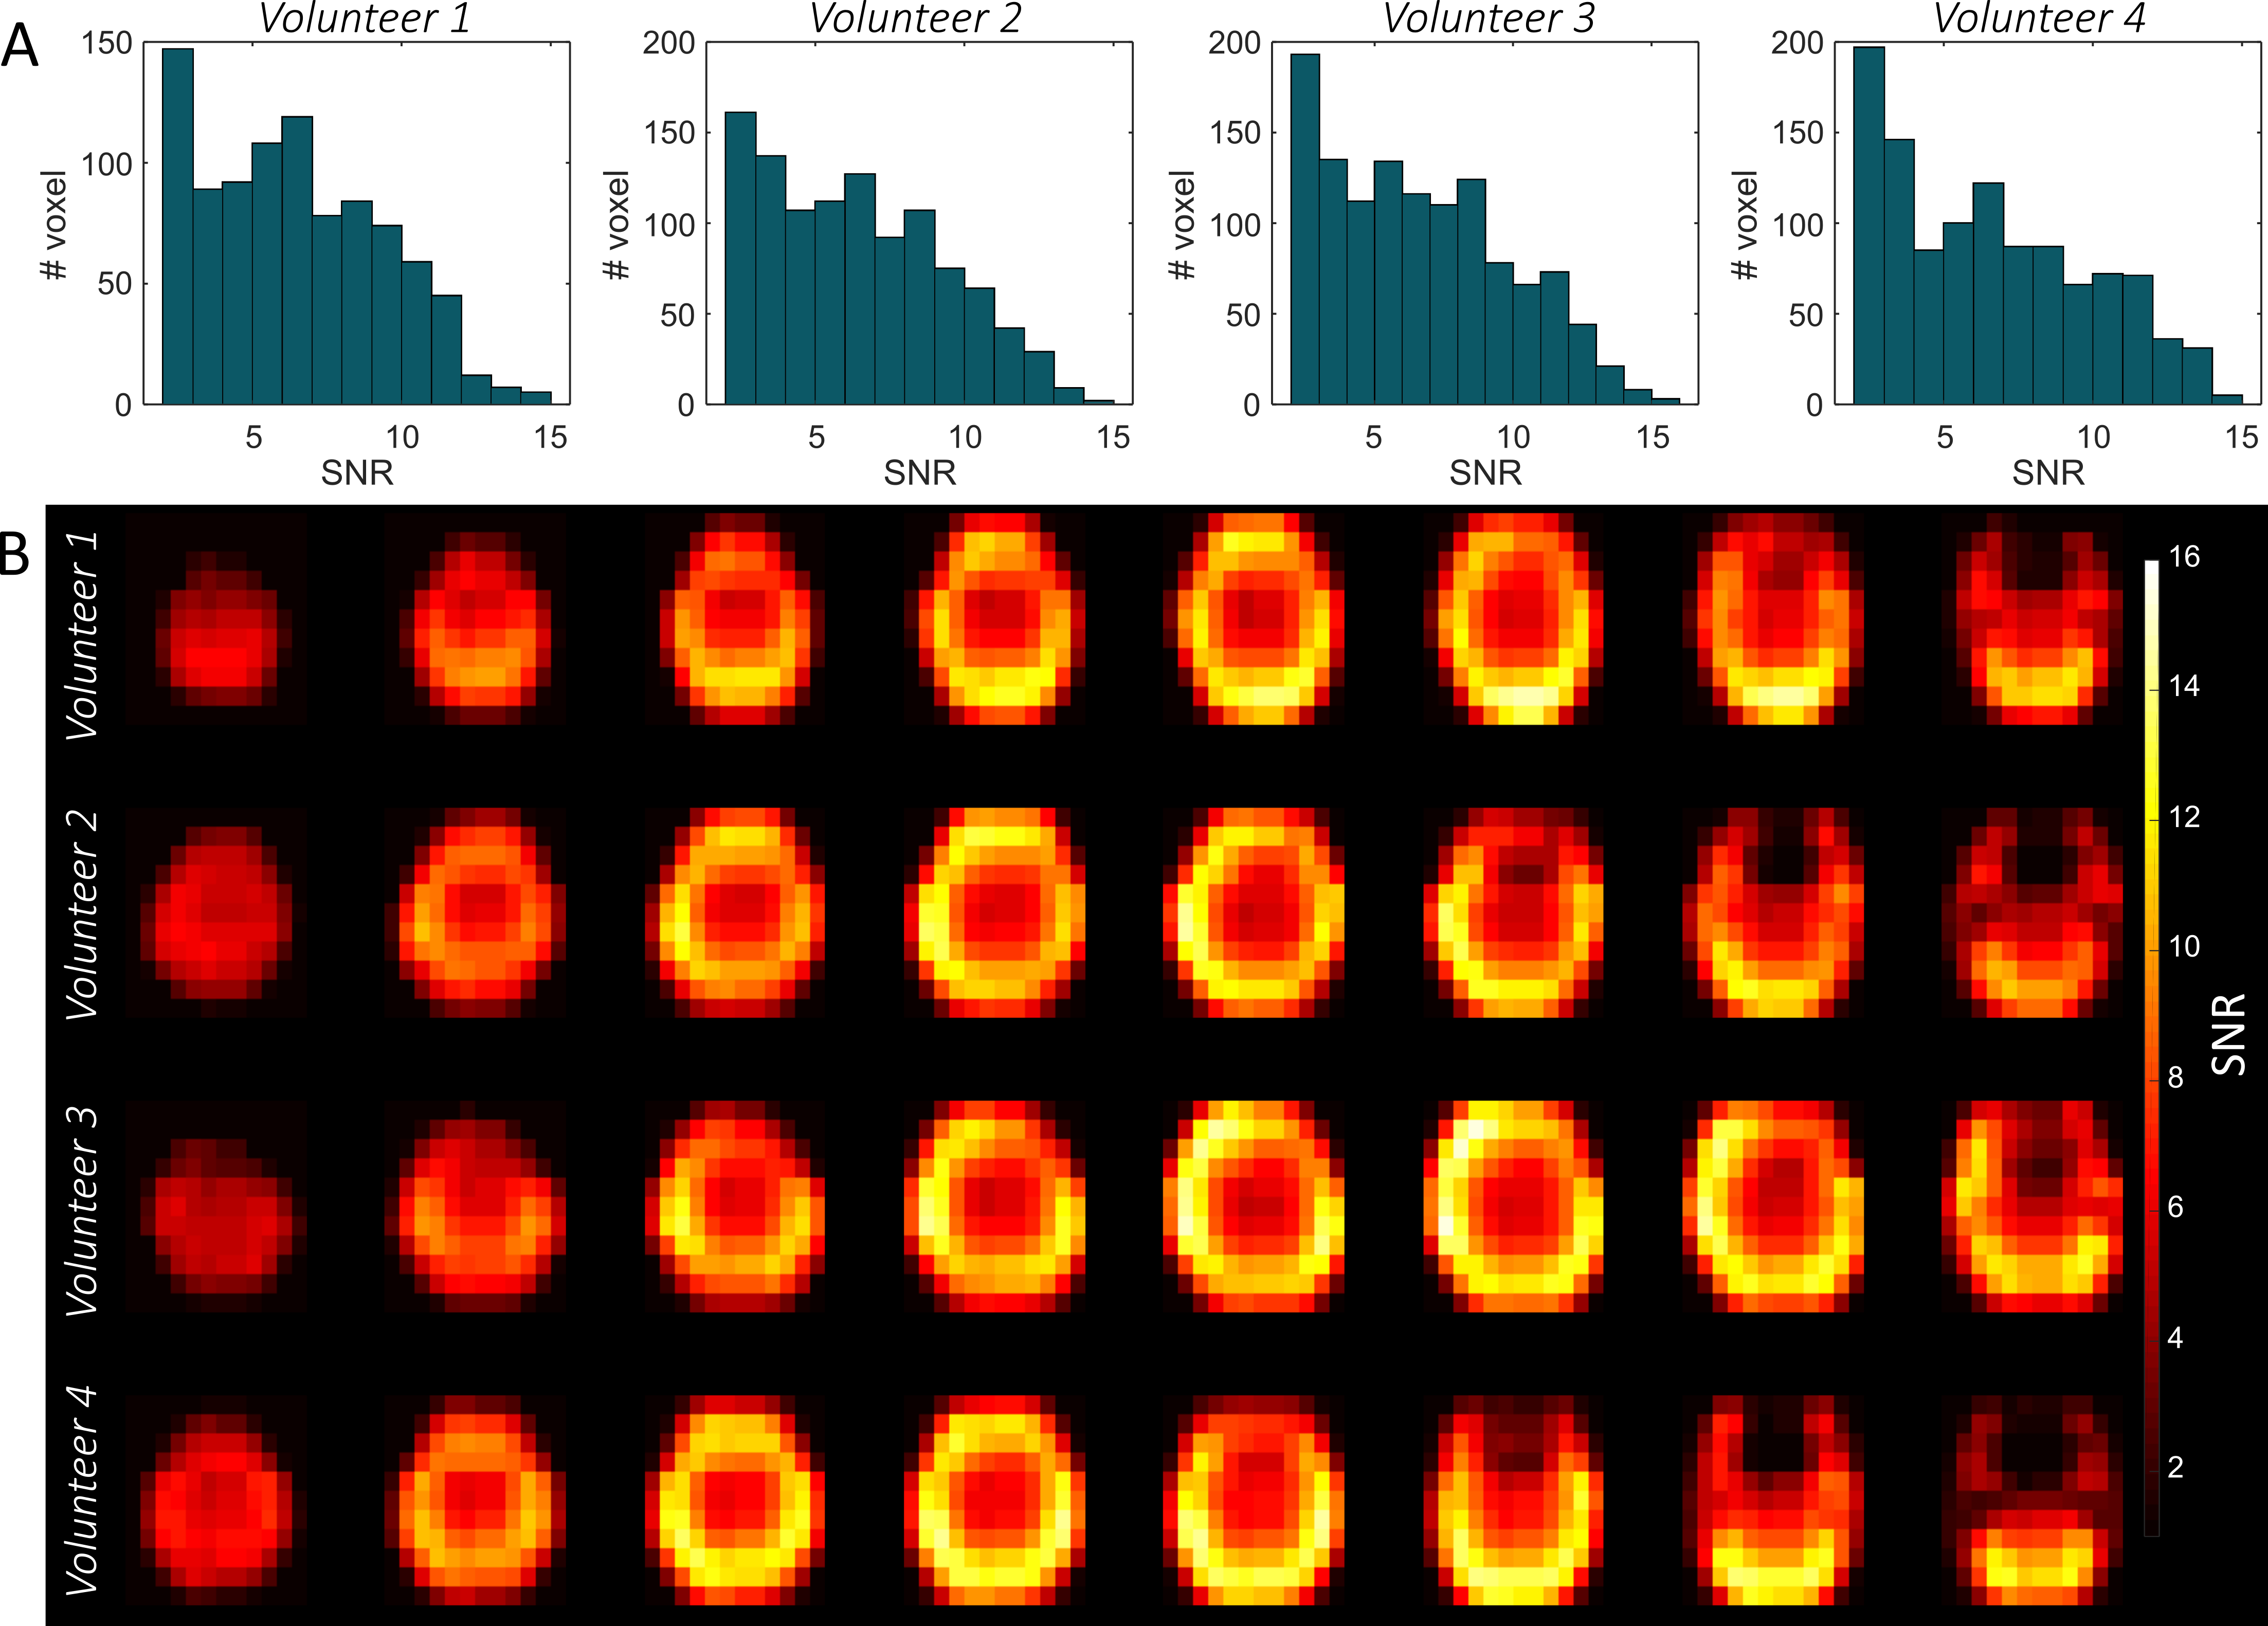
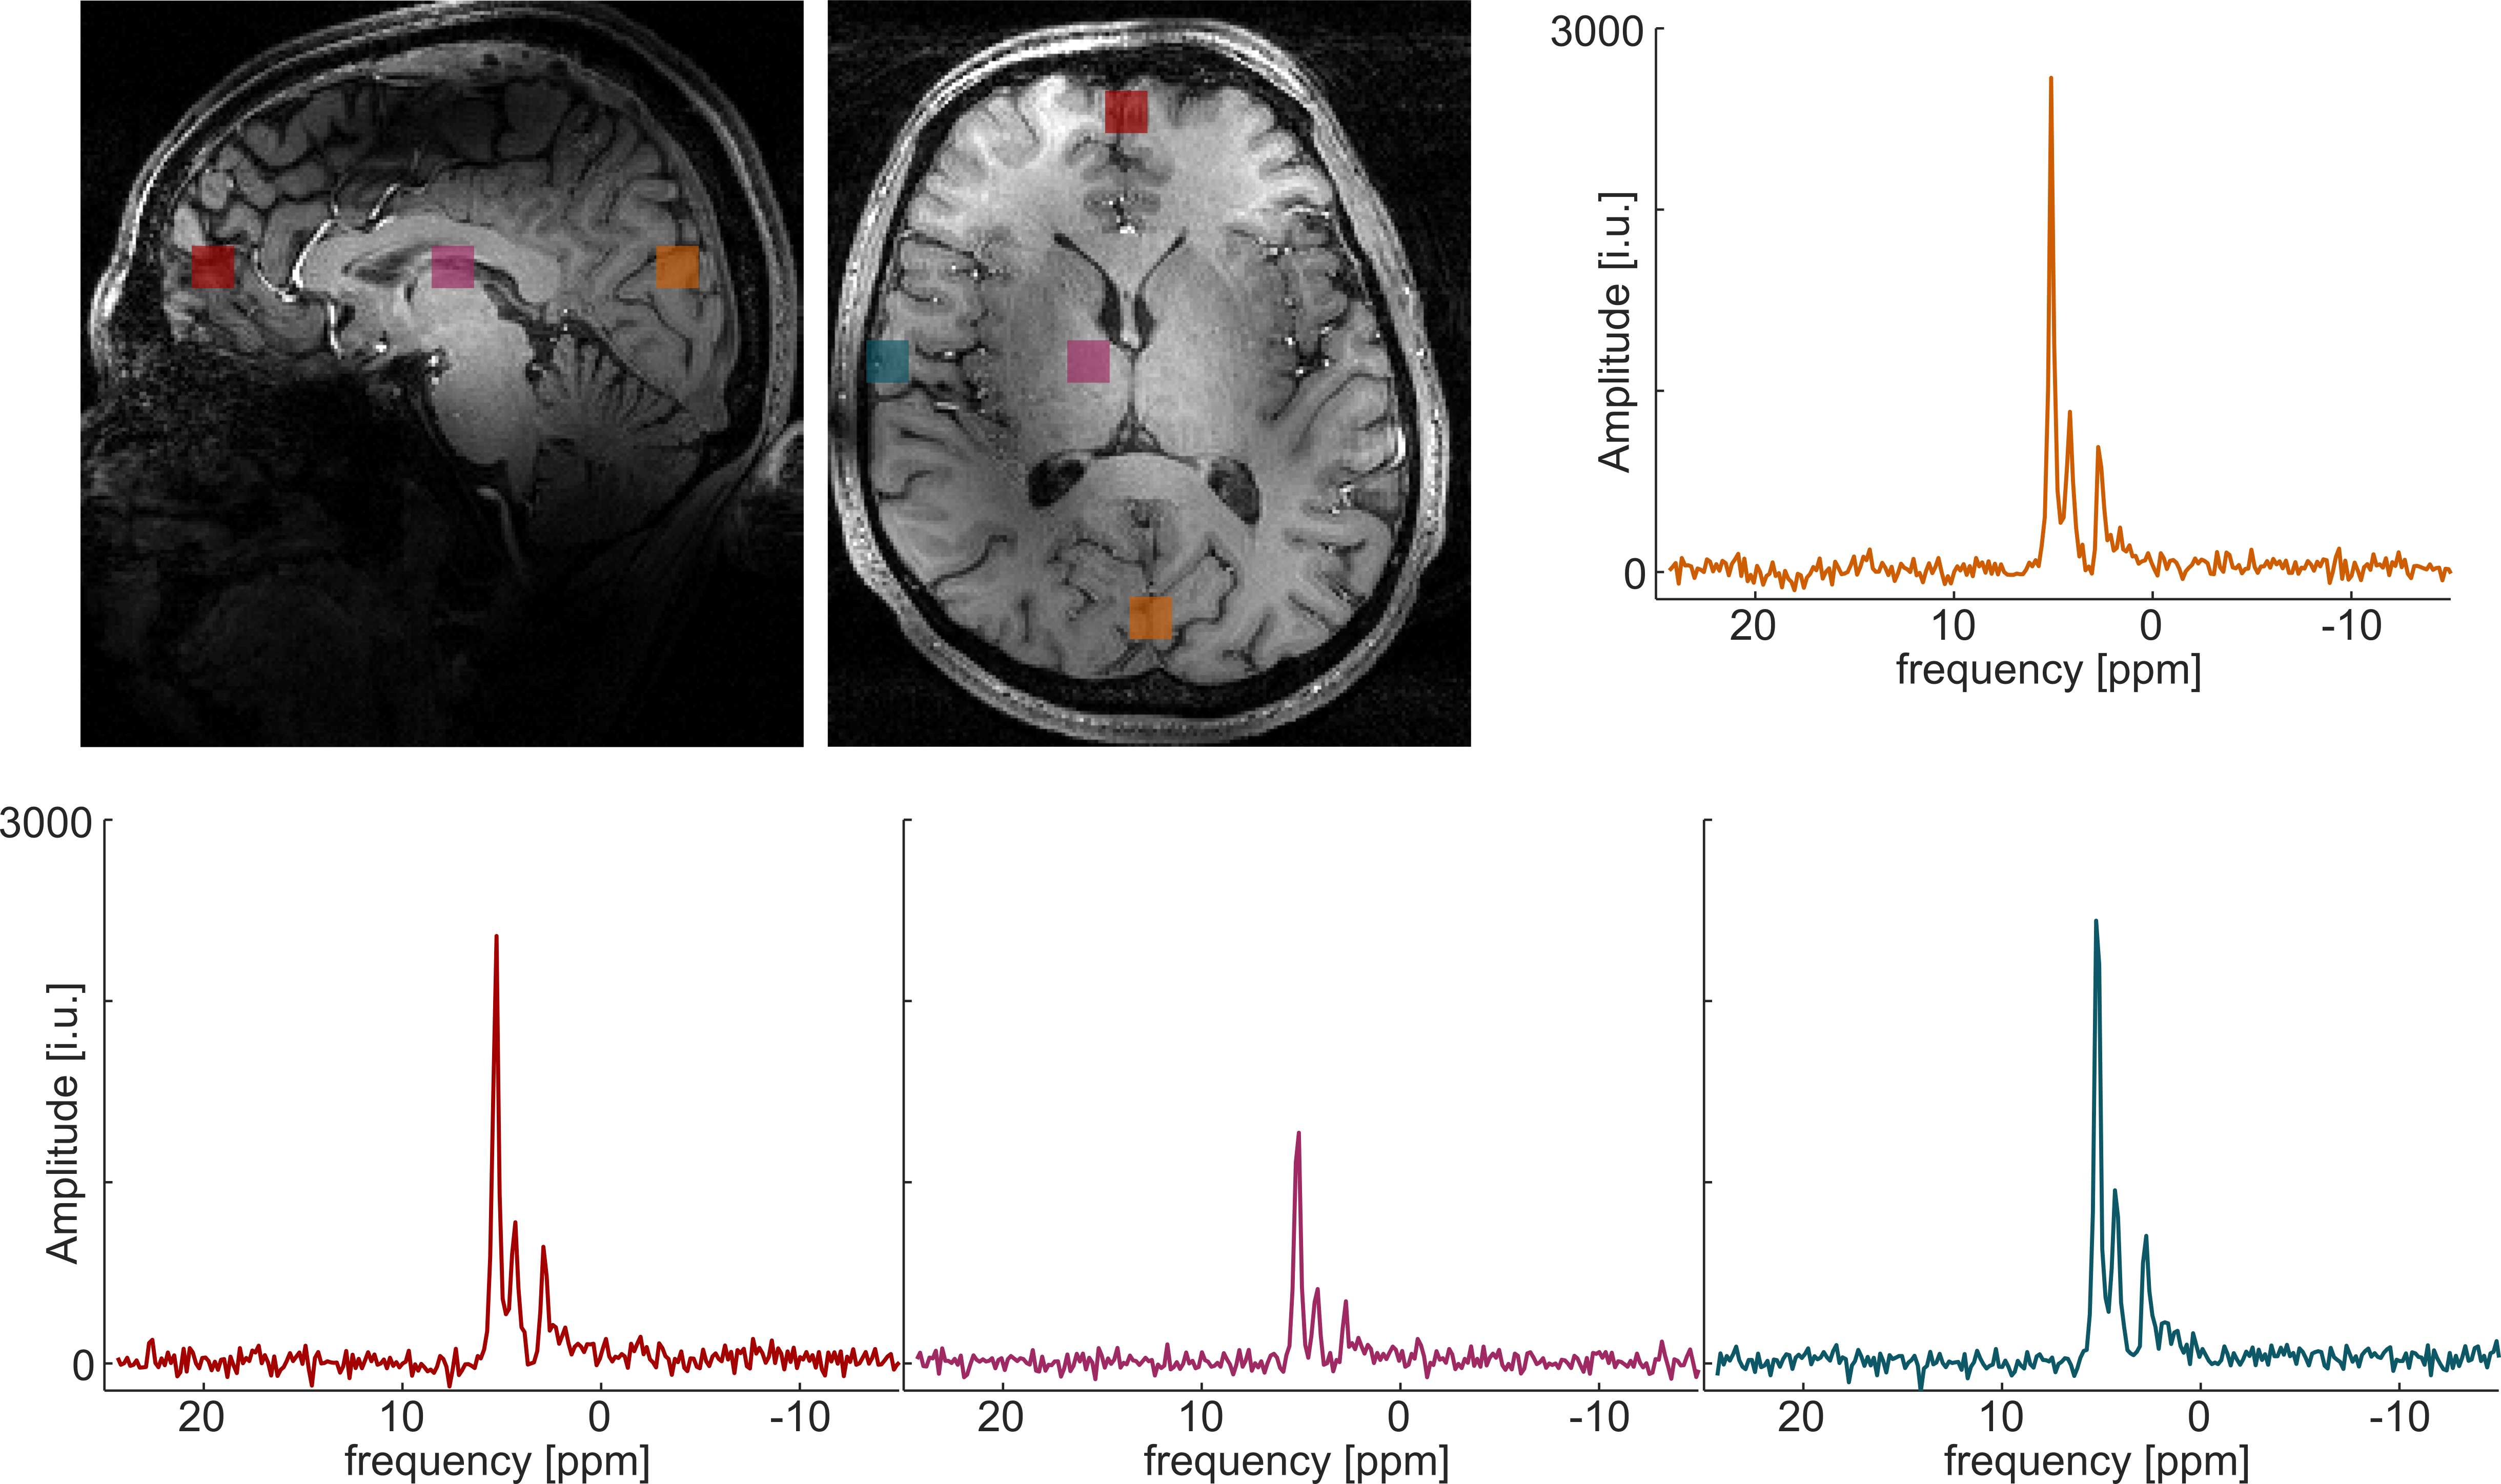
Figure 3 shows in vivo SNR maps calculated from the water measurement prior to the glucose intake. The SNR was calculated as the ratio between the fitted time domain amplitude and the time domain noise from a voxel outside of the brain. Shown are four volunteers. In figure 3A, histograms with the number of voxel per SNR are shown. The maximum SNR of around 13 appears in the periphery close to the arrays. In the center, the SNR is lower and around 5.5. This is also visible in figure 4 where the spectra of voxel from four different positions for one volunteer are shown. These spectra were acquired 90 minutes after the oral administration of the labeled glucose. Next to the water, glucose and Glx are clearly visible.
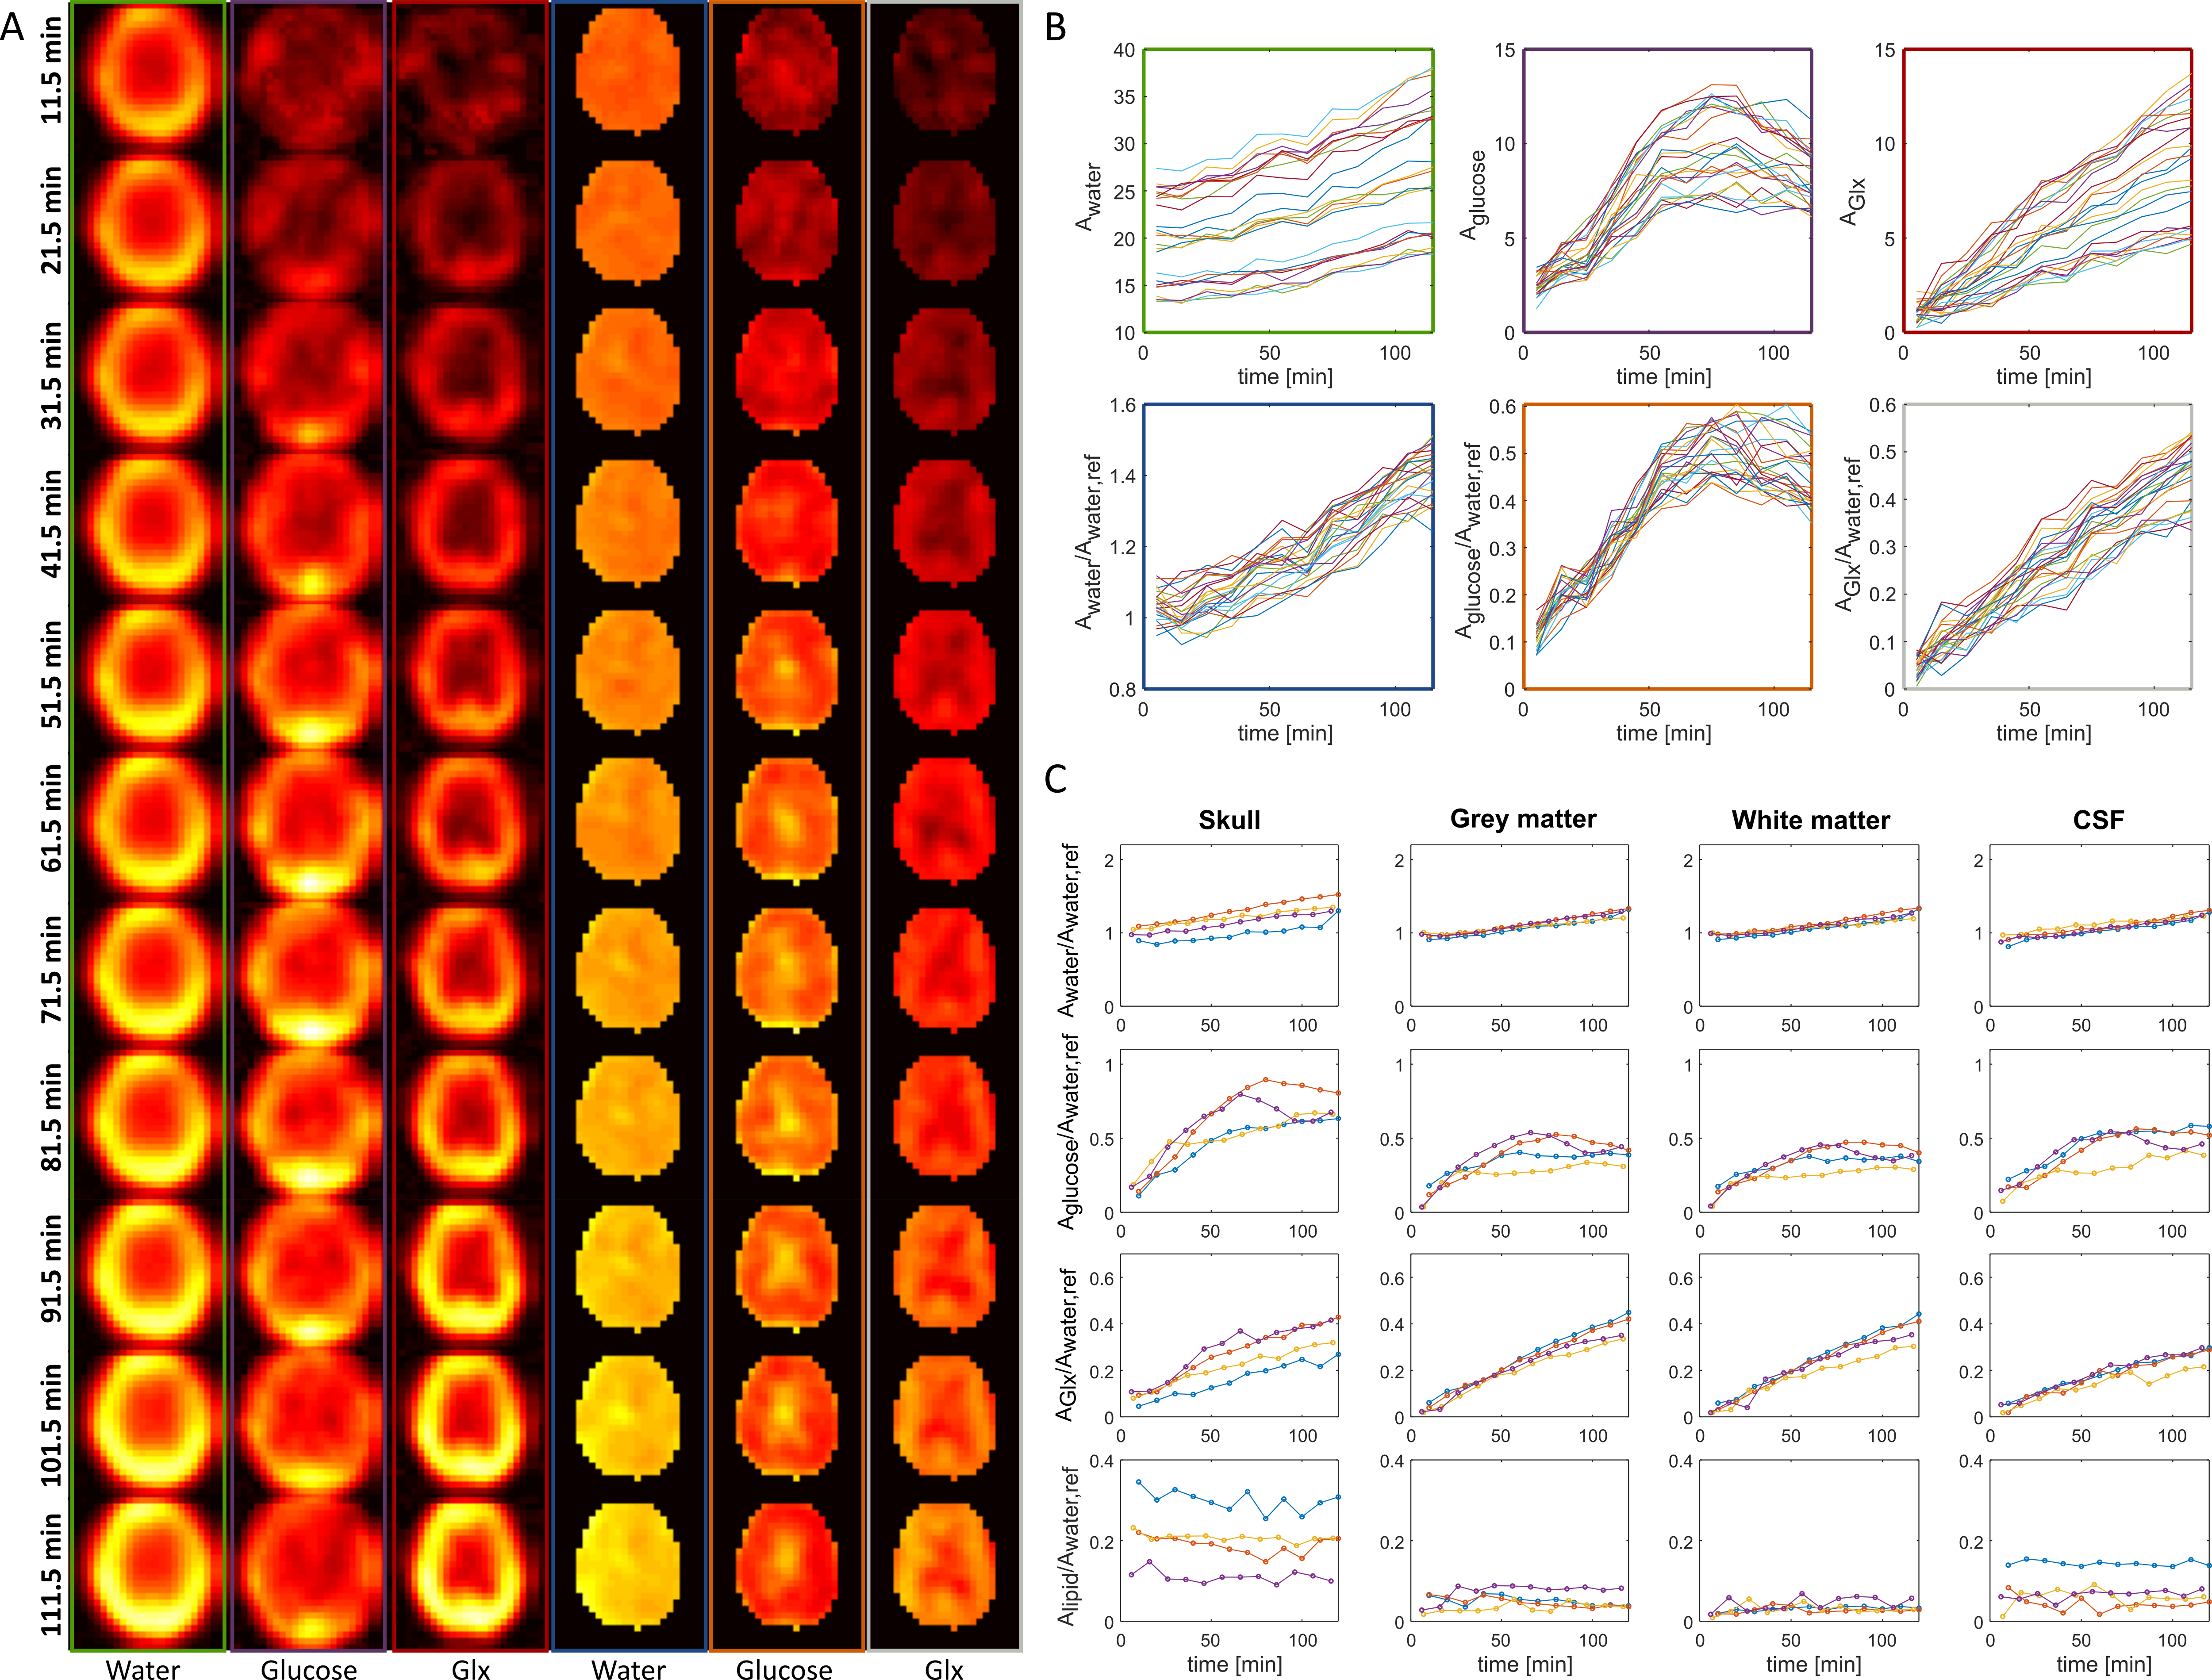
Finally, figure 5 shows time resolved metabolic images for one volunteer (Fig. 5A) for water, glucose and Glx. Data from several voxels for this volunteer with and without referencing to the baseline water signal are shown in figure 5B (frame colors in figure 5B correspond to figure 5A indicating the shown metabolite). Figure 5C shows data from four different volunteers for averaged voxels over specific brain areas. The amplitudes are presented relative to the water reference. Time courses differ between different areas of the head for glucose, Glx and lipids, which is also visible in figure 5A.
Conclusion
With this work, we present the first DMI data in humans at 9.4T with whole brain coverage acquired at a Siemens whole body MR scanner with a dedicated coil design. Correction of the coil sensitivity profile of the phased array coil was achieved by referencing to a baseline water measurement. We were able to improve the spatial resolution significantly compared to earlier publications at 4T1. The dynamic glucose uptake in healthy volunteers could be investigated in different brain areas.Acknowledgements
Funding by the ERC Starting Grant (SYNAPLAST MR, Grant Number: 679927) of the European Union and the Cancer Prevention and Research Institute of Texas (CPRIT, Grant Number: RR180056) is gratefully acknowledged.References
[1] De Feyter, HM, Behar, KL, Corbin, ZA, et al. Deuterium metabolic imaging (DMI) for MRI-based 3D mapping of metabolism in vivo. Science Advances 2018;4(8):eaat7314 doi:10.1126/sciadv.aat7314.
[2] Lu, M, Zhu, X-H, Zhang, Y, et al. Quantitative assessment of brain glucose metabolic rates using in vivo deuterium magnetic resonance spectroscopy. Journal of Cerebral Blood Flow & Metabolism 2017;37(11):3518-3530 doi:10.1177/0271678X17706444.
[3] de Graaf, RA, Hendriks, AD, Klomp, DWJ, et al. On the magnetic field dependence of deuterium metabolic imaging. NMR in Biomedicine 2020;33(3):e4235 doi:10.1002/nbm.4235.
[4] Avdievich, NI, Ruhm, L, Dorst, J, et al. Double-tuned 31P/1H human head array with high performance at both frequencies for spectroscopic imaging at 9.4T. Magnetic Resonance in Medicine 2020;84(2):1076-1089 doi:10.1002/mrm.28176.
[5] Allen, SP, Morrell, GR, Peterson, B, et al. Phase-sensitive sodium B1 mapping. Magnetic Resonance in Medicine 2011;65(4):1125-1130 doi:10.1002/mrm.22700.
[6] Mirkes, C, Shajan, G, Chadzynski, G, et al. (31)P CSI of the human brain in healthy subjects and tumor patients at 9.4 T with a three-layered multi-nuclear coil: initial results. Magnetic Resonance Materials in Physics, Biology and Medicine 2016;29(3):579-589 doi:10.1007/s10334-016-0524-9.
[7] Hagberg, G, Bause, J, Ethofer, T, et al. Whole brain MP2RAGE-based mapping of the longitudinal relaxationtime at 9.4T. NeuroImage 2017;144:203 - 216 doi:10.1016/j.neuroimage.2016.09.047.
[8] Penny, W, Friston, K, Ashburner, J, et al. Statistical Parameter Mapping: The Analysis of Functional Brain Images - 1st Edition. Academic Press 2006.
[9] Vanhamme, L, van den Boogaart, A, Van Huffel, S. Improved Method for Accurate and Efficient Quantification of MRS Data with Use of Prior Knowledge. Journal of Magnetic Resonance 1997;129:35 – 43.
Figures