1800
Dynamic Oxygen-17 MRI with Model-Based Approach for Mapping Cerebral Metabolic Rate of Oxygen in Mouse Brain at 9.4 T1Biomedical Engineering, Case Western Reserve University, Cleveland, OH, United States, 2Medicine, Case Western Reserve University, Cleveland, OH, United States, 3Radiology, Case Western Reserve University, Cleveland, OH, United States
Synopsis
An oxygen-17 (17O) MRI method combining 3D golden-means-based radial sampling with model-based parameter mapping was developed for non-invasive measurement of cerebral metabolic rate of oxygen (CMRO2) after inhalation of 17O-oxygen (17O2). The method enabled quantification of CMRO2 in post-stroke mouse brain with a nominal isotropic spatial resolution of 1.6 mm. CMRO2 was 1.5 to 2.5 μmol/g/min in the normal tissue, and was ~1 μmol/g/min in the infarct region.
Introduction
Dynamic oxygen-17 (17O) MRI allows non-invasive measurement of cerebral metabolic rate of oxygen (CMRO2) by tracking the accumulation of metabolically generated 17O-water (H217O) after inhalation of 17O-oxygen (17O2).1 In vivo experiments have shown a linear increase in 17O signal during a brief period (2 to 3 min) of 17O2-inhalation, with the slope of the line proportional to CMRO2.2,3 However, dynamic 17O-MRI suffered from limited spatial and temporal resolution due to low MR sensitivity and fast T2 decay of the 17O signal. Model-based reconstruction has been applied to estimating physiologic parameters in dynamic contrast-enhanced MRI studies for improved measurement accuracy. In this study, we aimed to evaluate the efficacy of using model-based approach for CMRO2 mapping in both simulation and in vivo studies on post-stroke mice.Methods
Data Acquisition: Dynamic 17O data was acquired by a 3D ultrashort echo-time (UTE) sequence with a flip angle of 90° and TE/TR of 0.075/10 ms. Sampling of k-space data used center-out, golden-means-based 3D radial trajectory to allow near uniform coverage of k-space with arbitrary number of radial spokes.4 Each radial spoke acquired 8 data points in 1-ms readout time covering an FOV of 24x24x24 mm3, leading to a nominal isotropic resolution of 1.6 mm.Model-Based CMRO2 mapping: Maps of CMRO2 were estimated by solving the following optimization problem,5
$$\min_{CMRO_2,C_0}\frac{1}{2}\parallel F[f(t;CMRO_2,C_0,\alpha,\beta)-k(t)]\parallel^2+\lambda\cdot TV(CMRO_2)$$
where $$$F$$$ represents the non-uniform Fourier transform operator, $$$k(t)$$$ represents the acquired k-space data. $$$R(\cdot)$$$ is the regularization function calculating the total variation in the CMRO2 map,5 $$$\lambda$$$ is the corresponding regularization factor. The signal model $$$f$$$ is related to CMRO2 and the initial H217O concentration ( $$$C_0$$$) as
$$f(t;CMRO_2(r),C_0(r),\alpha,\beta(r))=\beta(r)\cdot (C_0(r)+2\alpha\cdot CMRO_2(r)\cdot t)$$
$$$\alpha$$$ is the 17O2-enrichment level and $$$\beta$$$ is the coil sensitivity map estimated from data acquired at baseline.
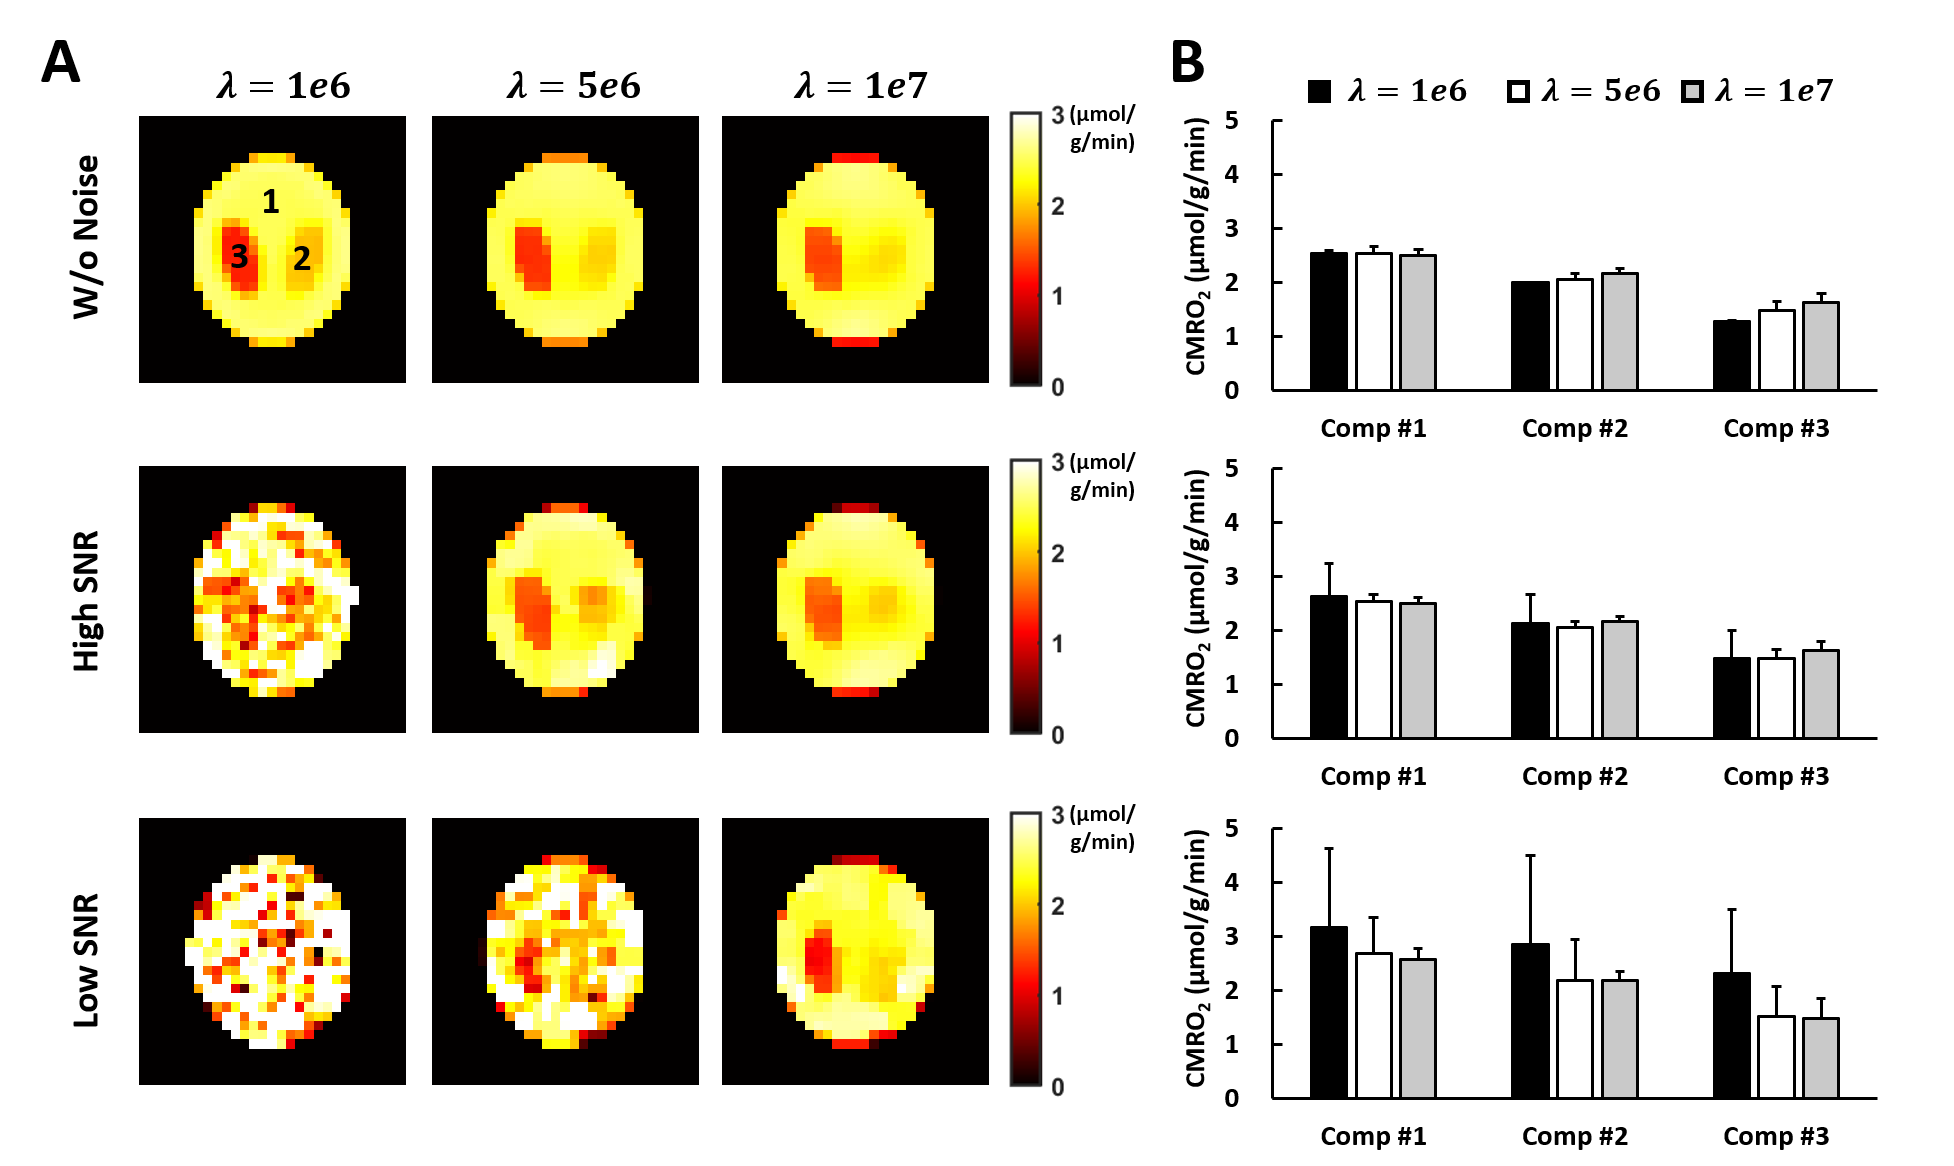
Simulation Study: A 3-compartment digital phantom was used in the simulation. The 17O signal of an 11-min data acquisition protocol was simulated with 8 min of baseline acquisition and 3 min of data acquisition during 17O2-inhalation. CMRO2 in each compartment was assumed to be 1.3, 2.0, and 2.5 μmol/g/min, respectively. Literature value of baseline H217O concentration (20.35 μmol/g) was used.6 White noise at two different SNR levels ($$$SNR_{high}=2\cdot SNR_{low}$$$) were added to the simulated k-space data. Data were simulated at a higher spatial resolution (0.8 mm) with 16 data points acquired on each radial spoke. CMRO2 maps were generated using model-based reconstruction. The choice of regularization parameter was evaluated.
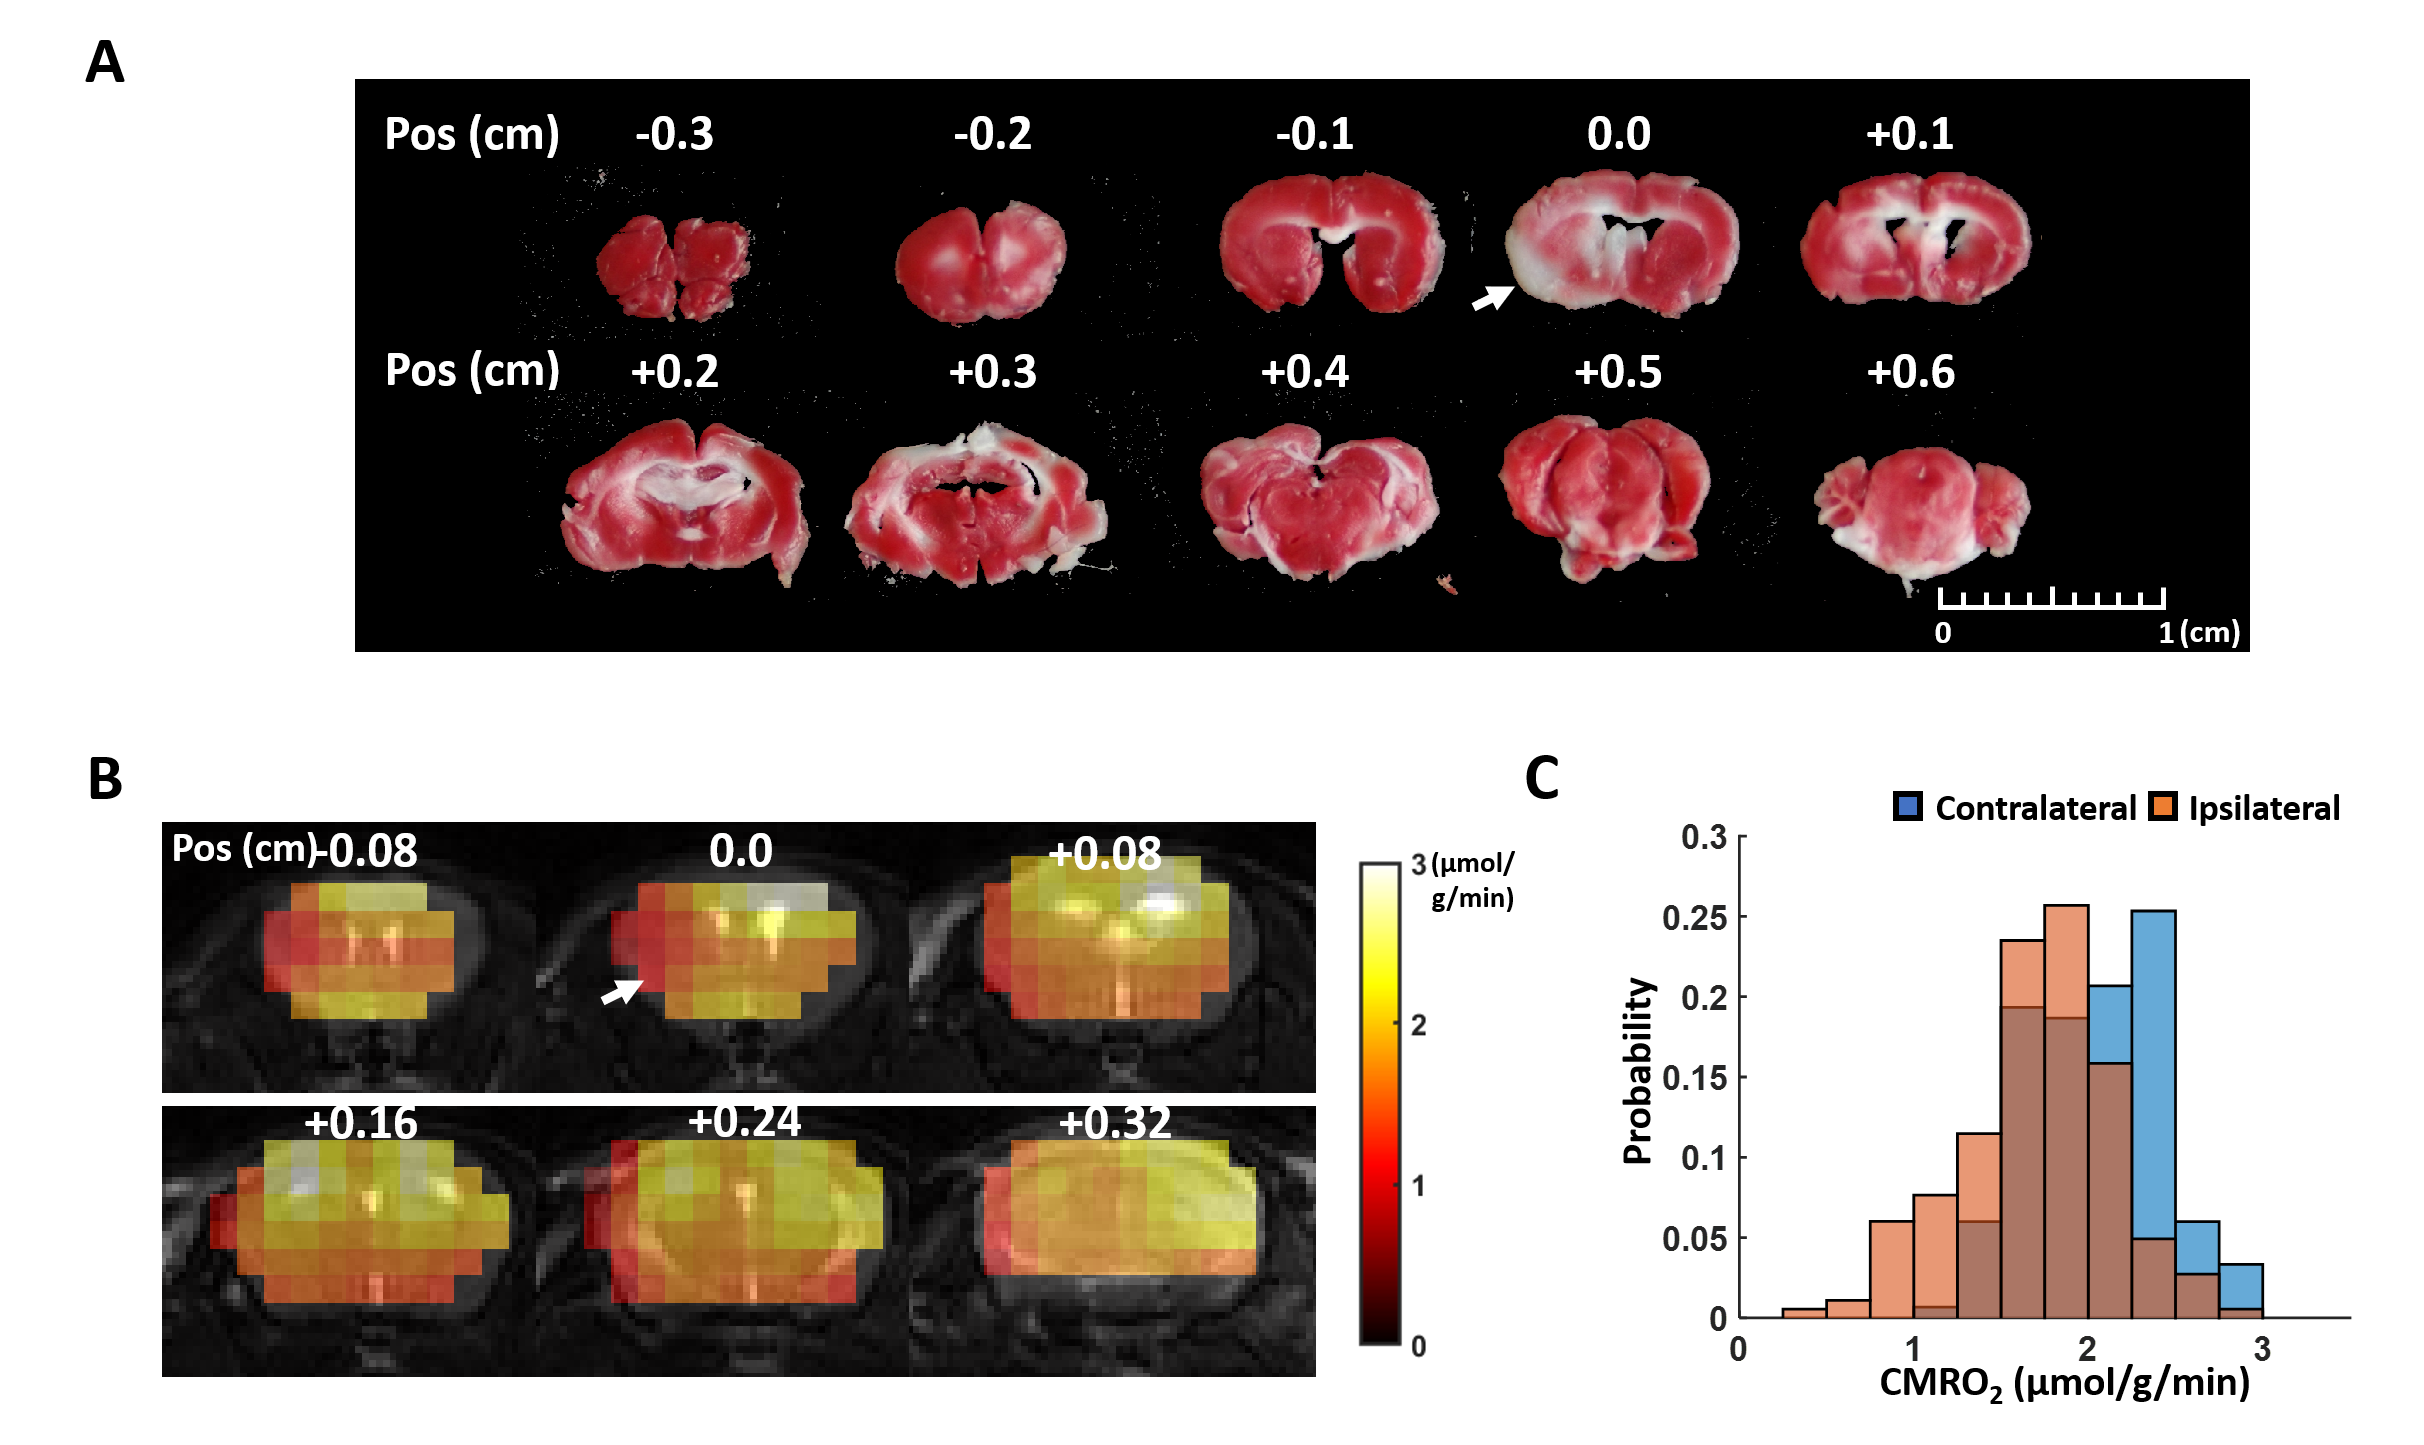
In Vivo Study: Adult male C57BL/6 mice (N=1) underwent MRI studies at 2 hours after 60 min of middle cerebral artery occlusion (MCAO) surgery. All MRI studies were performed on a 9.4 T Bruker scanner. 17O-MRI used a 2-cm surface coil. 250-ml of gas composed of 30% 17O-enriched oxygen (70% enrichment) and 70% N2 mixed with 1% isoflurane was delivered to the animal through a nose cone for 2.5 to 3 min. Dynamic 17O data were continuously acquired at baseline (8 min) and during inhalation. CMRO2 was estimated using model-based reconstruction. The mice were euthanized after MRI studies. The brains were harvested and sectioned into 1-mm slice for 2,3,5-Triphenyltetrazolium chloride (TTC) staining.
Results
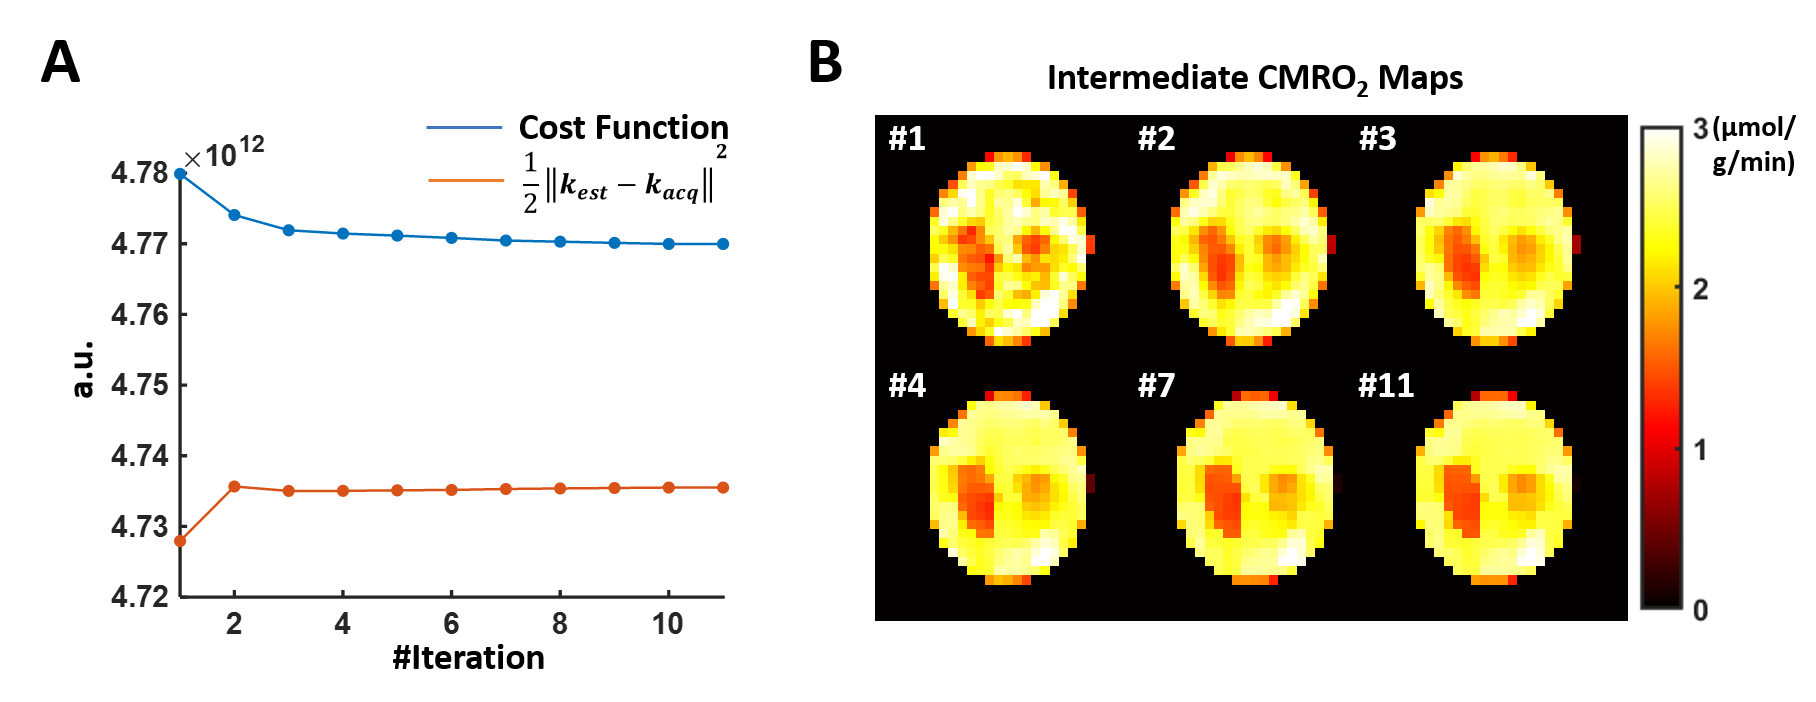
Simulation Results: Figure 1 shows the cost function and CMRO2 maps at selected iteration steps. With a regularization factor of 5e6, the regularization term only contributed to ~1% of the cost function yet overfitting to the noise can be effectively prevented. Figure 2 compares the CMRO2 maps estimated at different noise levels using different regularization factors. In general, lower SNR required stronger regularization. Our results suggested that regularization consisting of 0.1 to 5% of the cost function can maintain fidelity to data while avoid overfitting.In Vivo results: Figure 3 shows the CMRO2 maps of a post-stroke mouse brain. A regularization factor of 2e5 was used consisting of 0.6% of the cost function. The average CMRO2 was ~2.1 μmol/g/min in the contralateral hemisphere, while reduced to ~1.7 μmol/g/min on the ipsilateral side. The infarct shown in the TTC staining reside in the same area with CMRO2 at ~1 μmol/g/min.
Discussion and Conclusion
The model-based reconstruction allowed CMRO2 mapping in the mouse brain with 1.6-mm nominal resolution at 9.4 T. Low CMRO2 was found in the TTC-stained infarct core. Other regularization method can be tested in the future.Acknowledgements
This work was supported by a grant from the National Institute of Health (R01 EB23704).References
1. Zhu X-H, Zhang Y, Tian R-X, Lei H, Zhang N, Zhang X, Merkle H, Ugurbil K, Chen W. Development of 17O NMR approach for fast imaging of cerebral metabolic rate of oxygen in rat brain at high field. Proc Natl Acad Sci U S A. 2002;99:13194–9.
2. Zhang N, Zhu XH, Lei H, Ugurbil K, Chen W. Simplified methods for calculating cerebral metabolic rate of oxygen based on17O magnetic resonance spectroscopic imaging measurement during a short17O2inhalation. J Cereb Blood Flow Metab. 2004;24:840–848.
3. Cui W, Zhu X-H, Vollmers ML, Colonna ET, Adriany G, Tramm B, Dubinsky JM, Oz G. Non-invasive measurement of cerebral oxygen metabolism in the mouse brain by ultra-high field (17)O MR spectroscopy. J Cereb Blood Flow Metab. 2013;33:1846–9.
4. Chan RW, Ramsay EA, Cunningham CH, Plewes DB. Temporal stability of adaptive 3D radial MRI using multidimensional golden means. Magn Reson Med. 2009;61:354–363.
5. Boyd S, Parikh N, Chu E, Peleato B, Eckstein J. Distributed optimization and statistical learning via the alternating direction method of multipliers. Found Trends Mach Learn. 2010;3:1–122.
6. Cui W, Zhu X-H, Vollmers ML, Colonna ET, Adriany G, Tramm B, Dubinsky JM, Öz G. Non-Invasive Measurement of Cerebral Oxygen Metabolism in the Mouse Brain by Ultra-High Field 17 O MR Spectroscopy. J Cereb Blood Flow Metab. 2013;33:1846–1849.
Figures