1799
Three-compartment modeling for dynamic theragnostic agent enhanced MRI for Quantitative Analysis of NASH progression1Bio and Brain Engineering, Korea Advanced Institute of Science and Technology, Daejeon, Korea, Republic of, 2Biological science, Korea Advanced Institute of Science and Technology, Daejeon, Korea, Republic of
Synopsis
Non-Alcoholic steatohepatitis (NASH) is a liver condition that has been linked heavily as a precursor to irreversible cirrhosis condition. The symptoms are often silent or non-specific to NASH, causing diagnosis to be difficult. Emerging works in theragnostics have open a chance to diagnose NASH using MRI systems. In this study, we present a three-compartment model that is sensitive to NASH progression. A kinetic parameter derived from the model linearly increased as NASH disease progressed. This study revealed possibility of using contrast agent and compartment modeling to quantitatively analyze the NASH progression.
Introduction
Non-Alcoholic steatohepatitis (NASH) is one form of fatty liver disease that has become increasingly common due to trends in high sugar diet and sedentary exercise leading to visceral fat build up[1]. NASH lies as the last reversible condition in liver chronic disease before entering cirrhosis stage. Thus, early diagnosis of NASH is key in salvaging the afflicted liver. Gold standard for NASH diagnosis remains to be liver biopsy while existing methods in ultrasound and MRI elastography are still in development[2]. In this study we introduce a dynamic MRI scan coupled with theragnostic agent and a new three-compartment model as a method to quantitatively analyze NASH progression.Theragnostic agent
A class of manganese-chelated bilirubin nanoparticle (Mn-BRNP) was used as contrast agent and NASH therapeutic agent in this study. The chelated manganese provides T1 contrast while the bilirubin vessel can be loaded with NASH-treating agent such as OCALIVA®. The bilirubin vessel ruptures only when coming in contact with reactive oxygen species (ROS) which is abundant in scar tissues caused by NASH condition. The ruptured bilirubin also releases manganese leading to even more enhancement within the proximity of scar tissues.MRI scan
All the MR experiments were performed at a 3T animal MRI scanner (3T/17 MR Solutions, UK). T1-weighted SE imaging was performed for 4 groups, each of which was composed of 5 mice. Each group represents NASH condition induced for 2, 4, 6, and 8 weeks. The scan parameters were TE/TR = 11/550ms, matrix size = 256x256, and field of view = 40x40mm. The scan was performed dynamically for 2 hours with 12.5-minute interval. The theragnostic agent was introduced through ocular veins after the first scan.Signal enhancement were calculated using the following equation: $$\triangle s = \frac{s - s_0}{s_0}$$ while the concentration function of theragnostic agent is related to signal enhancement in the following way[3]: $$c(t) = \frac{1}{r_1 T_{10}} \triangle s$$ Observed concentration function is accumulation of the theragnostic agent from each compartment. Relaxivity r1 was adjusted depending on the compartment.
Three compartment model
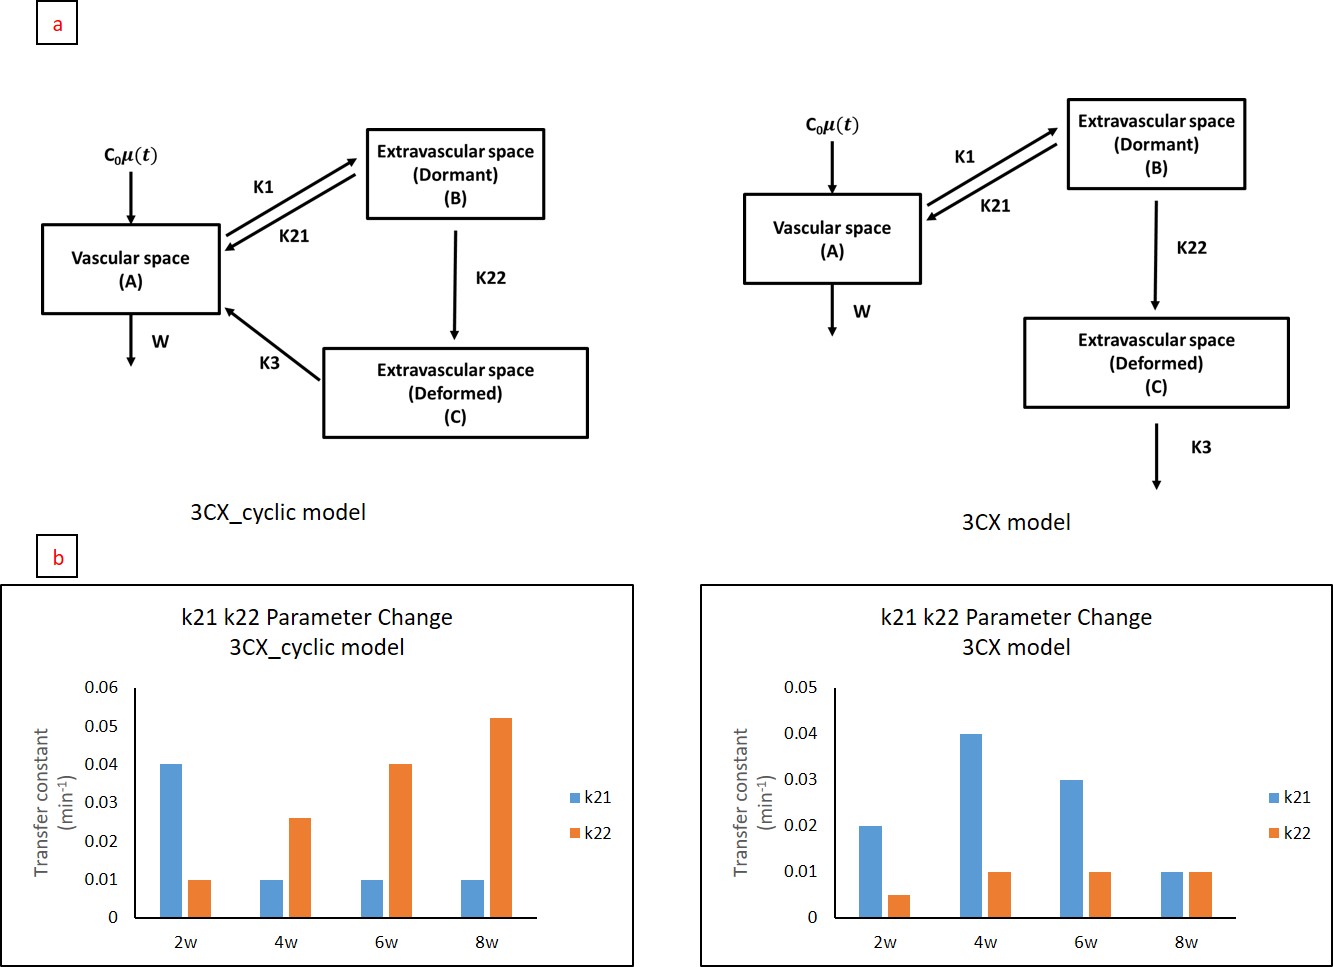
We modified the existing two compartment model from DCE MRI by adding extra compartment to accommodate the circulation characteristic of the theragnostic agent. Firstly, the agent would circulate as a manganese-chelated bilirubin vessel containing NASH-relieving drug. The circulation of this type is modeled by exchange between vascular – dormant extravascular compartments. Upon arriving in high ROS area, bilirubin structure broke down releasing Mn ions and the NASH-relieving drug into the area. This conversion is modeled by single direction transfer between dormant – deformed extravascular compartments. The freed Mn ions $$$r1_{deformed}$$$ is doubled compared to $$$r1_{dormant}$$$ from the chelated Mn in bilirubin vessel structure. Thus, we can specify the concentration function from dormant / deformed compartments to be: $$c_{dormant / deformed}(t) = \frac{1}{r_{1,dormant / 1,deformed} T_{10}} \triangle s$$ The re-circulation of free Mn ions after arriving in NASH-affected area is not clear since liver is the site of bilirubin being metabolized. Once metabolized, Mn ions may or may not re-circulate as free ions.Thus, we propose two different models based on the assumption whether deformed agent could recirculate into blood stream or not. The two cases of recirculation and non-recirculation were labeled as 3CX_cyclic and 3CX, respectively (Figure 1a). Irrespective of the model, 5 parameters were acquired (k21, k22, k1, k3, and w) by taking arterial input and fitting it to the observed tissue concentration. Fitting was done by searching minimum mean squared error within the following ranges: k1 = 0.001 – 0.1min-1, k21 = 0.001 – 0.1min-1, k22 = 0.001 – 0.1min-1, k3 = 0.01 – 1min-1, and w = 0.01 – 1min-1.
Result
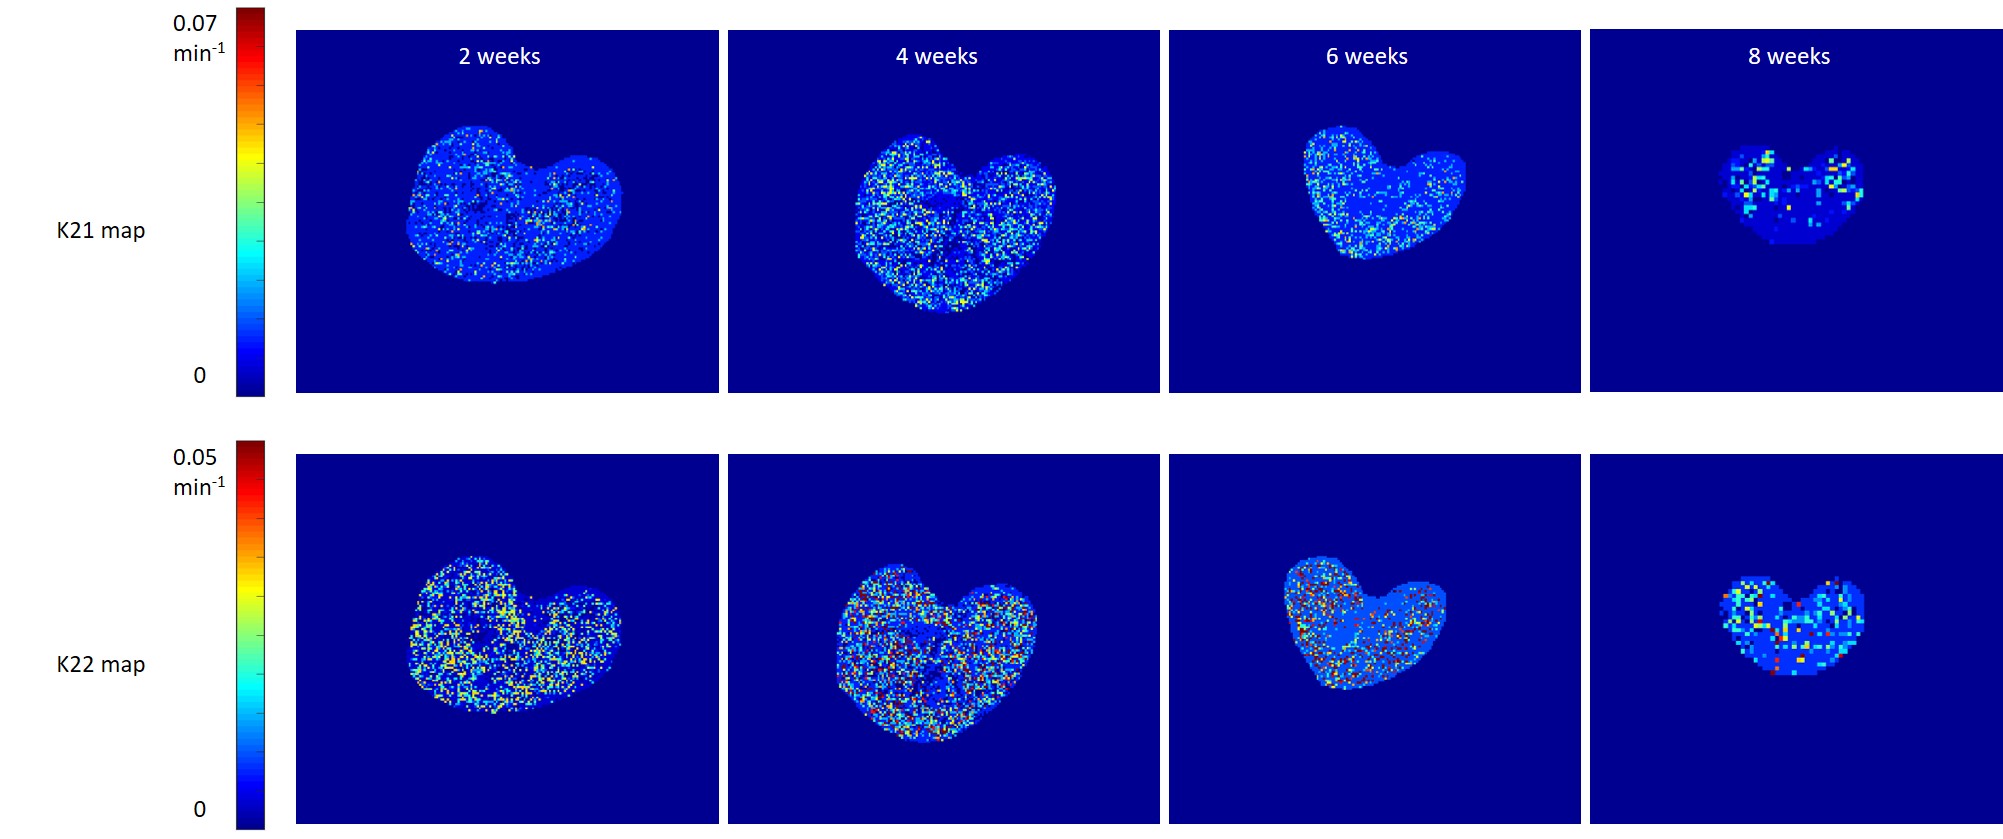
Parameters k21 and k22, which were directly involved in nonspecific / NASH-specific enhancement, are summarized in Figure 1b. The bar plot shows linear progression of k22 as the NASH condition progress in case of the 3CX_cyclic model. However, this trend was not observable for the 3CX model despite fitting with the same data. Further inspection of fitting results using 3CX_cyclic model from each mouse group (Figure 2) shows solid correlation between the model-predicted and the observed tissue signals. Mean cross-group correlation was 0.864 ± 0.06 for 20 mice. We further explored 3CX_cyclic model by pixel-wise mapping of k21 and k22 parameters (Figure 3). We observed some high k21 pixels decreasing as the NASH progressed. Conversely, there was an increasing pattern of high k22 pixels in the same period. These observations persisted up to week 6, but not the case in week 8.discussion
We have shown a compelling model to quantitatively analyze NASH progression through the use of theragnostic drugs and proper kinetic modeling. The comparison of the two models suggest that free manganese ions recirculate into the blood stream after arriving in the NASH areas in liver. However, this is inconclusive since there are other factors such as uptake rate of bilirubin by the liver and/or efficiency of bilirubin metabolism that can lead to recirculation. Nevertheless, the parameter k22 from the 3CX_cyclic model has successfully detected the NASH progression, and this model can be used to prevent further chronic liver disease such as cirrhosis. Performance of the k22 parameter in steatosis or cirrhosis stage is an interesting topic, which warrants further investigation.Acknowledgements
References
[1]. Hyysalo, J., Männistö, V.T., Zhou, Y., Arola, J., Kärjä, V., Leivonen, M., Juuti, A., Jaser, N., Lallukka, S., Käkelä, P. and Venesmaa, S., 2014. A population-based study on the prevalence of NASH using scores validated against liver histology. Journal of hepatology, 60(4), pp.839-846.
[2]. Qiu, Y., Wang, S., Wan, T., Ye, M., Jiang, R., Pei, L. and Yang, L., 2018. Blood-based novel biomarkers for nonalcoholic steatohepatitis. Biomarkers in medicine, 12(5), pp.501-515.
[3]. Wake, N., Chandarana, H., Rusinek, H., Fujimoto, K., Moy, L., Sodickson, D.K. and Kim, S.G., 2018. Accuracy and precision of quantitative DCE-MRI parameters: How should one estimate contrast concentration?. Magnetic resonance imaging, 52, pp.16-23.
Figures