1798
Treatment-induced changes in 2H-labeled lactate measured by 2H magnetic resonance spectroscopy are associated with apoptotic cell death1Medical Biophysics, University of Toronto, Toronto, ON, Canada, 2Physical Sciences, Sunnybrook Research Institute, Toronto, ON, Canada
Synopsis
Elevated lactate production, a key characteristic of the aberrant tumour metabolism, can be detected non-invasively by deuterium (2H) magnetic resonance spectroscopy (MRS). To determine if 2H-labeled lactate measured by 2H MRS can serve as an early marker of tumour response, we investigate the association of treatment-induced signal changes in 2H-lactate in vitro with apoptotic cell death. We show that significantly lower 2H-lactate in 48-hour cisplatin treated cells (1.6 ± 0.4 mM) compared to those untreated (3.2 ± 0.4 mM) and 24-hour treated cells (4.0 ± 0.6 mM) is associated with with an increase in apoptotic area fraction.
Introduction
Increased lactate production is a key characteristic of the aberrant metabolism exhibited by glycolytic tumour cells1,2. This metabolite can be non-invasively measured by deuterium (2H) magnetic resonance spectroscopy (MRS), which was recently shown to differentiate between normal and tumour metabolism in patients with glioblastoma3 and detect early metabolic changes following chemotherapy in rats4. These findings suggest that changes in 2H-labeled lactate signal may serve as an early marker of tumour response, but further work is required to establish the relevant biological processes associated with this marker. In this abstract, we investigate the association between apoptotic cell death, extracellular lactate concentrations, and 2H-labeled lactate signal, in an in vitro model at different time points following chemotherapy.Methods
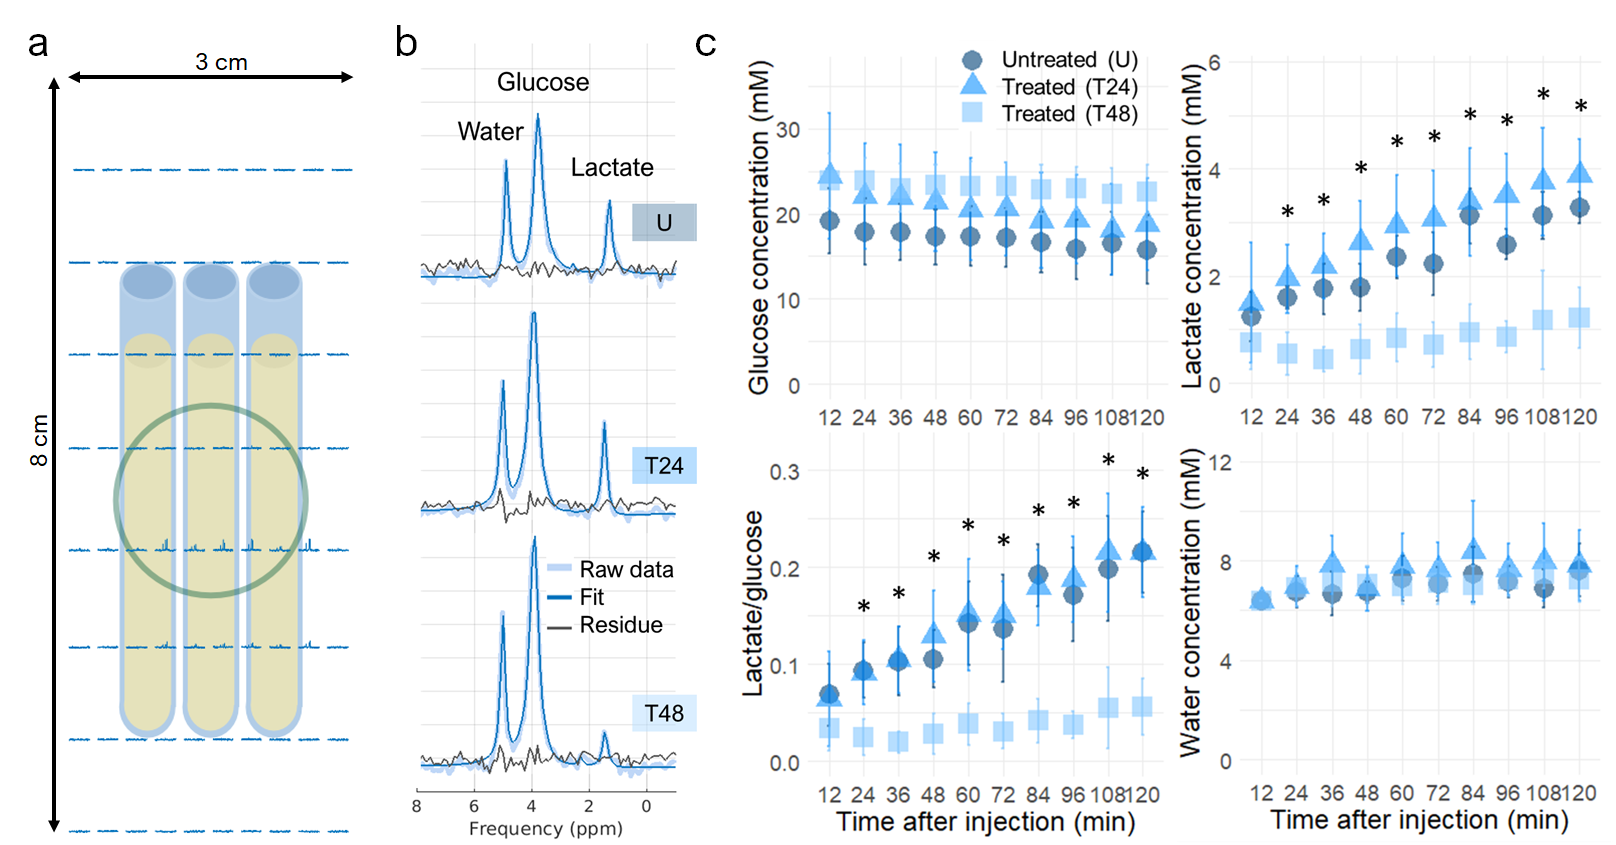
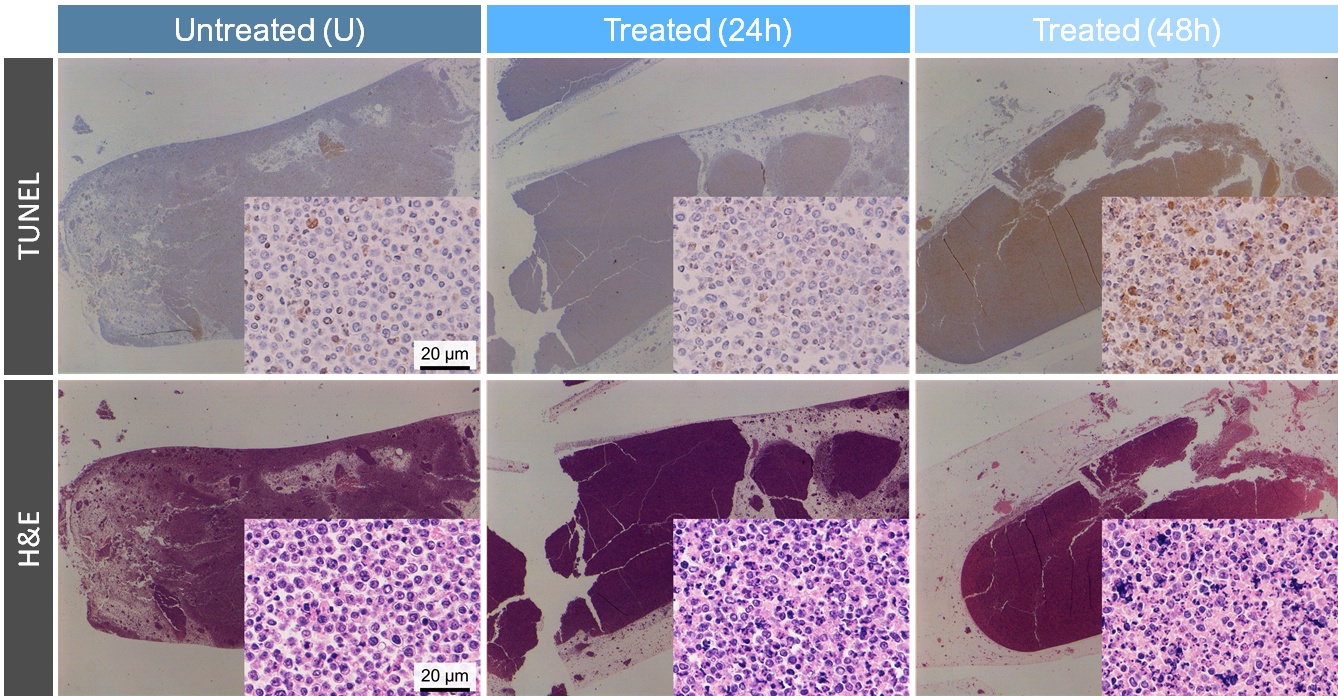
MR experiments: Acute myeloid leukemia cells (AML-5) in suspension were treated with a chemotherapeutic drug (10 µg/mL of cisplatin) 24 and 48 hours prior to scanning. Untreated and cisplatin-treated cells were imaged at 7 T (Bruker) using a 2D deuterium MRSI sequence (spatial resolution=10x3 mm2, temporal resolution=24 s, FOV=8x3 cm2, spectral width 3 kHz, 768 spectral points, flip angle=90°, TR=300ms, total scan time=120 mins) following a bolus injection of [6,6’-2H2]glucose solution (20 mM initial concentration).Lactate assay and histology: To validate the lactate concentrations quantified by 2H MRS, a colorimetric lactate assay was used to measure extracellular lactate in the sample supernatant (Biovision Inc., Milpitas, CA, USA). To assess apoptotic area and morphology of the AML cells, the cell pellets were stained with terminal deoxynucleotidyl transferase-mediated 2’-deoxyuridine 5’-triphosphate nick-end labeling (TUNEL) and hematoxylin and eosin (H&E) (University Health Network Pathology Research Program, Toronto, Canada).
Image and statistical analysis: Spectra were averaged from every 12 min of data acquisition. Spectral fitting was performed using AMARES implemented in the OXSA Matlab toolbox5. Absolute concentrations of labeled species were quantified by normalizing the integrals of the fitted peaks to that of the baseline 2H-water signal and normalizing to the average number of deuterons per molecule3. ImageJ2 (National Institutes of Health [NIH]) was used to measure the percent area of TUNEL positive (TUNEL+) staining in three fields of view of each cell pellet slide examined at 200x magnification. Tukey’s post hoc test was used to compare 2H-labeled lactate concentrations between the untreated and cisplatin-treated samples following administration of 2H-labeled glucose, and corresponding TUNEL+ percent area and supernatant lactate concentrations.
Results and Discussion
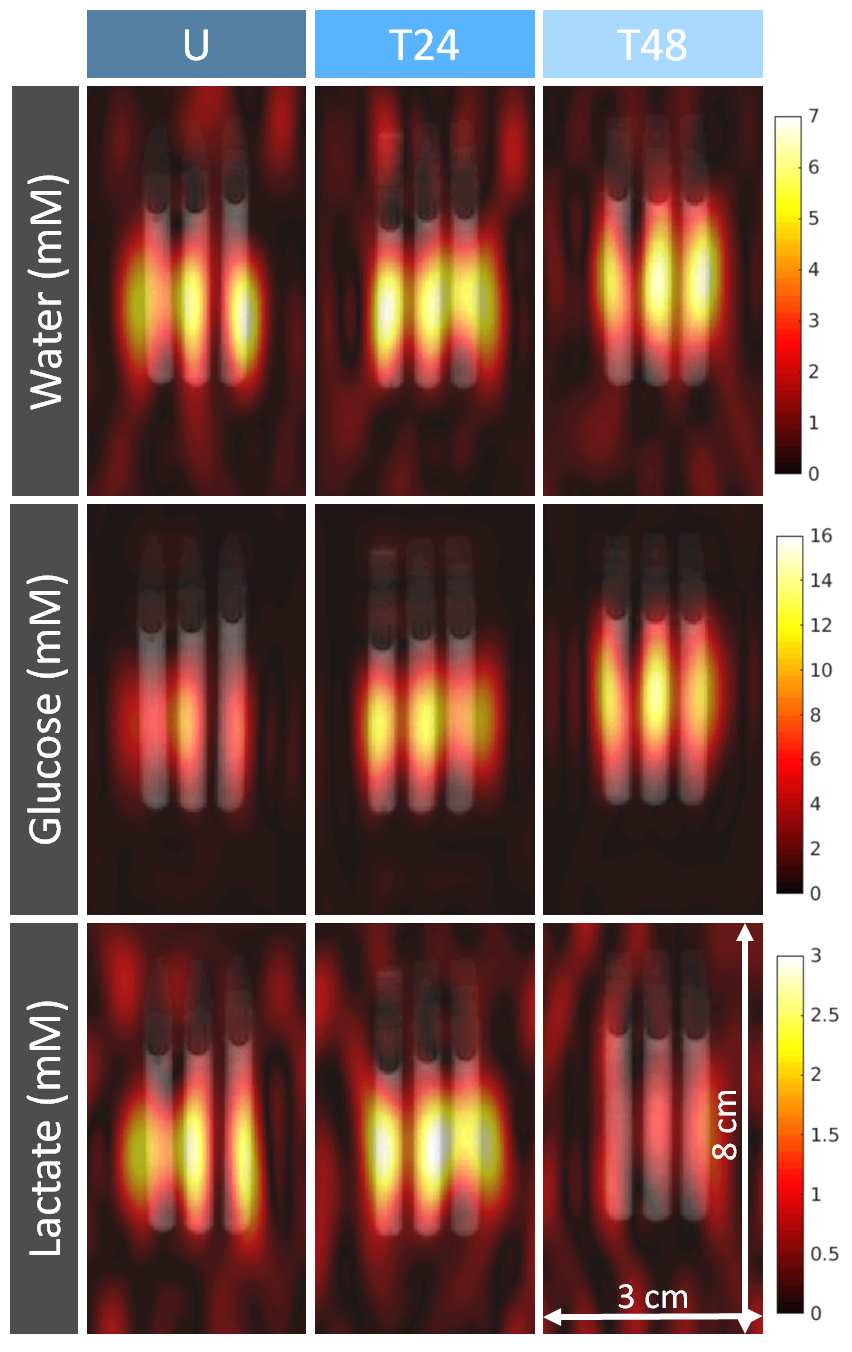
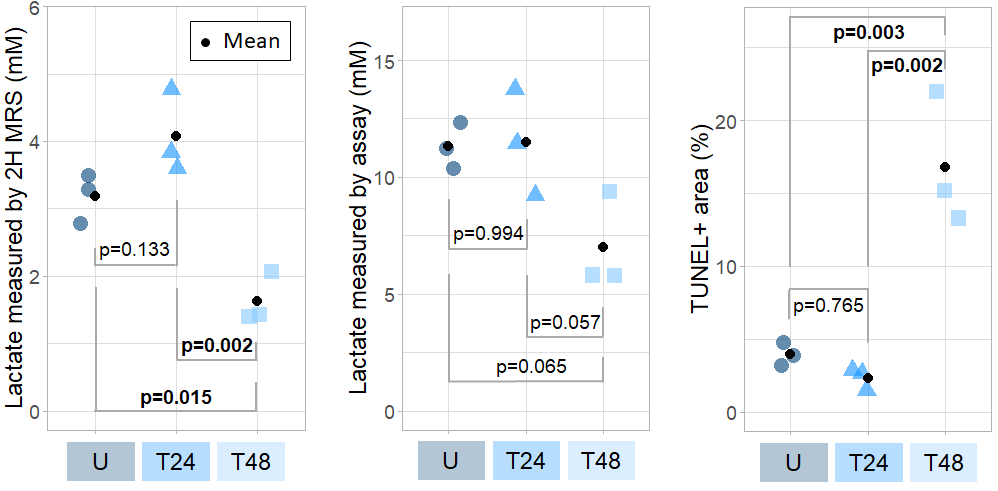
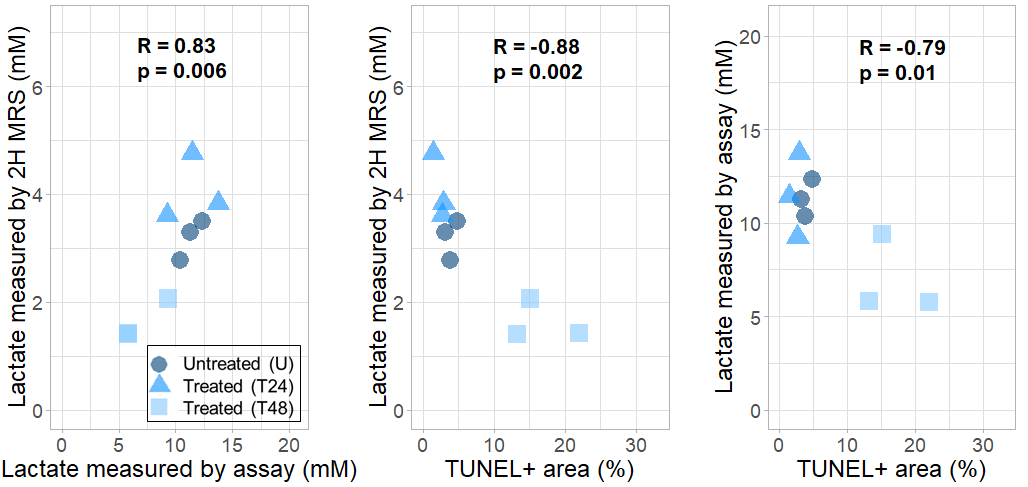
Consistent with other glycolytic tumour types, the AML cells demonstrated metabolic conversion of glucose into lactate. Significantly lower lactate concentration and lactate/glucose ratio were detected at all time points after 12 minutes of [6,6’-2H2]glucose injection in the 48h-treated cells compared to the untreated and 24h-treated cells (Figure 1). At 120 minutes following [6,6’-2H2]glucose injection, there was significantly less 2H-lactate detected in the 48h-treated cells (1.6 ± 0.4 mM) compared to the untreated (3.2 ± 0.4 mM) and 24h-treated cells (4.0 ± 0.6 mM) (Figure 2). These observations were validated by lactate assays of the sample supernatant, which found lower lactate in the 48h-treated samples (7.0 ± 2.1 mM) compared to the untreated (11.3 ± 1.0 mM) and 24h-treated samples (11.5 ± 2.3 mM) (Figure 4). The higher lactate concentrations reported by the assay compared to the 2H MRS measurements may be explained by the presence of unlabeled lactate in the supernatant - for example, produced from residual cell medium that contains unlabeled glucose - which is undetected by 2H MRS. This effect should be considered when interpreting the 2H lactate signal in 2H MRS studies. Histology of the cell pellets (Figure 3) showed a significantly greater percent area of TUNEL+ staining in the 48h-treated samples (16.8 ± 4.6 %) compared to the untreated (3.9 ± 0.8 %) and 24h-treated cells (2.3 ± 0.8 %) (Figure 4), suggesting that more cells have undergone apoptosis at least 48 hours after cisplatin treatment. Both the MRS and lactate assay measurements were significantly negatively correlated with the TUNEL+ percent area (Figure 5), indicating that reduced production of lactate is associated with apoptotic cell death.Conclusions
This work demonstrated that lactate measurements from 2H MRS were sensitive to lower lactate levels associated with apoptotic cell death at least 48 hours after cisplatin treatment. These results represent the in vitro validation of using 2H-MRS to assess tumour response at an earlier stage in therapy.Acknowledgements
We gratefully acknowledge funding from NSERC (RGPIN-2017-06596).References
1. Warburg BYO, Wind F. The metabolism of tumors in the body. J. Gen. Physiol. 1926;8:519–530.
2. de la Cruz-López KG, Castro-Muñoz LJ, Reyes-Hernández DO, García-Carrancá A, Manzo-Merino J. Lactate in the Regulation of Tumor Microenvironment and Therapeutic Approaches. Front. Oncol. 2019;9 doi: 10.3389/fonc.2019.01143.
3. de Graaf RA, Fulbright RK, McIntyre S, et al. Deuterium metabolic imaging (DMI) for MRI-based 3D mapping of metabolism in vivo. Sci. Adv. 2018;4:eaat7314 doi: 10.1126/sciadv.aat7314.
4. Kreis F, Wright A, Hesse F, Fala M, Hu D, Brindle K. Measuring Tumor Glycolytic Flux in Vivo by Using Fast Deuterium MRI. Radiology 2019;00 doi: https://doi.org/10.1148/radiol.2019191242.
5. Purvis LAB, Clarke WT, Biasiolli L, Valkovič L, Robson MD, Rodgers CT. OXSA: An open-source magnetic resonance spectroscopy analysis toolbox in MATLAB. PLoS One 2017;12 doi: 10.1371/journal.pone.0185356.
Figures