1795
Sodium TQ signal of amino acids and α-lactalbumin in comparison to bovine serum albumin1Computer Assisted Clinical Medicine, Heidelberg University, Mannheim, Germany, 2National High Magnetic Field Laboratory, Florida State University, Tallahassee, FL, United States
Synopsis
This study demonstrates that amino acids and the protein α-LA do not yield a sodium TQ signal. Despite a significant reduction in sodium relaxation times, a sodium TQ signal was not observed for the amino acids glutamic acid, arginine, and lysine, as well as for the small sized protein α-LA up to their highest concentration dissolvable in water. In contrast, a BSA concentration of 3% w/v was already sufficient for the creation of a sodium TQ signal. Consequently, in vivo small molecules can only contribute to a reduction in the MR relaxation times without a detectable sodium TQ signal.
Introduction
Interactions of sodium ions with negatively charged groups of macromolecules, proteins, result in a sodium triple-quantum(TQ) signal. By this intrinsic selectivity, the sodium TQ signal yields a sensitive parameter for an intracellular environment and thus may be a potential biomarker for cell viability1,2. In addition to the known TQ signal dependencies on the protein and sodium concentrations3 as well as the transverse relaxation times4, it was recently shown5 that the TQ signal also depends on the pH value which was demonstrated using protein solutions of bovine serum albumin(BSA). This additional dependence is of importance for ischemic conditions, e.g. ischemic stroke, and is caused by a change in the availability of negatively charged groups of proteins. Nevertheless, a correlation of the sodium TQ signal with the availability of negatively charged groups of proteins during pH variation remains to be verified.In this study, we compared the sodium TQ signal of three amino acids and the protein α-lactalbumin(α-LA) with corresponding TQ signals from BSA. A TQ signal in the presence of amino acids with their known pKa values allows a correlation of the TQ signal with the availability of negatively charged groups during pH variation. This is in contrast to proteins, where the pKa value of each negatively charged group depends on the location within the protein and the surrounding charged groups6. Nonetheless, a comparison of the sodium TQ signal using different proteins could further result in valuable insights into the underlying mechanisms. Therefore, we selected α-LA, which has been widely studied and has a well-known protein structure with a small amino acid length of 123, to compare with BSA. With its large amino acid length of 583, BSA has been widely used as a model system for sodium TQ measurements5,7,8.
Material and Methods
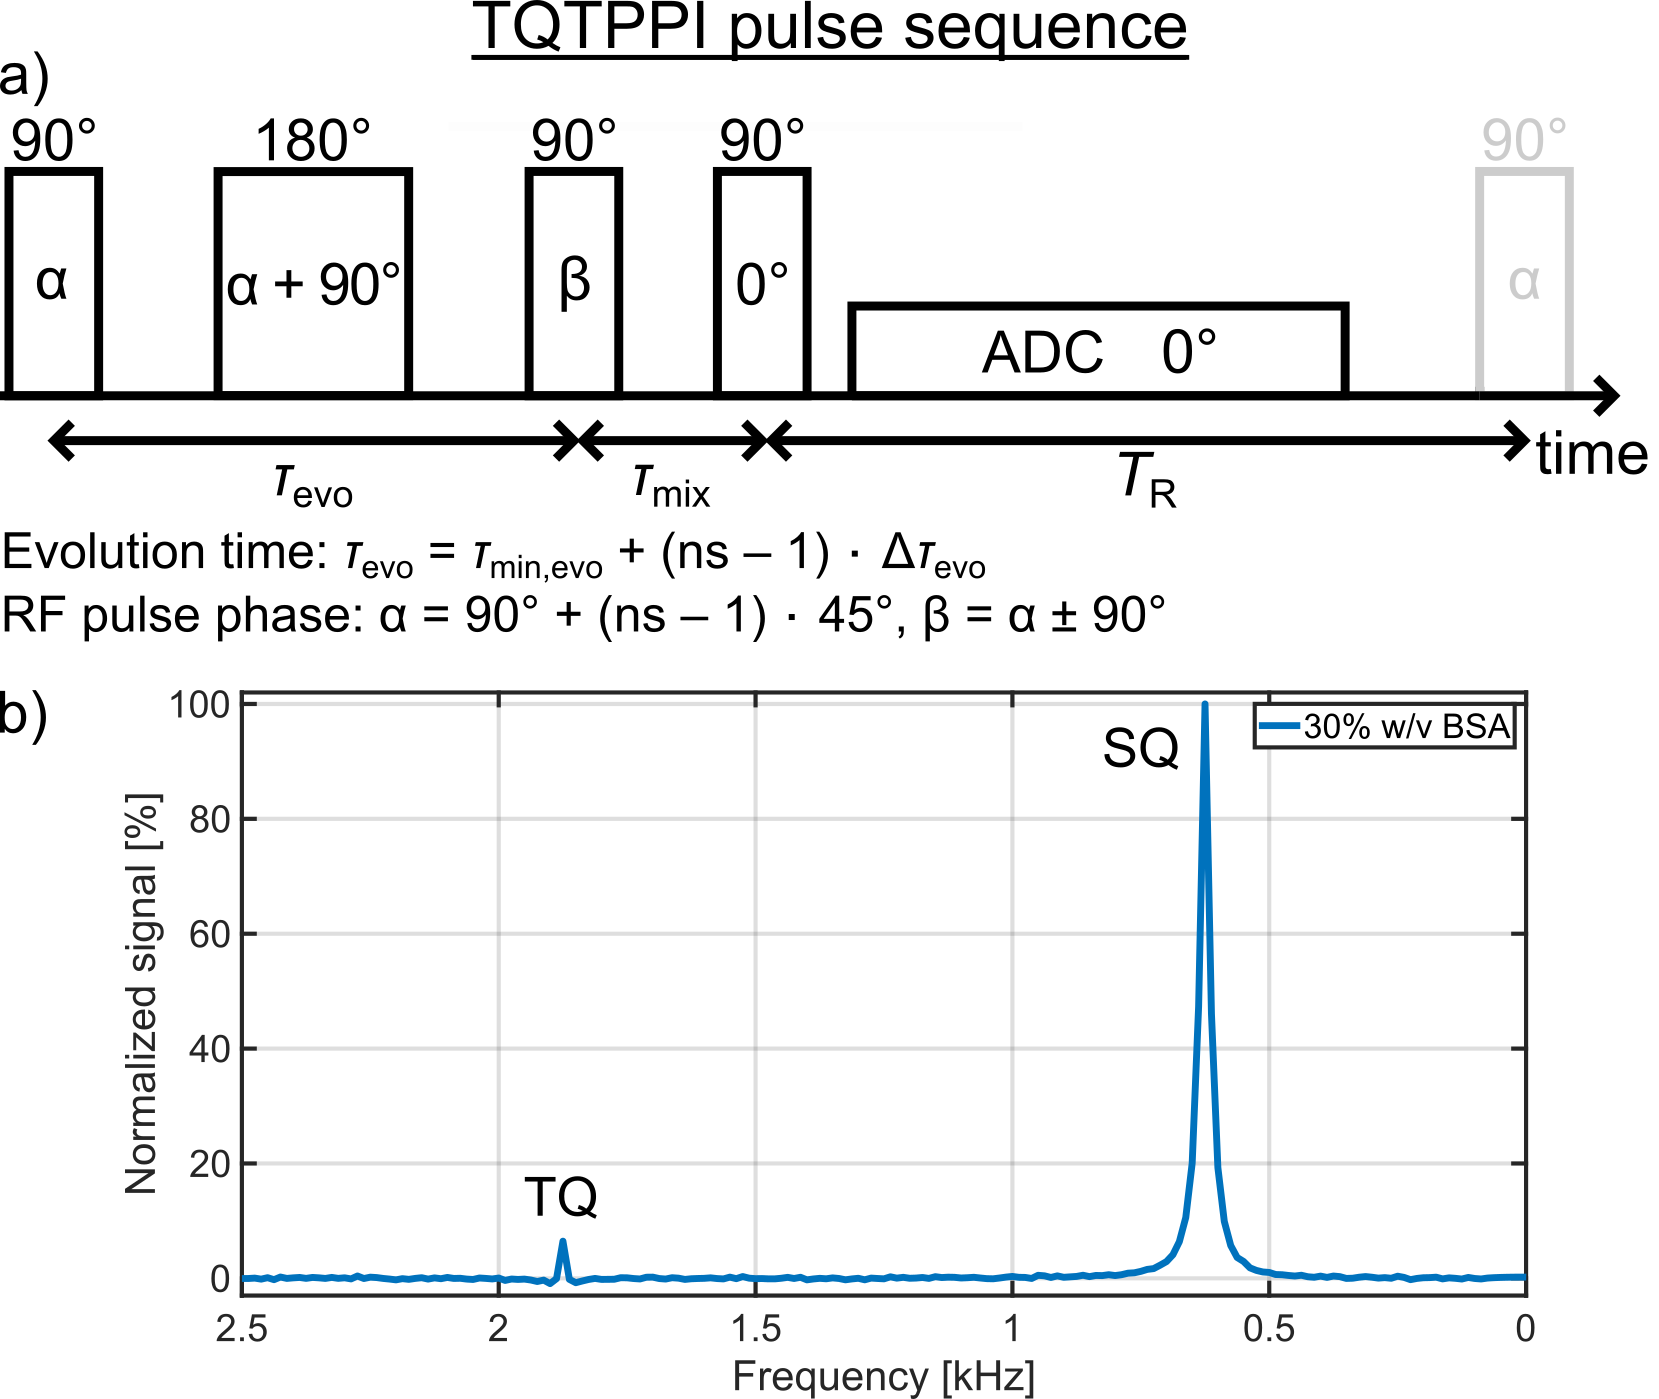
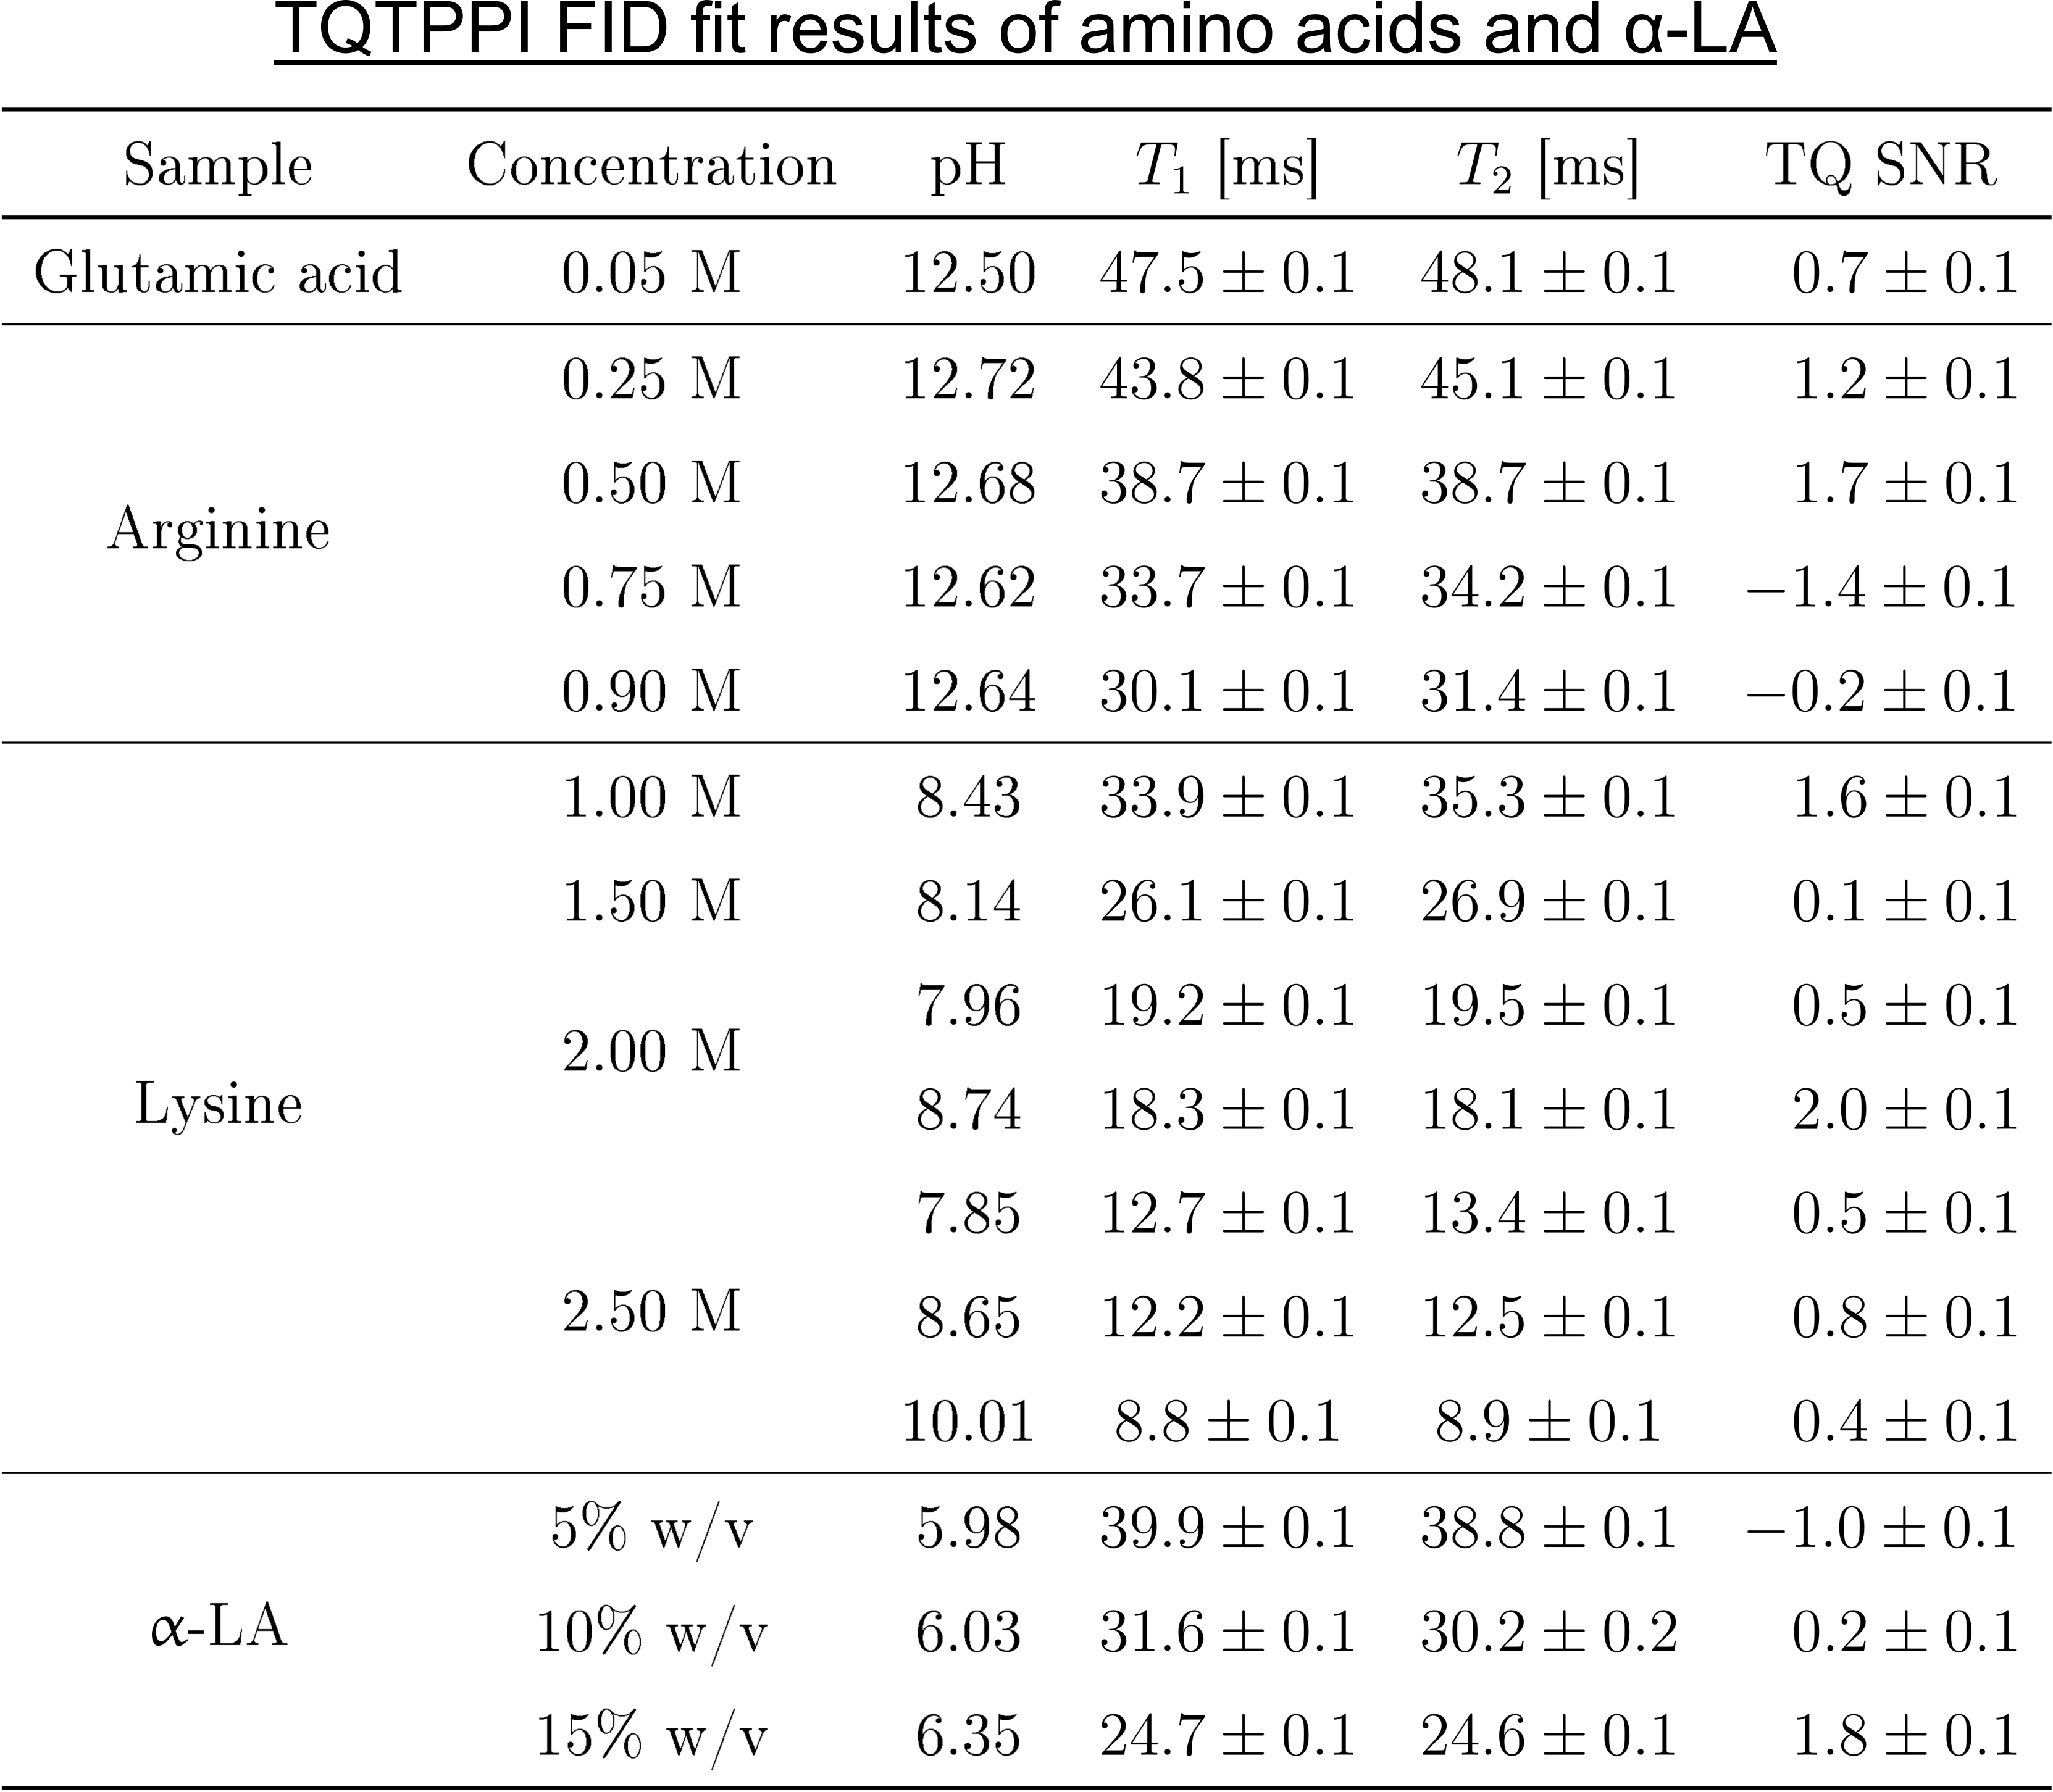
Measurements were performed at a 9.4T preclinical MRI(Bruker). A 1H/23Na Rapid volume coil combined with a 23Na Rapid surface coil was used for the TQ measurements of the amino acid samples, while a 1H/23Na Bruker volume coil was used for the TQ measurements of the protein samples with α-LA or BSA.The single-quantum(SQ) and TQ signals were detected simultaneously at distinct frequencies using a TQ time proportional phase incrementation(TQTPPI) pulse sequence9(Fig.1a). The TQTPPI pulse sequence consists of a simultaneous increment of the evolution time and the RF pulse phase. This allows an equal and optimal detection of the sodium TQ signal for a wide range of ion interaction strengths. In addition, it separates the SQ and TQ signals at distinct frequencies in a second dimension(Fig.1b). The TQTPPI FID was nonlinearly fitted according to9. In the case of a TQ |SNR| < 3, the TQ term in the fit function was omitted and the TQTPPI FID was only fitted by a mono-exponential SQ signal decay5. The TQ signal-to-noise ratio (SNR) was calculated via SNR = (TQ peak height)/σnoise, where σnoise was the standard deviation of noise signal in the TQTPPI spectrum. The TQTPPI pulse sequence parameters were: TR=5T1, 10-30 averages, Δτevo=0.2ms, 440-800 phase steps. The T1 value was determined with an inversion recovery pulse sequence.
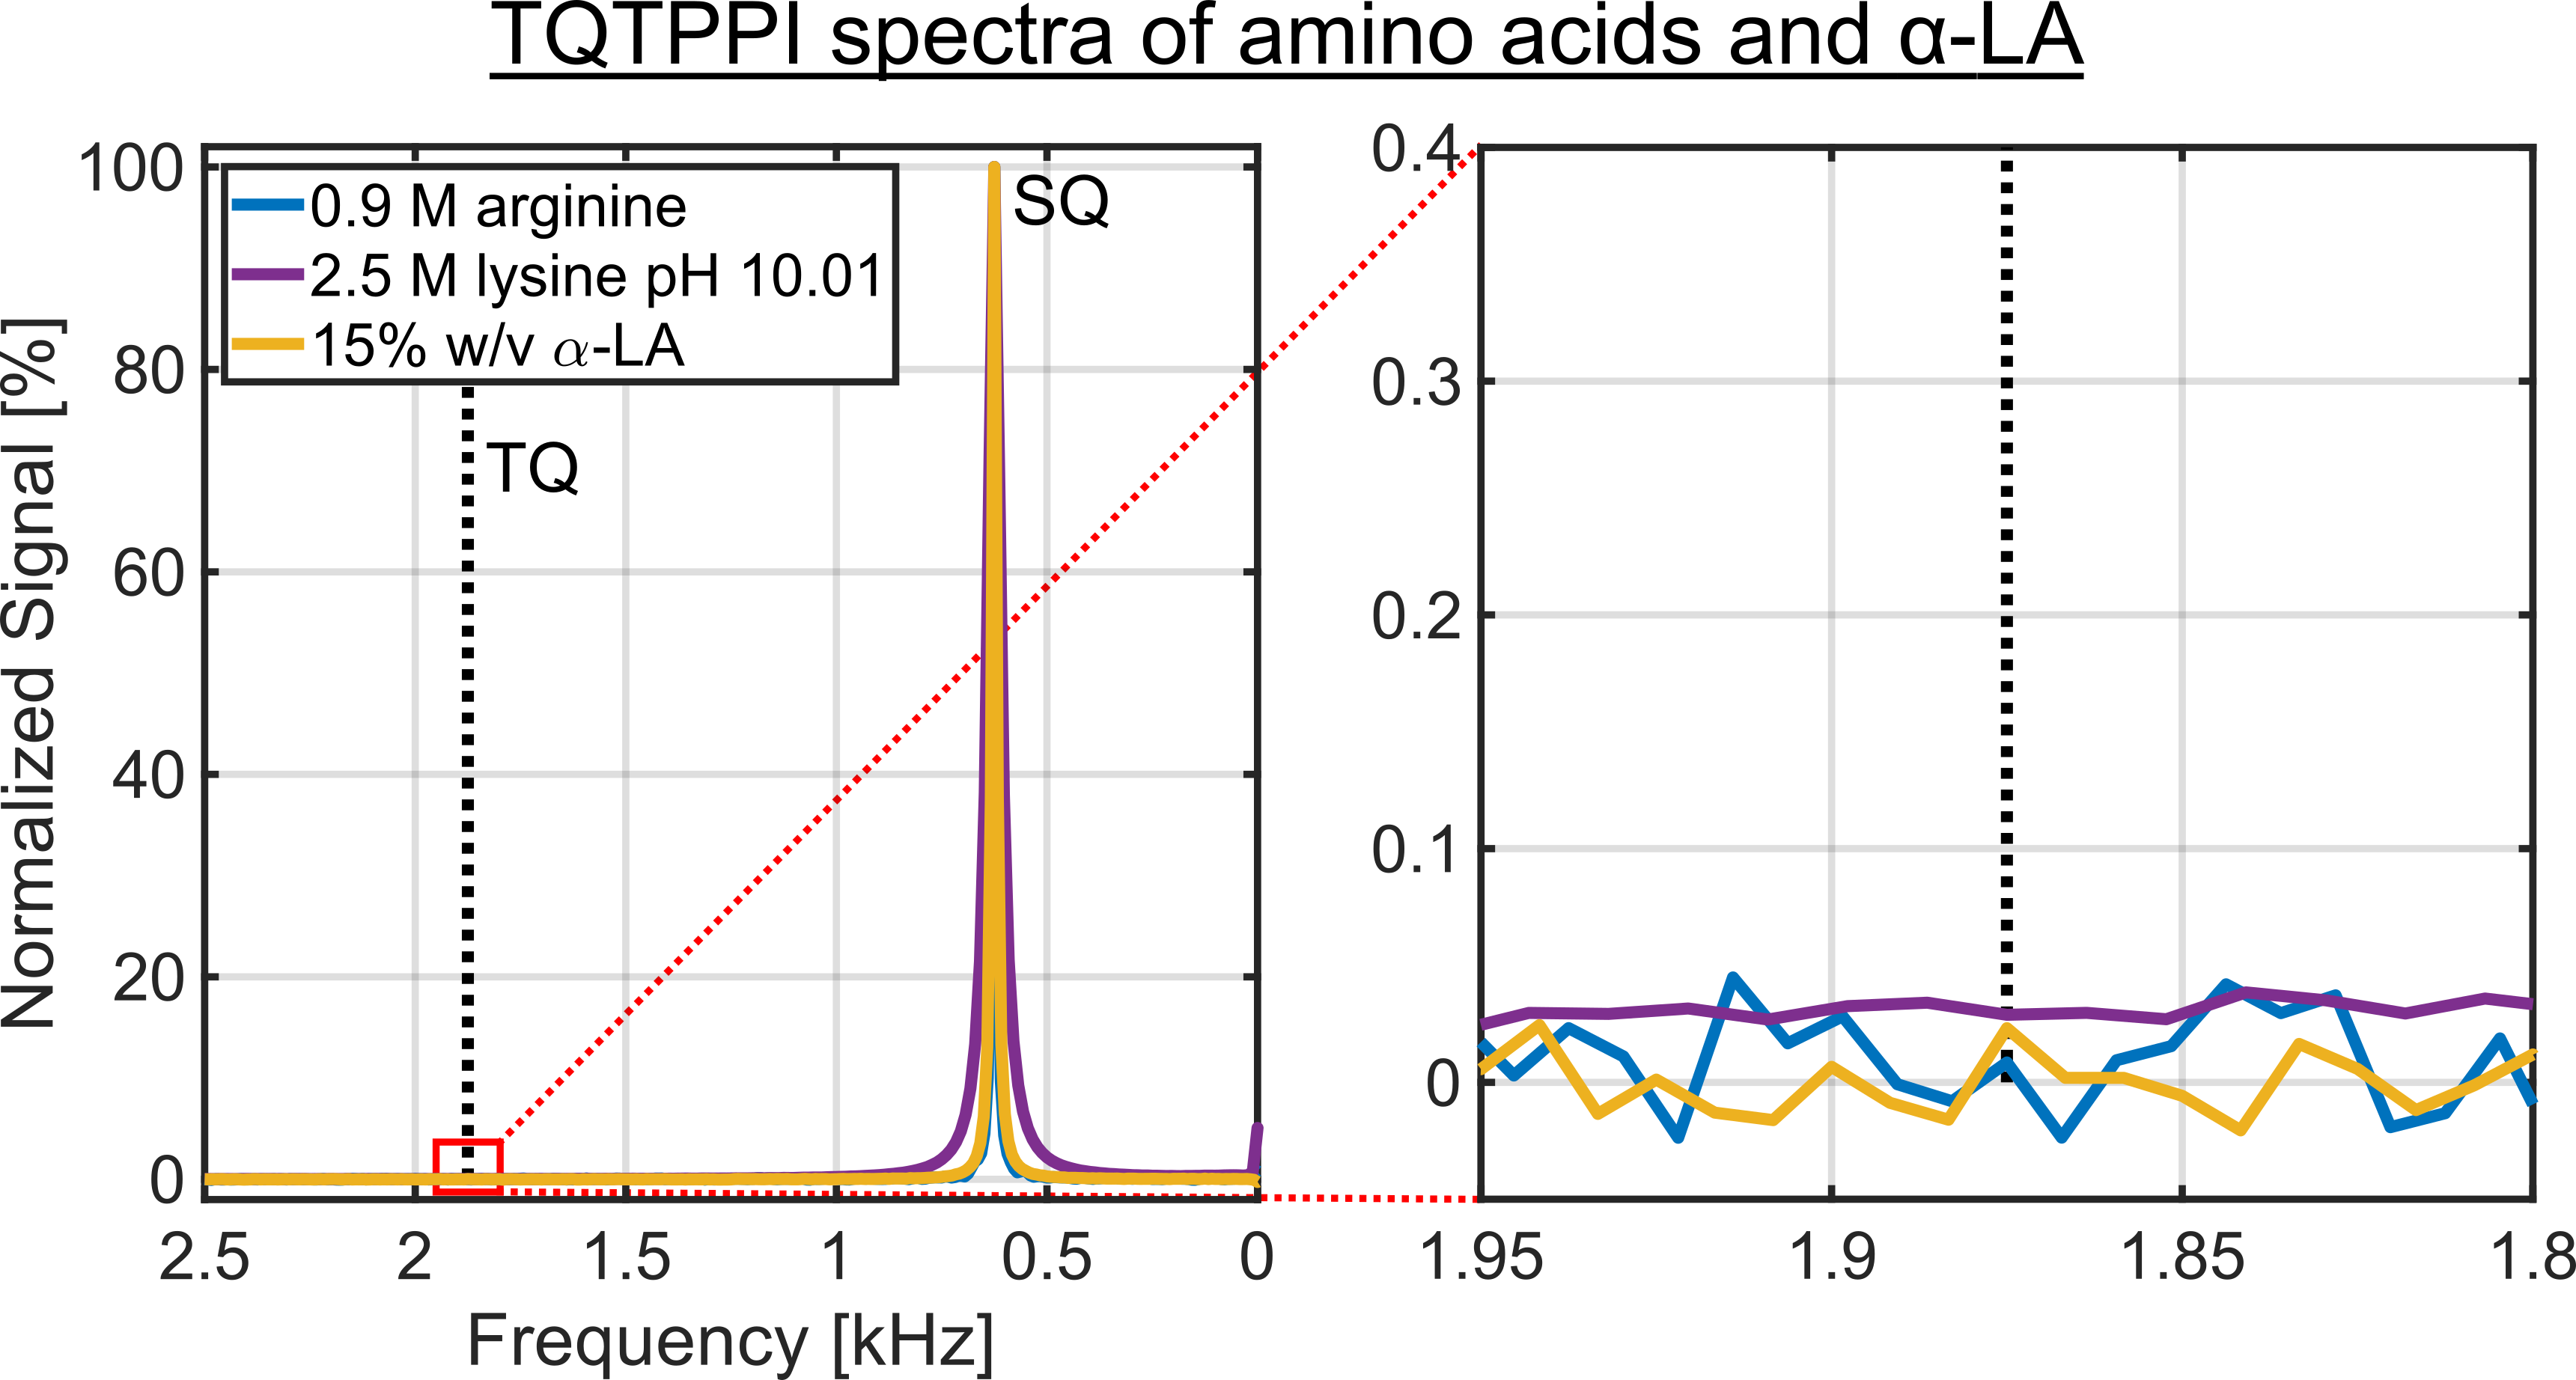
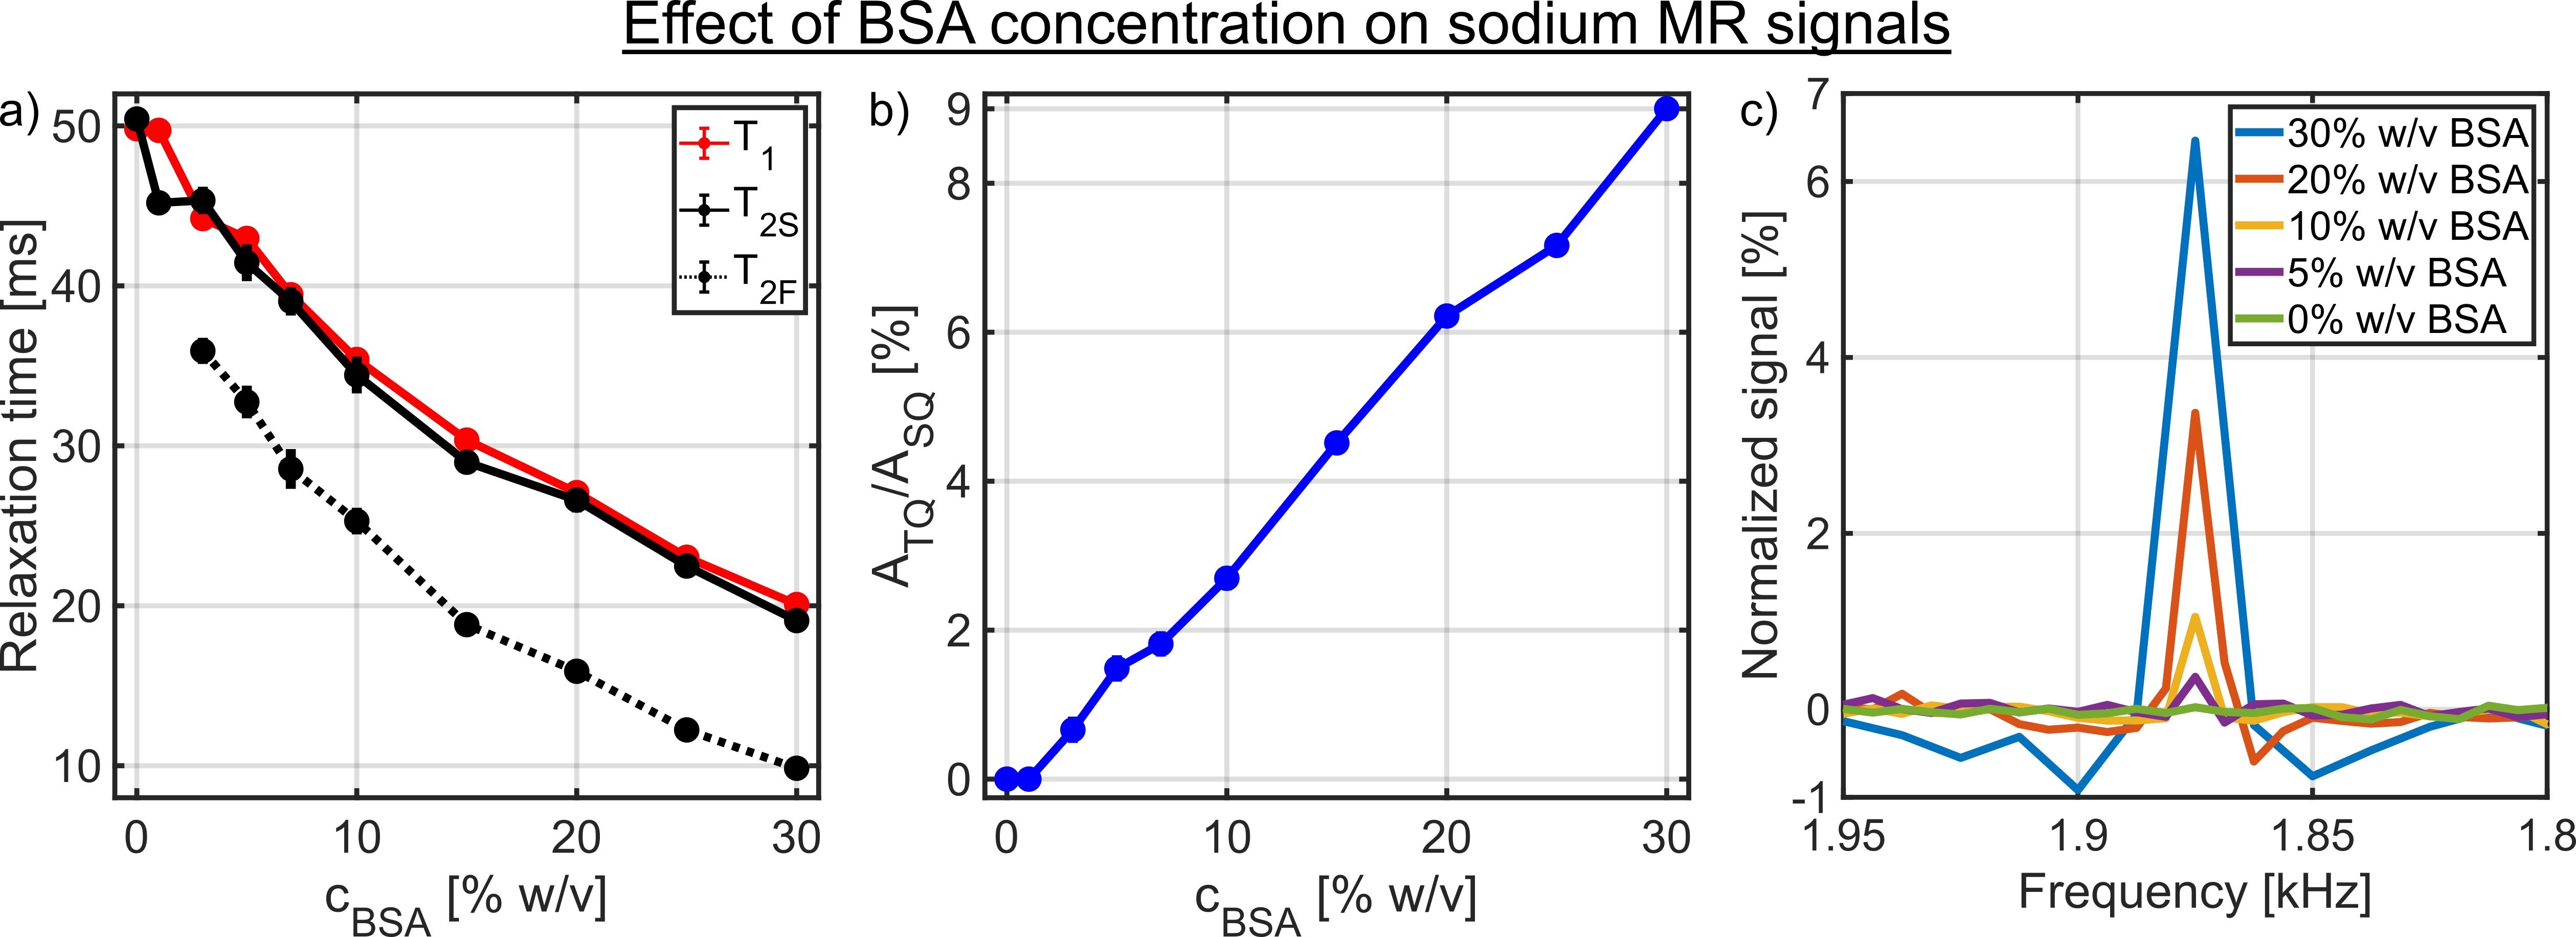
The amino acid samples consisted of either [0.25, 0.5, 0.75, 0.9]M arginine, 0.05M glutamic acid or [1.0, 1.5, 2.0, 2.5]M lysine in 154mM NaOH(Fig.2). One sample with 2M lysine was also prepared in 616mM NaOH, while two samples with 2.5M lysine were additionally prepared in 616mM and 2926mM NaOH. NaOH was chosen to maximize the pH value and thus the availability of negatively charged groups. The samples with [5, 10, 15]% w/v α-LA or [0, 3, 5, 7, 10, 15, 20, 25, 30]% w/v BSA contained 154mM NaCl. The pH value of the BSA samples was 6.92, while the pH values of the other samples are shown in Fig.2.
Results and Discussion
Despite a significant reduction in the sodium relaxation times, the sodium TQ SNR was less than three in all samples containing amino acids or α-LA(Fig.2 and Fig.3). This indicates that the tumbling time of these molecules is too short for the formation of a sodium TQ signal. A similar effect was observed by others in samples containing urea5 or glycerol9, where these molecules also caused a significant reduction in the relaxation times without a detectable sodium TQ signal. In contrast to the samples containing amino acids or α-LA, a sodium TQ signal was already observed for a BSA concentration of 3% w/v(Fig.4). Increasing BSA concentration yielded an almost linear increase in the sodium TQ signal, while the sodium relaxation times reduced with increasing BSA concentration.Our results demonstrate that a model system composed of only amino acids is not suitable for the correlation of the availability of negatively charged groups with the sodium TQ signal during pH variation. In addition, the absence of a sodium TQ signal in the samples containing the protein α-LA raises the important question about the minimum size of a protein capable to yield a sodium TQ signal.
Conclusion
Amino acids and α-LA up to their highest concentration dissolvable in water did not yield a sodium TQ signal, which is in contrast to BSA. Consequently, these molecules can only contribute to a shortening of sodium relaxation times in vivo without a detectable TQ signal.Acknowledgements
One of the authors (Schepkin, V.D.) would like to acknowledge the support from the National Science Foundation through NSF/DMR-1644779 and the State of Florida.References
1. Schepkin VD, Choy IO, Budinger TF, et al. Sodium TQF NMR and intracellular sodium in isolated crystalloid perfused rat heart. Magn Reson Med. 1998;39(4):557-563.
2. Schepkin VD, Choy IO, Budinger TF, Young JN, DeCampli WM. Multi-dose crystalloid cardioplegia preserves intracellular sodium homeostasis in myocardium. J Mol Cell Cardiol. 1999;31(9):1643-1651.
3. Dizon JM, Tauskela JS, Wise D, Burkhoff D, Cannon PJ, Katz J. Evaluation of triple-quantum-filtered 23Na NMR in monitoring of Intracellular Na content in the perfused rat heart: comparison of intra- and extracellular transverse relaxation and spectral amplitudes. Magn Reson Med. 1996;35(3):336-345.
4. Jaccard G, Wimperis S, Bodenhausen G. Multiple‐quantum NMR spectroscopy of S=3/2 spins in isotropic phase: A new probe for multiexponential relaxation. J Chem Phys. 1986;85(11):6282-6293.
5. Kleimaier D, Schepkin V, Hu R, Schad LR. Protein conformational changes affect the sodium triple-quantum MR signal. NMR Biomed. 2020;33(10):e4367.
6. Grimsley GR, Scholtz JM, Pace CN. A summary of the measured pK values of the ionizable groups in folded proteins. Protein Sci. 2009;18(1):247-251.
7. Torres AM, Philp DJ, Kemp-Harper R, Garvey C, Kuchel PW. Determination of Na+ binding parameters by relaxation analysis of selected 23Na NMR coherences: RNA, BSA and SDS. Magn Reson Chem. 2005;43(3):217-224.
8. Rooney WD, Springer CS. The molecular environment of intracellular sodium: 23Na NMR relaxation. NMR Biomed. 1991;4(5):227-245.
9. Schepkin VD, Neubauer A, Nagel AM, Budinger TF. Comparison of potassium and sodium binding in vivo and in agarose samples using TQTPPI pulse sequence. J Magn Reson. 2017;277:162-168.
Figures